Chippewa vs Choctaw Hearing Disability
COMPARE
Chippewa
Choctaw
Hearing Disability
Hearing Disability Comparison
Chippewa
Choctaw
4.0%
HEARING DISABILITY
0.0/ 100
METRIC RATING
319th/ 347
METRIC RANK
4.5%
HEARING DISABILITY
0.0/ 100
METRIC RATING
339th/ 347
METRIC RANK
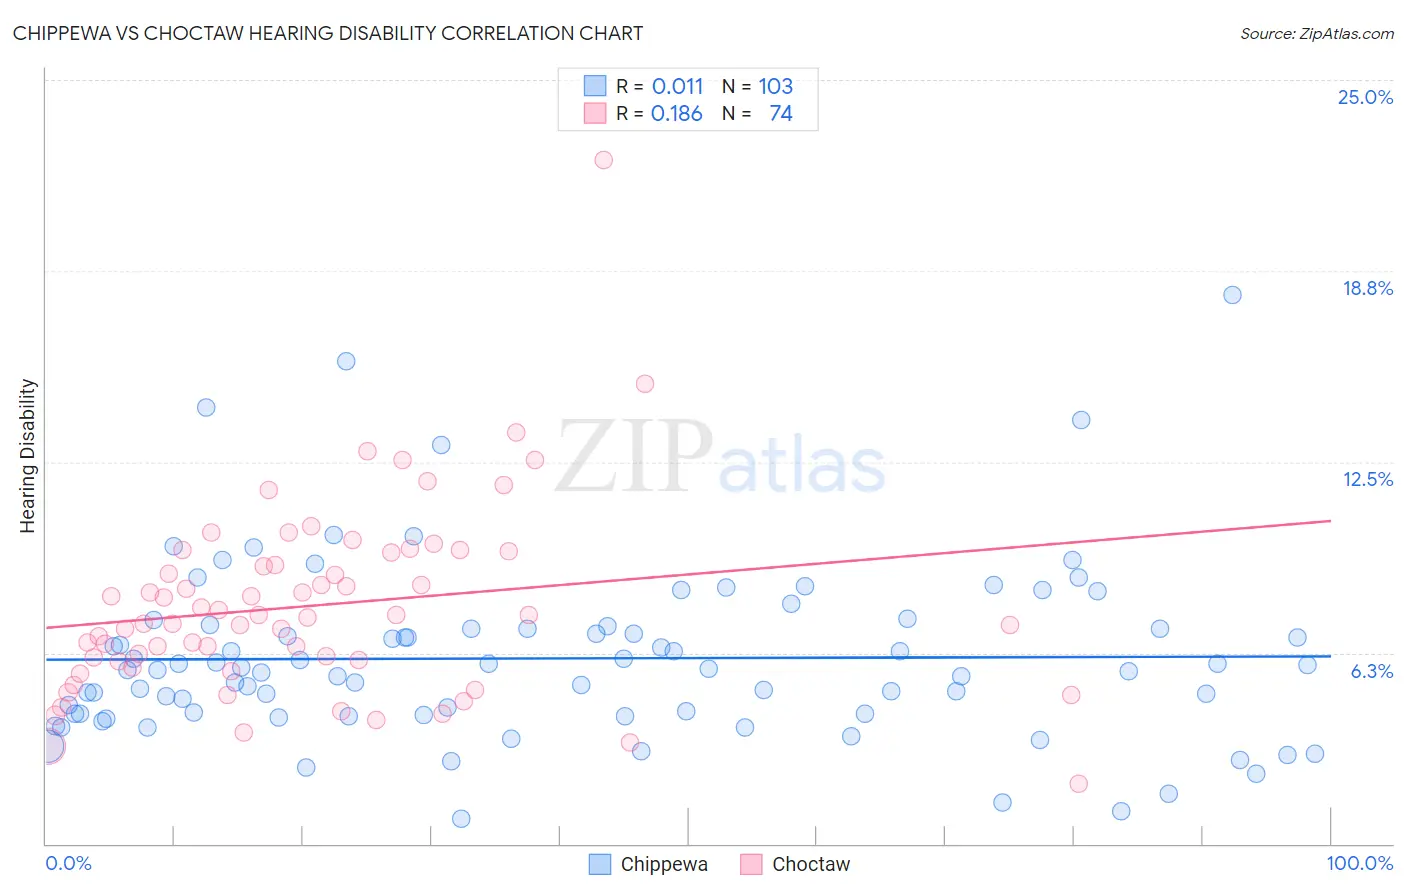
Chippewa vs Choctaw Hearing Disability Correlation Chart
The statistical analysis conducted on geographies consisting of 215,037,759 people shows no correlation between the proportion of Chippewa and percentage of population with hearing disability in the United States with a correlation coefficient (R) of 0.011 and weighted average of 4.0%. Similarly, the statistical analysis conducted on geographies consisting of 269,646,224 people shows a poor positive correlation between the proportion of Choctaw and percentage of population with hearing disability in the United States with a correlation coefficient (R) of 0.186 and weighted average of 4.5%, a difference of 13.9%.
Hearing Disability Correlation Summary
| Measurement | Chippewa | Choctaw |
| Minimum | 0.81% | 1.9% |
| Maximum | 17.9% | 22.4% |
| Range | 17.1% | 20.4% |
| Mean | 6.1% | 7.8% |
| Median | 5.7% | 7.4% |
| Interquartile 25% (IQ1) | 4.2% | 6.0% |
| Interquartile 75% (IQ3) | 7.0% | 9.5% |
| Interquartile Range (IQR) | 2.8% | 3.6% |
| Standard Deviation (Sample) | 2.9% | 3.1% |
| Standard Deviation (Population) | 2.9% | 3.1% |
Demographics Similar to Chippewa and Choctaw by Hearing Disability
In terms of hearing disability, the demographic groups most similar to Chippewa are Shoshone (4.0%, a difference of 0.81%), Paiute (4.1%, a difference of 2.1%), Seminole (4.1%, a difference of 2.3%), Apache (4.1%, a difference of 2.5%), and Osage (4.1%, a difference of 2.5%). Similarly, the demographic groups most similar to Choctaw are Alaska Native (4.5%, a difference of 1.4%), Chickasaw (4.5%, a difference of 1.6%), Creek (4.4%, a difference of 4.2%), Kiowa (4.3%, a difference of 4.9%), and Aleut (4.3%, a difference of 6.3%).
| Demographics | Rating | Rank | Hearing Disability |
| Chippewa | 0.0 /100 | #319 | Tragic 4.0% |
| Shoshone | 0.0 /100 | #320 | Tragic 4.0% |
| Paiute | 0.0 /100 | #321 | Tragic 4.1% |
| Seminole | 0.0 /100 | #322 | Tragic 4.1% |
| Apache | 0.0 /100 | #323 | Tragic 4.1% |
| Osage | 0.0 /100 | #324 | Tragic 4.1% |
| Lumbee | 0.0 /100 | #325 | Tragic 4.1% |
| Potawatomi | 0.0 /100 | #326 | Tragic 4.1% |
| Arapaho | 0.0 /100 | #327 | Tragic 4.1% |
| Tohono O'odham | 0.0 /100 | #328 | Tragic 4.2% |
| Crow | 0.0 /100 | #329 | Tragic 4.2% |
| Natives/Alaskans | 0.0 /100 | #330 | Tragic 4.2% |
| Cherokee | 0.0 /100 | #331 | Tragic 4.2% |
| Houma | 0.0 /100 | #332 | Tragic 4.2% |
| Dutch West Indians | 0.0 /100 | #333 | Tragic 4.3% |
| Aleuts | 0.0 /100 | #334 | Tragic 4.3% |
| Kiowa | 0.0 /100 | #335 | Tragic 4.3% |
| Creek | 0.0 /100 | #336 | Tragic 4.4% |
| Chickasaw | 0.0 /100 | #337 | Tragic 4.5% |
| Alaska Natives | 0.0 /100 | #338 | Tragic 4.5% |
| Choctaw | 0.0 /100 | #339 | Tragic 4.5% |