Chinese vs Chickasaw Vision Disability
COMPARE
Chinese
Chickasaw
Vision Disability
Vision Disability Comparison
Chinese
Chickasaw
2.0%
VISION DISABILITY
97.2/ 100
METRIC RATING
85th/ 347
METRIC RANK
3.2%
VISION DISABILITY
0.0/ 100
METRIC RATING
338th/ 347
METRIC RANK
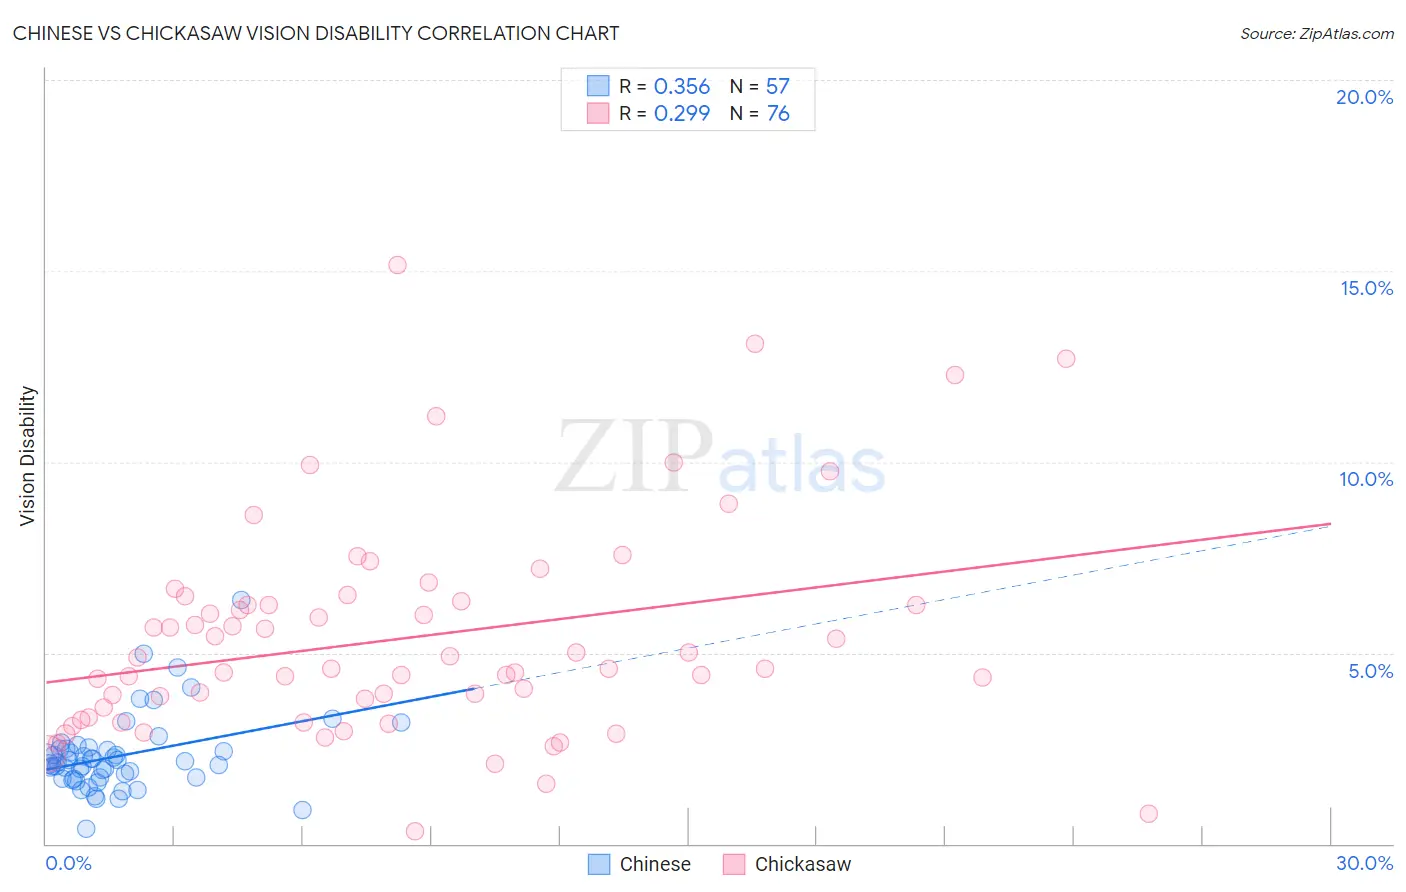
Chinese vs Chickasaw Vision Disability Correlation Chart
The statistical analysis conducted on geographies consisting of 64,795,588 people shows a mild positive correlation between the proportion of Chinese and percentage of population with vision disability in the United States with a correlation coefficient (R) of 0.356 and weighted average of 2.0%. Similarly, the statistical analysis conducted on geographies consisting of 147,658,152 people shows a weak positive correlation between the proportion of Chickasaw and percentage of population with vision disability in the United States with a correlation coefficient (R) of 0.299 and weighted average of 3.2%, a difference of 55.4%.
Vision Disability Correlation Summary
| Measurement | Chinese | Chickasaw |
| Minimum | 0.40% | 0.33% |
| Maximum | 6.4% | 15.2% |
| Range | 6.0% | 14.8% |
| Mean | 2.3% | 5.4% |
| Median | 2.1% | 4.6% |
| Interquartile 25% (IQ1) | 1.7% | 3.5% |
| Interquartile 75% (IQ3) | 2.5% | 6.3% |
| Interquartile Range (IQR) | 0.78% | 2.9% |
| Standard Deviation (Sample) | 1.0% | 2.8% |
| Standard Deviation (Population) | 1.00% | 2.8% |
Similar Demographics by Vision Disability
Demographics Similar to Chinese by Vision Disability
In terms of vision disability, the demographic groups most similar to Chinese are Immigrants from Moldova (2.0%, a difference of 0.020%), Immigrants from Latvia (2.0%, a difference of 0.060%), Immigrants from Switzerland (2.0%, a difference of 0.090%), Norwegian (2.0%, a difference of 0.10%), and Immigrants from Eastern Africa (2.0%, a difference of 0.14%).
| Demographics | Rating | Rank | Vision Disability |
| Immigrants | Eastern Europe | 98.3 /100 | #78 | Exceptional 2.0% |
| Assyrians/Chaldeans/Syriacs | 98.1 /100 | #79 | Exceptional 2.0% |
| Lithuanians | 97.7 /100 | #80 | Exceptional 2.0% |
| Soviet Union | 97.6 /100 | #81 | Exceptional 2.0% |
| Immigrants | Poland | 97.6 /100 | #82 | Exceptional 2.0% |
| Immigrants | Western Asia | 97.5 /100 | #83 | Exceptional 2.0% |
| Immigrants | Latvia | 97.3 /100 | #84 | Exceptional 2.0% |
| Chinese | 97.2 /100 | #85 | Exceptional 2.0% |
| Immigrants | Moldova | 97.2 /100 | #86 | Exceptional 2.0% |
| Immigrants | Switzerland | 97.0 /100 | #87 | Exceptional 2.0% |
| Norwegians | 97.0 /100 | #88 | Exceptional 2.0% |
| Immigrants | Eastern Africa | 97.0 /100 | #89 | Exceptional 2.0% |
| Immigrants | Lebanon | 96.7 /100 | #90 | Exceptional 2.1% |
| Immigrants | Somalia | 96.2 /100 | #91 | Exceptional 2.1% |
| Immigrants | Syria | 96.2 /100 | #92 | Exceptional 2.1% |
Demographics Similar to Chickasaw by Vision Disability
In terms of vision disability, the demographic groups most similar to Chickasaw are Tsimshian (3.2%, a difference of 0.69%), Creek (3.2%, a difference of 0.82%), Dutch West Indian (3.2%, a difference of 0.91%), Alaskan Athabascan (3.1%, a difference of 0.93%), and Navajo (3.1%, a difference of 1.1%).
| Demographics | Rating | Rank | Vision Disability |
| Central American Indians | 0.0 /100 | #331 | Tragic 3.0% |
| Seminole | 0.0 /100 | #332 | Tragic 3.1% |
| Cajuns | 0.0 /100 | #333 | Tragic 3.1% |
| Cheyenne | 0.0 /100 | #334 | Tragic 3.1% |
| Navajo | 0.0 /100 | #335 | Tragic 3.1% |
| Alaskan Athabascans | 0.0 /100 | #336 | Tragic 3.1% |
| Dutch West Indians | 0.0 /100 | #337 | Tragic 3.2% |
| Chickasaw | 0.0 /100 | #338 | Tragic 3.2% |
| Tsimshian | 0.0 /100 | #339 | Tragic 3.2% |
| Creek | 0.0 /100 | #340 | Tragic 3.2% |
| Kiowa | 0.0 /100 | #341 | Tragic 3.3% |
| Choctaw | 0.0 /100 | #342 | Tragic 3.3% |
| Pima | 0.0 /100 | #343 | Tragic 3.3% |
| Pueblo | 0.0 /100 | #344 | Tragic 3.3% |
| Lumbee | 0.0 /100 | #345 | Tragic 3.4% |