Chinese vs Belgian Vision Disability
COMPARE
Chinese
Belgian
Vision Disability
Vision Disability Comparison
Chinese
Belgians
2.0%
VISION DISABILITY
97.2/ 100
METRIC RATING
85th/ 347
METRIC RANK
2.1%
VISION DISABILITY
75.9/ 100
METRIC RATING
150th/ 347
METRIC RANK
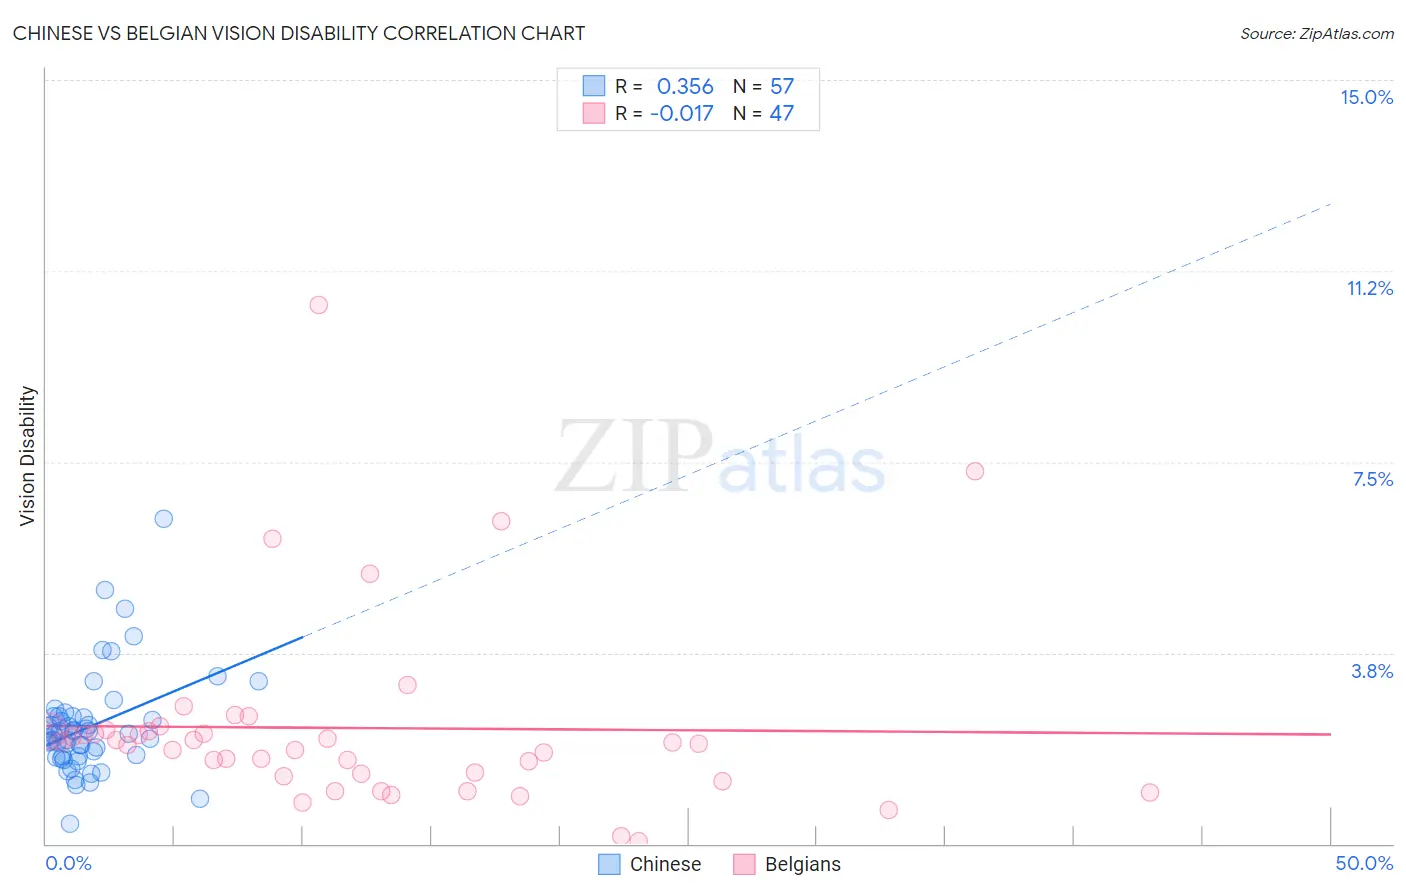
Chinese vs Belgian Vision Disability Correlation Chart
The statistical analysis conducted on geographies consisting of 64,795,588 people shows a mild positive correlation between the proportion of Chinese and percentage of population with vision disability in the United States with a correlation coefficient (R) of 0.356 and weighted average of 2.0%. Similarly, the statistical analysis conducted on geographies consisting of 355,727,371 people shows no correlation between the proportion of Belgians and percentage of population with vision disability in the United States with a correlation coefficient (R) of -0.017 and weighted average of 2.1%, a difference of 4.0%.
Vision Disability Correlation Summary
| Measurement | Chinese | Belgian |
| Minimum | 0.40% | 0.061% |
| Maximum | 6.4% | 10.6% |
| Range | 6.0% | 10.5% |
| Mean | 2.3% | 2.3% |
| Median | 2.1% | 2.0% |
| Interquartile 25% (IQ1) | 1.7% | 1.3% |
| Interquartile 75% (IQ3) | 2.5% | 2.2% |
| Interquartile Range (IQR) | 0.78% | 0.89% |
| Standard Deviation (Sample) | 1.0% | 1.9% |
| Standard Deviation (Population) | 1.00% | 1.9% |
Similar Demographics by Vision Disability
Demographics Similar to Chinese by Vision Disability
In terms of vision disability, the demographic groups most similar to Chinese are Immigrants from Moldova (2.0%, a difference of 0.020%), Immigrants from Latvia (2.0%, a difference of 0.060%), Immigrants from Switzerland (2.0%, a difference of 0.090%), Norwegian (2.0%, a difference of 0.10%), and Immigrants from Eastern Africa (2.0%, a difference of 0.14%).
| Demographics | Rating | Rank | Vision Disability |
| Immigrants | Eastern Europe | 98.3 /100 | #78 | Exceptional 2.0% |
| Assyrians/Chaldeans/Syriacs | 98.1 /100 | #79 | Exceptional 2.0% |
| Lithuanians | 97.7 /100 | #80 | Exceptional 2.0% |
| Soviet Union | 97.6 /100 | #81 | Exceptional 2.0% |
| Immigrants | Poland | 97.6 /100 | #82 | Exceptional 2.0% |
| Immigrants | Western Asia | 97.5 /100 | #83 | Exceptional 2.0% |
| Immigrants | Latvia | 97.3 /100 | #84 | Exceptional 2.0% |
| Chinese | 97.2 /100 | #85 | Exceptional 2.0% |
| Immigrants | Moldova | 97.2 /100 | #86 | Exceptional 2.0% |
| Immigrants | Switzerland | 97.0 /100 | #87 | Exceptional 2.0% |
| Norwegians | 97.0 /100 | #88 | Exceptional 2.0% |
| Immigrants | Eastern Africa | 97.0 /100 | #89 | Exceptional 2.0% |
| Immigrants | Lebanon | 96.7 /100 | #90 | Exceptional 2.1% |
| Immigrants | Somalia | 96.2 /100 | #91 | Exceptional 2.1% |
| Immigrants | Syria | 96.2 /100 | #92 | Exceptional 2.1% |
Demographics Similar to Belgians by Vision Disability
In terms of vision disability, the demographic groups most similar to Belgians are Colombian (2.1%, a difference of 0.030%), Immigrants from Norway (2.1%, a difference of 0.040%), Immigrants from Southern Europe (2.1%, a difference of 0.11%), Immigrants from South America (2.1%, a difference of 0.18%), and Slovene (2.1%, a difference of 0.19%).
| Demographics | Rating | Rank | Vision Disability |
| Immigrants | Sierra Leone | 82.8 /100 | #143 | Excellent 2.1% |
| Ukrainians | 81.9 /100 | #144 | Excellent 2.1% |
| Immigrants | Bosnia and Herzegovina | 81.5 /100 | #145 | Excellent 2.1% |
| Italians | 79.7 /100 | #146 | Good 2.1% |
| Immigrants | Sudan | 78.4 /100 | #147 | Good 2.1% |
| Finns | 78.3 /100 | #148 | Good 2.1% |
| Colombians | 76.2 /100 | #149 | Good 2.1% |
| Belgians | 75.9 /100 | #150 | Good 2.1% |
| Immigrants | Norway | 75.5 /100 | #151 | Good 2.1% |
| Immigrants | Southern Europe | 74.6 /100 | #152 | Good 2.1% |
| Immigrants | South America | 73.8 /100 | #153 | Good 2.1% |
| Slovenes | 73.6 /100 | #154 | Good 2.1% |
| Immigrants | Colombia | 72.1 /100 | #155 | Good 2.1% |
| Pakistanis | 71.6 /100 | #156 | Good 2.1% |
| Serbians | 70.2 /100 | #157 | Good 2.1% |