Chinese vs Immigrants from Burma/Myanmar Vision Disability
COMPARE
Chinese
Immigrants from Burma/Myanmar
Vision Disability
Vision Disability Comparison
Chinese
Immigrants from Burma/Myanmar
2.0%
VISION DISABILITY
97.2/ 100
METRIC RATING
85th/ 347
METRIC RANK
2.2%
VISION DISABILITY
37.9/ 100
METRIC RATING
183rd/ 347
METRIC RANK
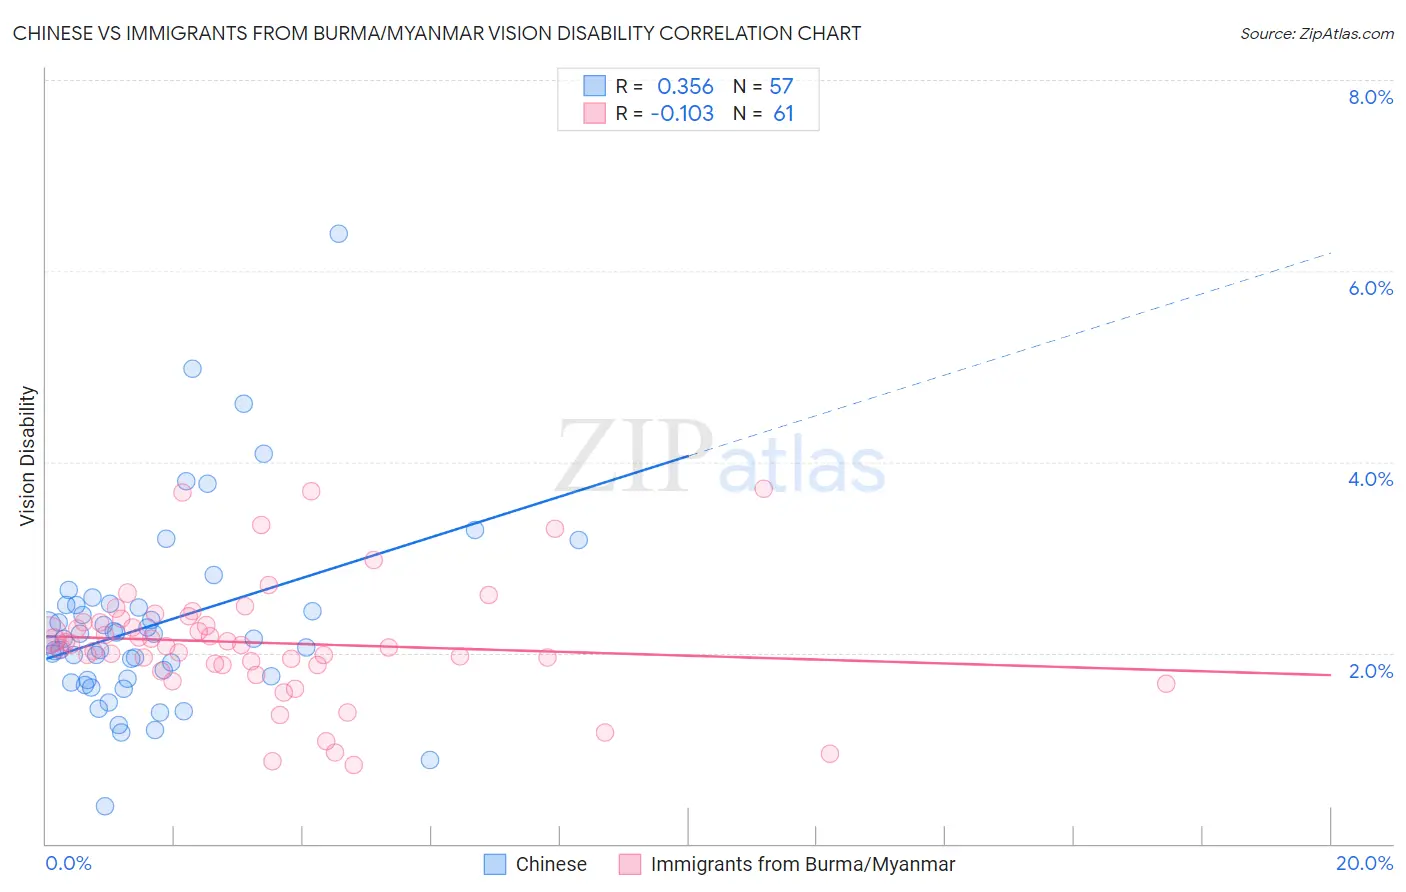
Chinese vs Immigrants from Burma/Myanmar Vision Disability Correlation Chart
The statistical analysis conducted on geographies consisting of 64,795,588 people shows a mild positive correlation between the proportion of Chinese and percentage of population with vision disability in the United States with a correlation coefficient (R) of 0.356 and weighted average of 2.0%. Similarly, the statistical analysis conducted on geographies consisting of 172,315,861 people shows a poor negative correlation between the proportion of Immigrants from Burma/Myanmar and percentage of population with vision disability in the United States with a correlation coefficient (R) of -0.103 and weighted average of 2.2%, a difference of 6.7%.
Vision Disability Correlation Summary
| Measurement | Chinese | Immigrants from Burma/Myanmar |
| Minimum | 0.40% | 0.83% |
| Maximum | 6.4% | 3.7% |
| Range | 6.0% | 2.9% |
| Mean | 2.3% | 2.1% |
| Median | 2.1% | 2.1% |
| Interquartile 25% (IQ1) | 1.7% | 1.9% |
| Interquartile 75% (IQ3) | 2.5% | 2.3% |
| Interquartile Range (IQR) | 0.78% | 0.47% |
| Standard Deviation (Sample) | 1.0% | 0.62% |
| Standard Deviation (Population) | 1.00% | 0.62% |
Similar Demographics by Vision Disability
Demographics Similar to Chinese by Vision Disability
In terms of vision disability, the demographic groups most similar to Chinese are Immigrants from Moldova (2.0%, a difference of 0.020%), Immigrants from Latvia (2.0%, a difference of 0.060%), Immigrants from Switzerland (2.0%, a difference of 0.090%), Norwegian (2.0%, a difference of 0.10%), and Immigrants from Eastern Africa (2.0%, a difference of 0.14%).
| Demographics | Rating | Rank | Vision Disability |
| Immigrants | Eastern Europe | 98.3 /100 | #78 | Exceptional 2.0% |
| Assyrians/Chaldeans/Syriacs | 98.1 /100 | #79 | Exceptional 2.0% |
| Lithuanians | 97.7 /100 | #80 | Exceptional 2.0% |
| Soviet Union | 97.6 /100 | #81 | Exceptional 2.0% |
| Immigrants | Poland | 97.6 /100 | #82 | Exceptional 2.0% |
| Immigrants | Western Asia | 97.5 /100 | #83 | Exceptional 2.0% |
| Immigrants | Latvia | 97.3 /100 | #84 | Exceptional 2.0% |
| Chinese | 97.2 /100 | #85 | Exceptional 2.0% |
| Immigrants | Moldova | 97.2 /100 | #86 | Exceptional 2.0% |
| Immigrants | Switzerland | 97.0 /100 | #87 | Exceptional 2.0% |
| Norwegians | 97.0 /100 | #88 | Exceptional 2.0% |
| Immigrants | Eastern Africa | 97.0 /100 | #89 | Exceptional 2.0% |
| Immigrants | Lebanon | 96.7 /100 | #90 | Exceptional 2.1% |
| Immigrants | Somalia | 96.2 /100 | #91 | Exceptional 2.1% |
| Immigrants | Syria | 96.2 /100 | #92 | Exceptional 2.1% |
Demographics Similar to Immigrants from Burma/Myanmar by Vision Disability
In terms of vision disability, the demographic groups most similar to Immigrants from Burma/Myanmar are Moroccan (2.2%, a difference of 0.17%), Costa Rican (2.2%, a difference of 0.19%), Immigrants from Western Europe (2.2%, a difference of 0.21%), Immigrants from Middle Africa (2.2%, a difference of 0.30%), and Uruguayan (2.2%, a difference of 0.31%).
| Demographics | Rating | Rank | Vision Disability |
| Yugoslavians | 46.5 /100 | #176 | Average 2.2% |
| Slavs | 46.0 /100 | #177 | Average 2.2% |
| Immigrants | Oceania | 45.1 /100 | #178 | Average 2.2% |
| Immigrants | North America | 44.5 /100 | #179 | Average 2.2% |
| Uruguayans | 42.7 /100 | #180 | Average 2.2% |
| Immigrants | Western Europe | 41.1 /100 | #181 | Average 2.2% |
| Costa Ricans | 40.7 /100 | #182 | Average 2.2% |
| Immigrants | Burma/Myanmar | 37.9 /100 | #183 | Fair 2.2% |
| Moroccans | 35.4 /100 | #184 | Fair 2.2% |
| Immigrants | Middle Africa | 33.5 /100 | #185 | Fair 2.2% |
| Native Hawaiians | 33.3 /100 | #186 | Fair 2.2% |
| Immigrants | St. Vincent and the Grenadines | 30.3 /100 | #187 | Fair 2.2% |
| Guyanese | 28.9 /100 | #188 | Fair 2.2% |
| Salvadorans | 27.4 /100 | #189 | Fair 2.2% |
| Immigrants | Costa Rica | 26.1 /100 | #190 | Fair 2.2% |