Zip Codes with the Highest Percentage of Population Employed in Arts, Media & Entertainment in Newark, DE
RELATED REPORTS & OPTIONS
Arts, Media & Entertainment
Newark
Compare Zip Codes
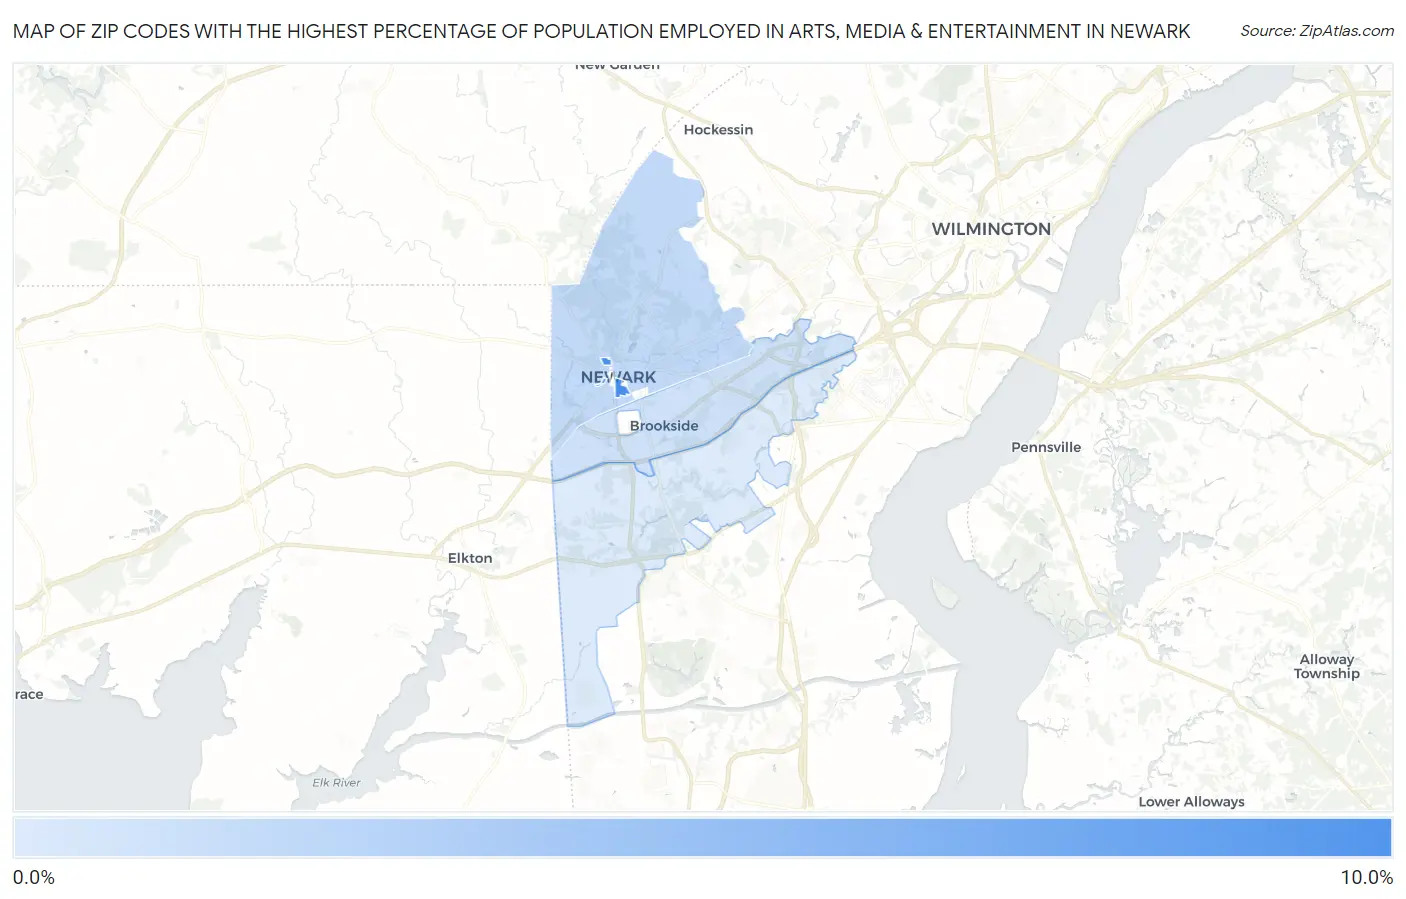
Map of Zip Codes with the Highest Percentage of Population Employed in Arts, Media & Entertainment in Newark
0.69%
8.2%
Zip Codes with the Highest Percentage of Population Employed in Arts, Media & Entertainment in Newark, DE
| Zip Code | % Employed | vs State | vs National | |
| 1. | 19717 | 8.2% | 1.4%(+6.76)#1 | 2.1%(+6.09)#533 |
| 2. | 19711 | 2.1% | 1.4%(+0.663)#15 | 2.1%(-0.004)#7,511 |
| 3. | 19713 | 1.3% | 1.4%(-0.065)#28 | 2.1%(-0.732)#12,244 |
| 4. | 19702 | 0.69% | 1.4%(-0.702)#37 | 2.1%(-1.37)#17,326 |
1
Common Questions
What are the Top 3 Zip Codes with the Highest Percentage of Population Employed in Arts, Media & Entertainment in Newark, DE?
Top 3 Zip Codes with the Highest Percentage of Population Employed in Arts, Media & Entertainment in Newark, DE are:
What zip code has the Highest Percentage of Population Employed in Arts, Media & Entertainment in Newark, DE?
19717 has the Highest Percentage of Population Employed in Arts, Media & Entertainment in Newark, DE with 8.2%.
What is the Percentage of Population Employed in Arts, Media & Entertainment in Newark, DE?
Percentage of Population Employed in Arts, Media & Entertainment in Newark is 4.2%.
What is the Percentage of Population Employed in Arts, Media & Entertainment in Delaware?
Percentage of Population Employed in Arts, Media & Entertainment in Delaware is 1.4%.
What is the Percentage of Population Employed in Arts, Media & Entertainment in the United States?
Percentage of Population Employed in Arts, Media & Entertainment in the United States is 2.1%.