Zip Codes with the Highest Percentage of Population Employed in Agriculture, Fishing & Hunting in Newark, DE
RELATED REPORTS & OPTIONS
Agriculture, Fishing & Hunting
Newark
Compare Zip Codes
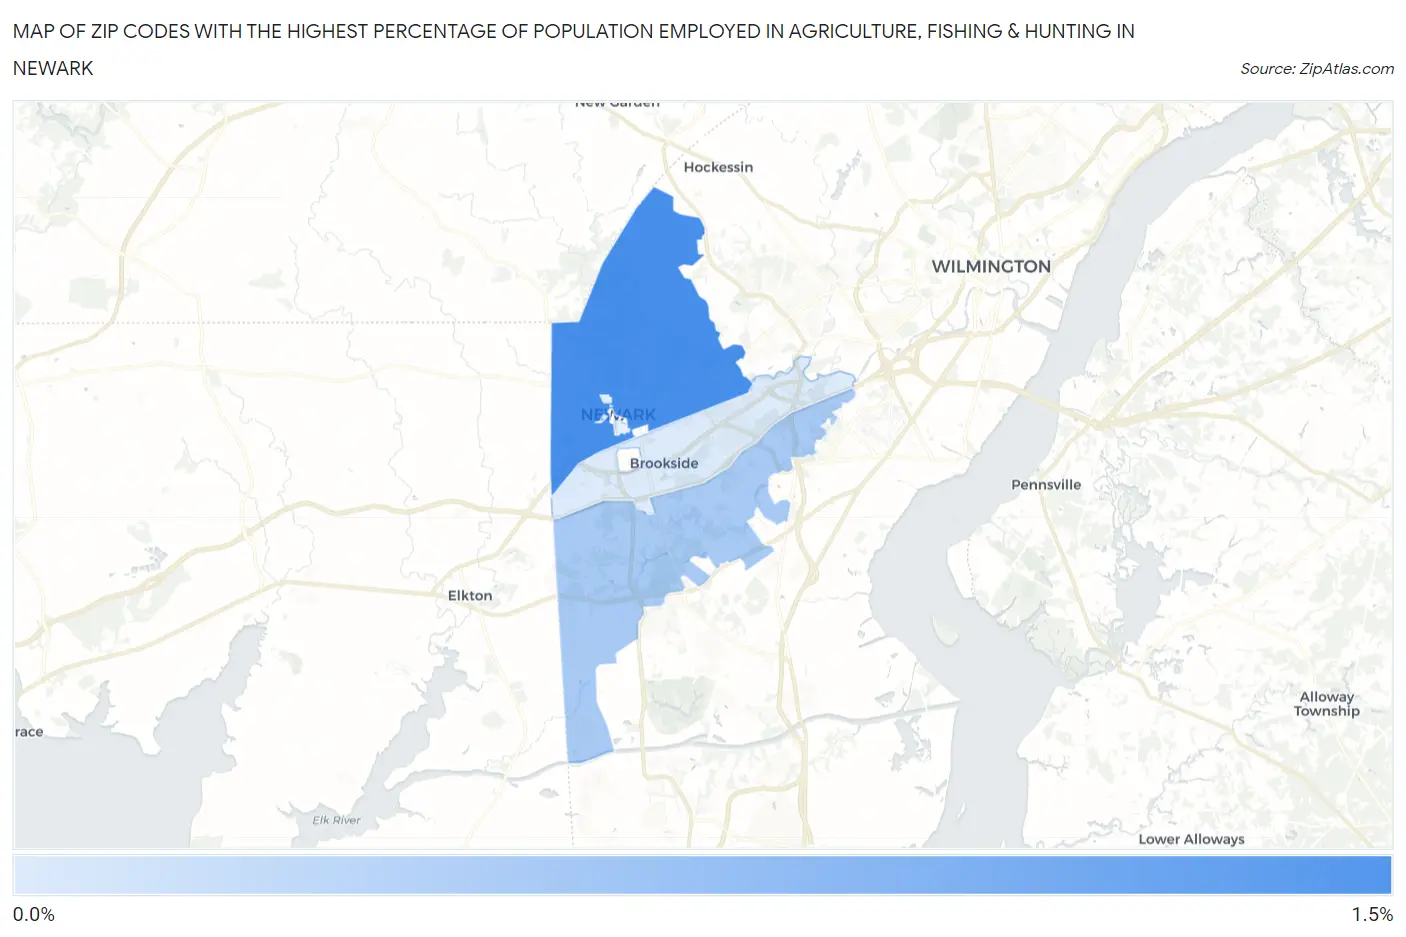
Map of Zip Codes with the Highest Percentage of Population Employed in Agriculture, Fishing & Hunting in Newark
0.23%
1.2%
Zip Codes with the Highest Percentage of Population Employed in Agriculture, Fishing & Hunting in Newark, DE
| Zip Code | % Employed | vs State | vs National | |
| 1. | 19711 | 1.2% | 1.0%(+0.124)#23 | 1.2%(-0.037)#15,551 |
| 2. | 19702 | 0.57% | 1.0%(-0.472)#35 | 1.2%(-0.633)#18,723 |
| 3. | 19713 | 0.23% | 1.0%(-0.806)#46 | 1.2%(-0.967)#21,967 |
1
Common Questions
What are the Top 3 Zip Codes with the Highest Percentage of Population Employed in Agriculture, Fishing & Hunting in Newark, DE?
Top 3 Zip Codes with the Highest Percentage of Population Employed in Agriculture, Fishing & Hunting in Newark, DE are:
What zip code has the Highest Percentage of Population Employed in Agriculture, Fishing & Hunting in Newark, DE?
19711 has the Highest Percentage of Population Employed in Agriculture, Fishing & Hunting in Newark, DE with 1.2%.
What is the Percentage of Population Employed in Agriculture, Fishing & Hunting in Newark, DE?
Percentage of Population Employed in Agriculture, Fishing & Hunting in Newark is 0.30%.
What is the Percentage of Population Employed in Agriculture, Fishing & Hunting in Delaware?
Percentage of Population Employed in Agriculture, Fishing & Hunting in Delaware is 1.0%.
What is the Percentage of Population Employed in Agriculture, Fishing & Hunting in the United States?
Percentage of Population Employed in Agriculture, Fishing & Hunting in the United States is 1.2%.