Zip Codes with the Highest Percentage of Population with a Degree in Physical and Health Sciences in Pueblo, CO

RELATED REPORTS & OPTIONS

Physical and Health Sciences
Population
Families and Households
Female Fertility
Female Fertility (Unmarried)
Race (Community Size)
Race (Percentage)
Ancestry (Community Size)
AfricanAmericanApacheArabArgentineanArmenianAustrianBasqueBelgianBhutaneseBlackfeetBolivianBrazilianBritishBurmeseCajunCanadianCelticCentral AmericanCherokeeCheyenneChickasawChileanChippewaChoctawColombianComancheCreekCroatianCrowCubanCzechCzechoslovakianDanishDominicanDutchEastern EuropeanEnglishEuropeanFinnishFrenchFrench CanadianGermanGreekGuamanian / ChamorroGuatemalanHonduranHungarianIcelanderIndian (Asian)IrishIroquoisItalianJamaicanKoreanLebaneseLithuanianLuxembourgerMexicanMexican American IndianNative HawaiianNavajoNigerianNorthern EuropeanNorwegianOkinawanPaiutePakistaniPanamanianPennsylvania GermanPeruvianPolishPortuguesePotawatomiPuebloPuerto RicanRomanianRussianSalvadoranSamoanScandinavianScotch-IrishScottishSeminoleSerbianSiouxSlavicSlovakSloveneSouth AmericanSpaniardSpanishSpanish AmericanSpanish American IndianSri LankanSubsaharan AfricanSwedishSwissThaiUkrainianUteWelshYugoslavian
Ancestry (Percentage)
AfricanAmericanApacheArabArgentineanArmenianAustrianBasqueBelgianBhutaneseBlackfeetBolivianBrazilianBritishBurmeseCajunCanadianCelticCentral AmericanCherokeeCheyenneChickasawChileanChippewaChoctawColombianComancheCreekCroatianCrowCubanCzechCzechoslovakianDanishDominicanDutchEastern EuropeanEnglishEuropeanFinnishFrenchFrench CanadianGermanGreekGuamanian / ChamorroGuatemalanHonduranHungarianIcelanderIndian (Asian)IrishIroquoisItalianJamaicanKoreanLebaneseLithuanianLuxembourgerMexicanMexican American IndianNative HawaiianNavajoNigerianNorthern EuropeanNorwegianOkinawanPaiutePakistaniPanamanianPennsylvania GermanPeruvianPolishPortuguesePotawatomiPuebloPuerto RicanRomanianRussianSalvadoranSamoanScandinavianScotch-IrishScottishSeminoleSerbianSiouxSlavicSlovakSloveneSouth AmericanSpaniardSpanishSpanish AmericanSpanish American IndianSri LankanSubsaharan AfricanSwedishSwissThaiUkrainianUteWelshYugoslavian
Immigrant Origin (Total)
Immigrant Origin (Percentage)
Income
Income (Families)
Income (Households)
Poverty
Poverty (Families)
Unemployment
Employment Occupations
Employment Industries
Employer Class
Commute Time
Commute Means
School Enrollment
Education by Degree Field
Occupancy
Finances
Physical Characteristics
Pueblo
Compare Zip Codes
Comparison Subject

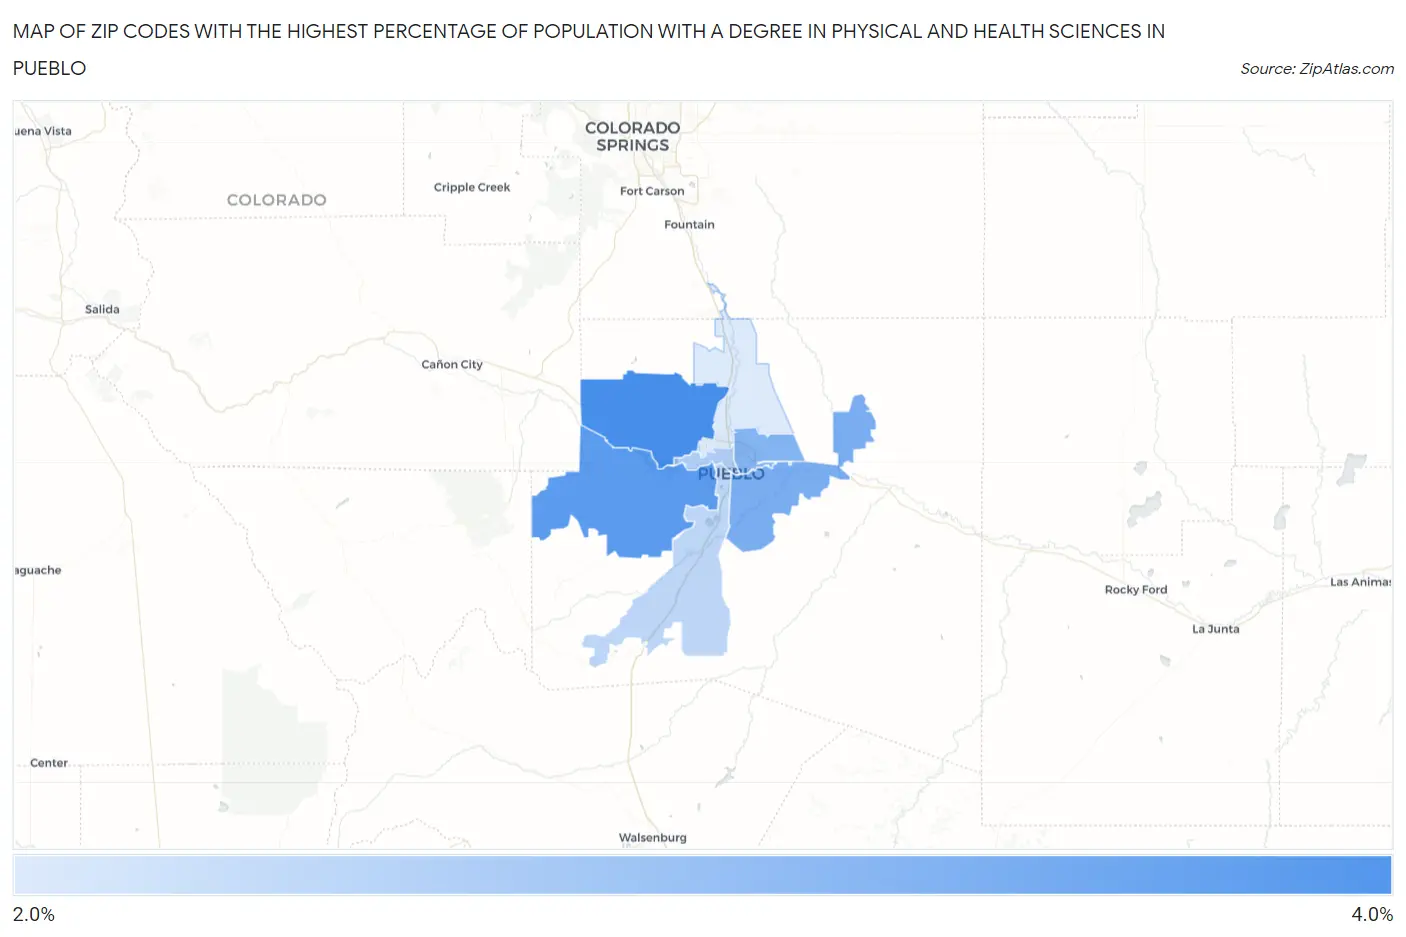
Map of Zip Codes with the Highest Percentage of Population with a Degree in Physical and Health Sciences in Pueblo

0.0%
4.0%
Zip Codes with the Highest Percentage of Population with a Degree in Physical and Health Sciences in Pueblo Map

Zip Codes with the Highest Percentage of Population with a Degree in Physical and Health Sciences in Pueblo, CO

Zip Code % Graduates vs State vs National
1.810073.7%3.6%(+0.110)#1803.1%(+0.649)#7,543
2.810053.6%3.6%(-0.085)#1943.1%(+0.455)#8,227
3.810063.3%3.6%(-0.358)#2153.1%(+0.181)#9,257
4.810013.2%3.6%(-0.449)#2223.1%(+0.091)#9,619
5.810032.8%3.6%(-0.836)#2533.1%(-0.296)#11,309
6.810042.7%3.6%(-0.965)#2643.1%(-0.426)#11,906
7.810082.4%3.6%(-1.26)#2883.1%(-0.715)#13,267

Common Questions

What are the Top 5 Zip Codes with the Highest Percentage of Population with a Degree in Physical and Health Sciences in Pueblo, CO?
Top 5 Zip Codes with the Highest Percentage of Population with a Degree in Physical and Health Sciences in Pueblo, CO are:
#1
3.7%
#2
3.6%
#3
3.3%
#4
3.2%
#5
2.8%
What zip code has the Highest Percentage of Population with a Degree in Physical and Health Sciences in Pueblo, CO?
81007 has the Highest Percentage of Population with a Degree in Physical and Health Sciences in Pueblo, CO with 3.7%.
What is the Percentage of Population with a Degree in Physical and Health Sciences in Pueblo, CO?
Percentage of Population with a Degree in Physical and Health Sciences in Pueblo is 3.1%.
What is the Percentage of Population with a Degree in Physical and Health Sciences in Colorado?
Percentage of Population with a Degree in Physical and Health Sciences in Colorado is 3.6%.
What is the Percentage of Population with a Degree in Physical and Health Sciences in the United States?
Percentage of Population with a Degree in Physical and Health Sciences in the United States is 3.1%.