Zip Codes with the Highest Percentage of Population Employed in Administrative & Support Services in Pueblo, CO
RELATED REPORTS & OPTIONS
Administrative & Support Services
Pueblo
Compare Zip Codes
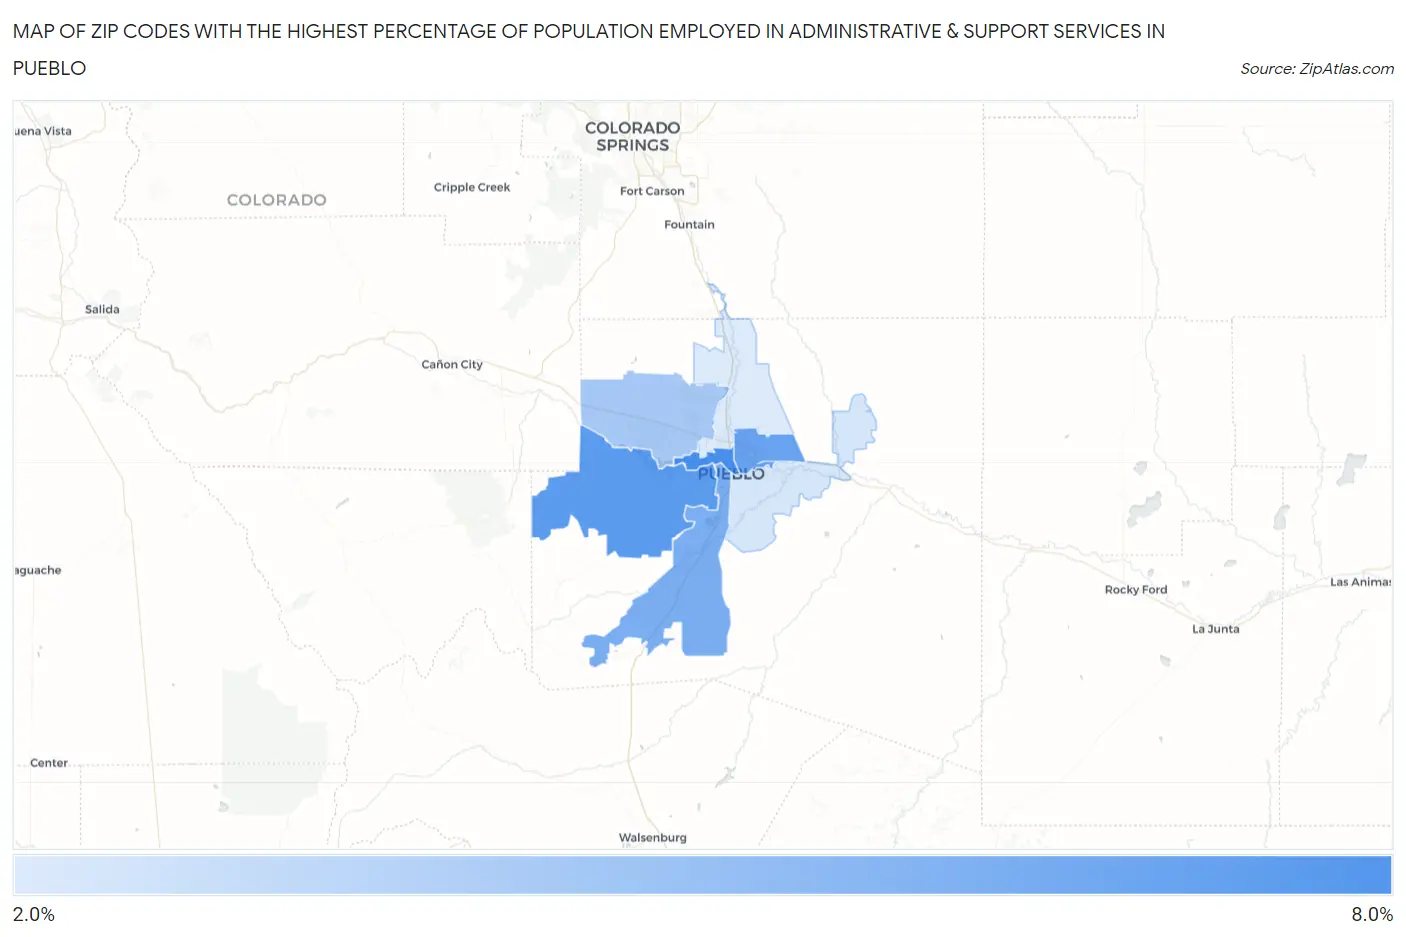
Map of Zip Codes with the Highest Percentage of Population Employed in Administrative & Support Services in Pueblo
2.2%
7.1%
Zip Codes with the Highest Percentage of Population Employed in Administrative & Support Services in Pueblo, CO
| Zip Code | % Employed | vs State | vs National | |
| 1. | 81003 | 7.1% | 4.1%(+2.98)#43 | 4.1%(+2.92)#3,135 |
| 2. | 81005 | 6.4% | 4.1%(+2.28)#61 | 4.1%(+2.22)#4,127 |
| 3. | 81001 | 6.0% | 4.1%(+1.96)#71 | 4.1%(+1.90)#4,691 |
| 4. | 81004 | 5.4% | 4.1%(+1.30)#91 | 4.1%(+1.24)#6,106 |
| 5. | 81007 | 4.0% | 4.1%(-0.115)#172 | 4.1%(-0.174)#10,799 |
| 6. | 81006 | 2.4% | 4.1%(-1.67)#292 | 4.1%(-1.73)#18,541 |
| 7. | 81008 | 2.2% | 4.1%(-1.85)#306 | 4.1%(-1.91)#19,464 |
1
Common Questions
What are the Top 5 Zip Codes with the Highest Percentage of Population Employed in Administrative & Support Services in Pueblo, CO?
Top 5 Zip Codes with the Highest Percentage of Population Employed in Administrative & Support Services in Pueblo, CO are:
What zip code has the Highest Percentage of Population Employed in Administrative & Support Services in Pueblo, CO?
81003 has the Highest Percentage of Population Employed in Administrative & Support Services in Pueblo, CO with 7.1%.
What is the Percentage of Population Employed in Administrative & Support Services in Pueblo, CO?
Percentage of Population Employed in Administrative & Support Services in Pueblo is 5.3%.
What is the Percentage of Population Employed in Administrative & Support Services in Colorado?
Percentage of Population Employed in Administrative & Support Services in Colorado is 4.1%.
What is the Percentage of Population Employed in Administrative & Support Services in the United States?
Percentage of Population Employed in Administrative & Support Services in the United States is 4.1%.