Zip Codes with the Highest Percentage of Households Without a Vehicle in Pueblo, CO
RELATED REPORTS & OPTIONS
Households without a Cars
Pueblo
Compare Zip Codes
Map of Zip Codes with the Highest Percentage of Households Without a Vehicle in Pueblo
2.3%
14.1%
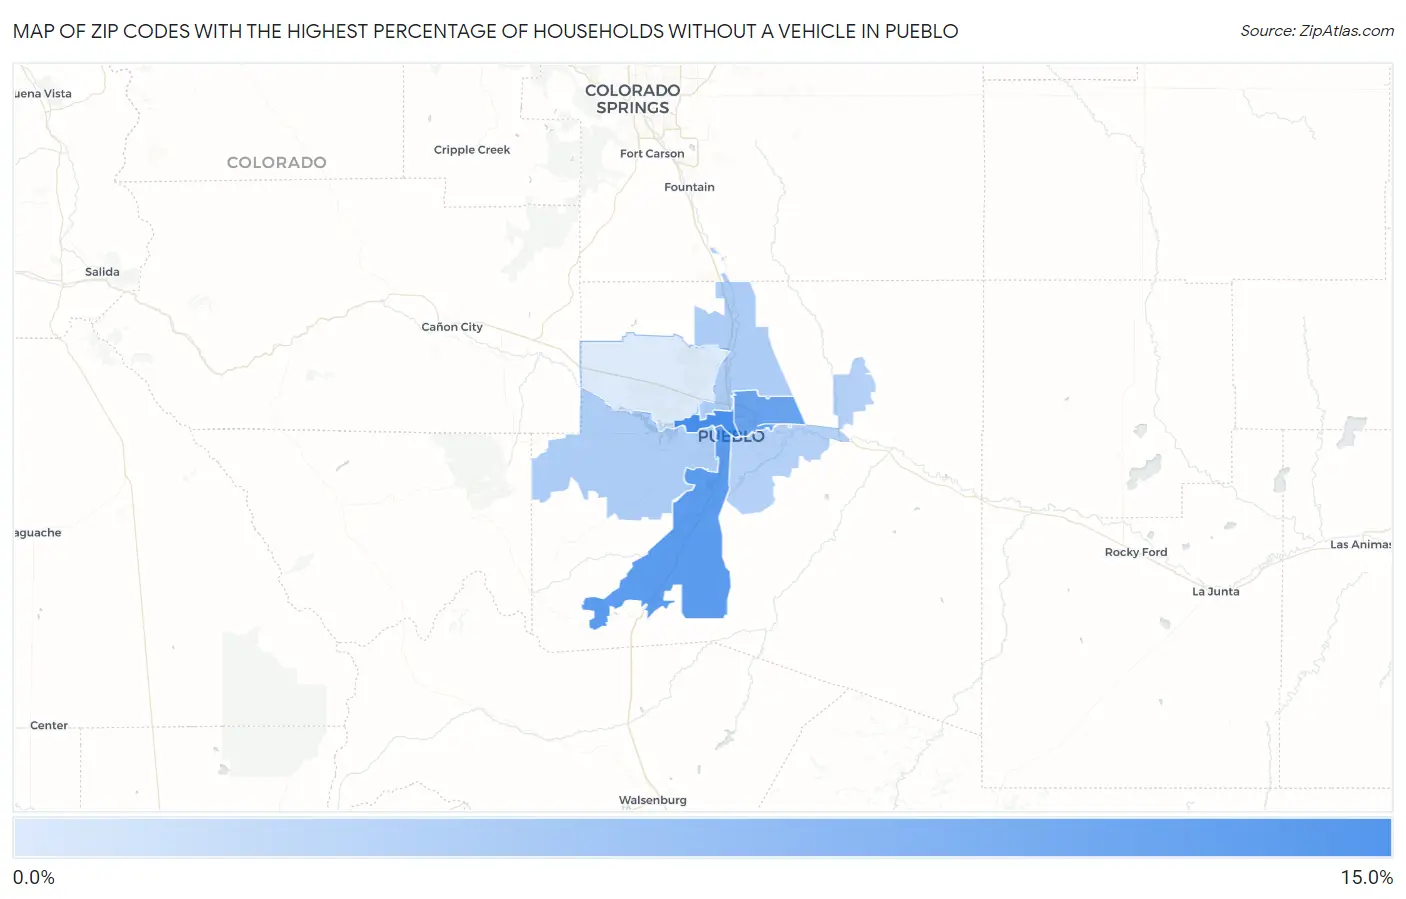
Zip Codes with the Highest Percentage of Households Without a Vehicle in Pueblo, CO
| Zip Code | Housholds Without a Car | vs State | vs National | |
| 1. | 81003 | 14.1% | 5.0%(+9.10)#13 | 8.3%(+5.80)#2,670 |
| 2. | 81004 | 12.6% | 5.0%(+7.60)#18 | 8.3%(+4.30)#3,274 |
| 3. | 81001 | 11.5% | 5.0%(+6.50)#22 | 8.3%(+3.20)#3,820 |
| 4. | 81005 | 6.0% | 5.0%(+1.000)#99 | 8.3%(-2.30)#10,443 |
| 5. | 81008 | 5.9% | 5.0%(+0.900)#106 | 8.3%(-2.40)#10,740 |
| 6. | 81006 | 5.5% | 5.0%(+0.500)#125 | 8.3%(-2.80)#11,672 |
| 7. | 81007 | 2.3% | 5.0%(-2.70)#260 | 8.3%(-6.00)#21,373 |
1
Common Questions
What are the Top 5 Zip Codes with the Highest Percentage of Households Without a Vehicle in Pueblo, CO?
Top 5 Zip Codes with the Highest Percentage of Households Without a Vehicle in Pueblo, CO are:
What zip code has the Highest Percentage of Households Without a Vehicle in Pueblo, CO?
81003 has the Highest Percentage of Households Without a Vehicle in Pueblo, CO with 14.1%.
What is the Percentage of Households Without a Vehicle in Pueblo, CO?
Percentage of Households Without a Vehicle in Pueblo is 10.4%.
What is the Percentage of Households Without a Vehicle in Colorado?
Percentage of Households Without a Vehicle in Colorado is 5.0%.
What is the Percentage of Households Without a Vehicle in the United States?
Percentage of Households Without a Vehicle in the United States is 8.3%.