Zip Codes with the Highest Percentage of Population Employed in Accommodation & Food Services in Pueblo, CO
RELATED REPORTS & OPTIONS
Accommodation & Food Services
Pueblo
Compare Zip Codes
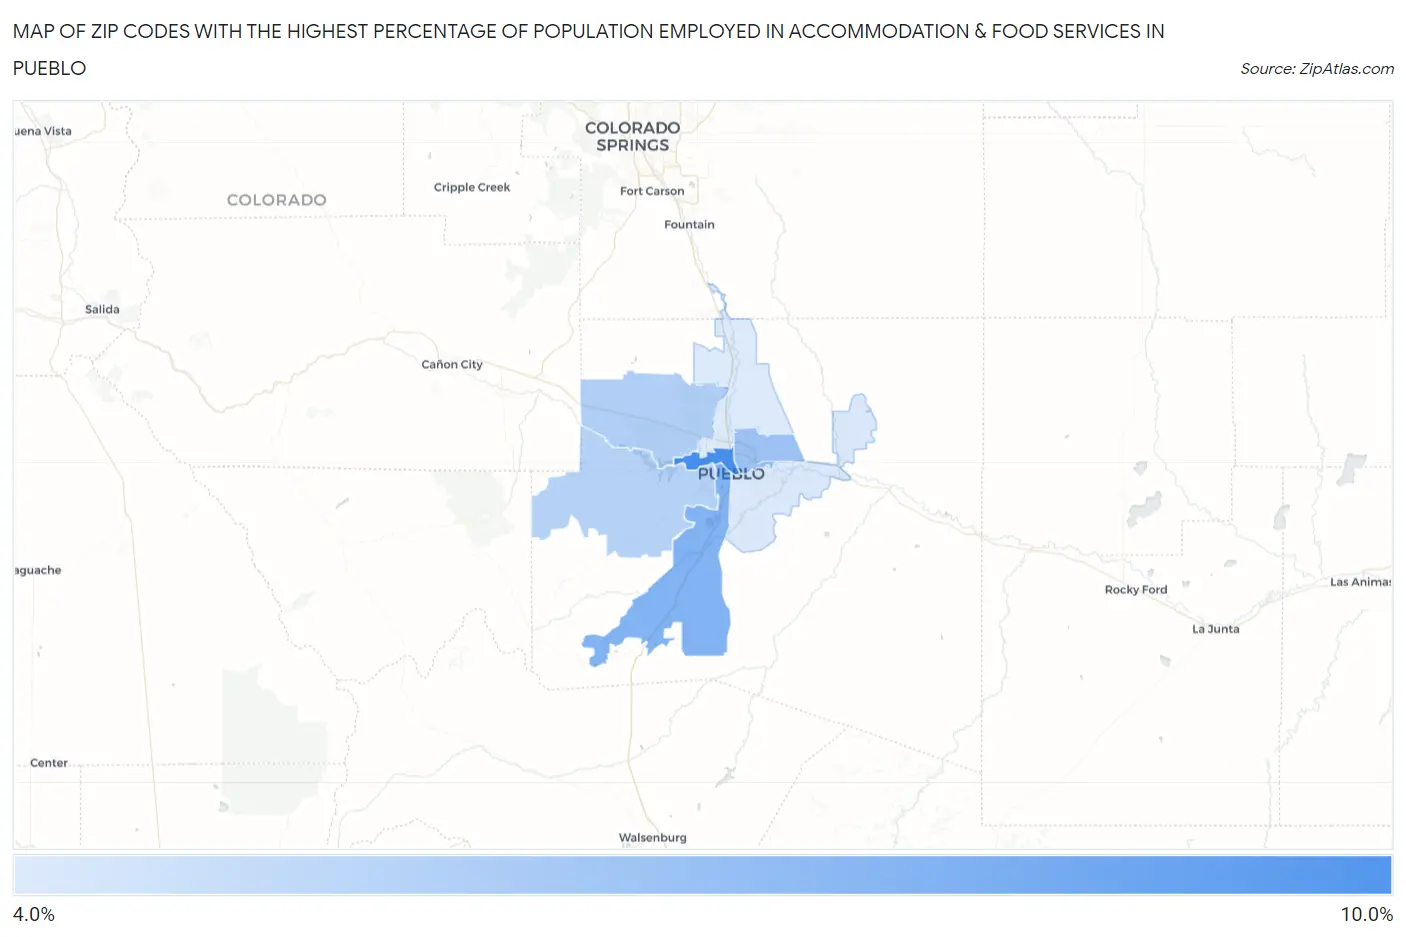
Map of Zip Codes with the Highest Percentage of Population Employed in Accommodation & Food Services in Pueblo
4.8%
10.0%
Zip Codes with the Highest Percentage of Population Employed in Accommodation & Food Services in Pueblo, CO
| Zip Code | % Employed | vs State | vs National | |
| 1. | 81003 | 10.0% | 6.9%(+3.08)#91 | 6.9%(+3.10)#4,576 |
| 2. | 81004 | 8.0% | 6.9%(+1.07)#140 | 6.9%(+1.09)#7,872 |
| 3. | 81001 | 7.1% | 6.9%(+0.222)#172 | 6.9%(+0.242)#9,999 |
| 4. | 81007 | 6.3% | 6.9%(-0.594)#206 | 6.9%(-0.573)#12,459 |
| 5. | 81005 | 6.1% | 6.9%(-0.789)#216 | 6.9%(-0.769)#13,091 |
| 6. | 81006 | 4.9% | 6.9%(-1.98)#285 | 6.9%(-1.96)#17,098 |
| 7. | 81008 | 4.8% | 6.9%(-2.09)#292 | 6.9%(-2.07)#17,444 |
1
Common Questions
What are the Top 5 Zip Codes with the Highest Percentage of Population Employed in Accommodation & Food Services in Pueblo, CO?
Top 5 Zip Codes with the Highest Percentage of Population Employed in Accommodation & Food Services in Pueblo, CO are:
What zip code has the Highest Percentage of Population Employed in Accommodation & Food Services in Pueblo, CO?
81003 has the Highest Percentage of Population Employed in Accommodation & Food Services in Pueblo, CO with 10.0%.
What is the Percentage of Population Employed in Accommodation & Food Services in Pueblo, CO?
Percentage of Population Employed in Accommodation & Food Services in Pueblo is 7.0%.
What is the Percentage of Population Employed in Accommodation & Food Services in Colorado?
Percentage of Population Employed in Accommodation & Food Services in Colorado is 6.9%.
What is the Percentage of Population Employed in Accommodation & Food Services in the United States?
Percentage of Population Employed in Accommodation & Food Services in the United States is 6.9%.