Zip Codes with the Highest Percentage of Population Employed in Architecture & Engineering in Anniston, AL
RELATED REPORTS & OPTIONS
Architecture & Engineering
Anniston
Compare Zip Codes
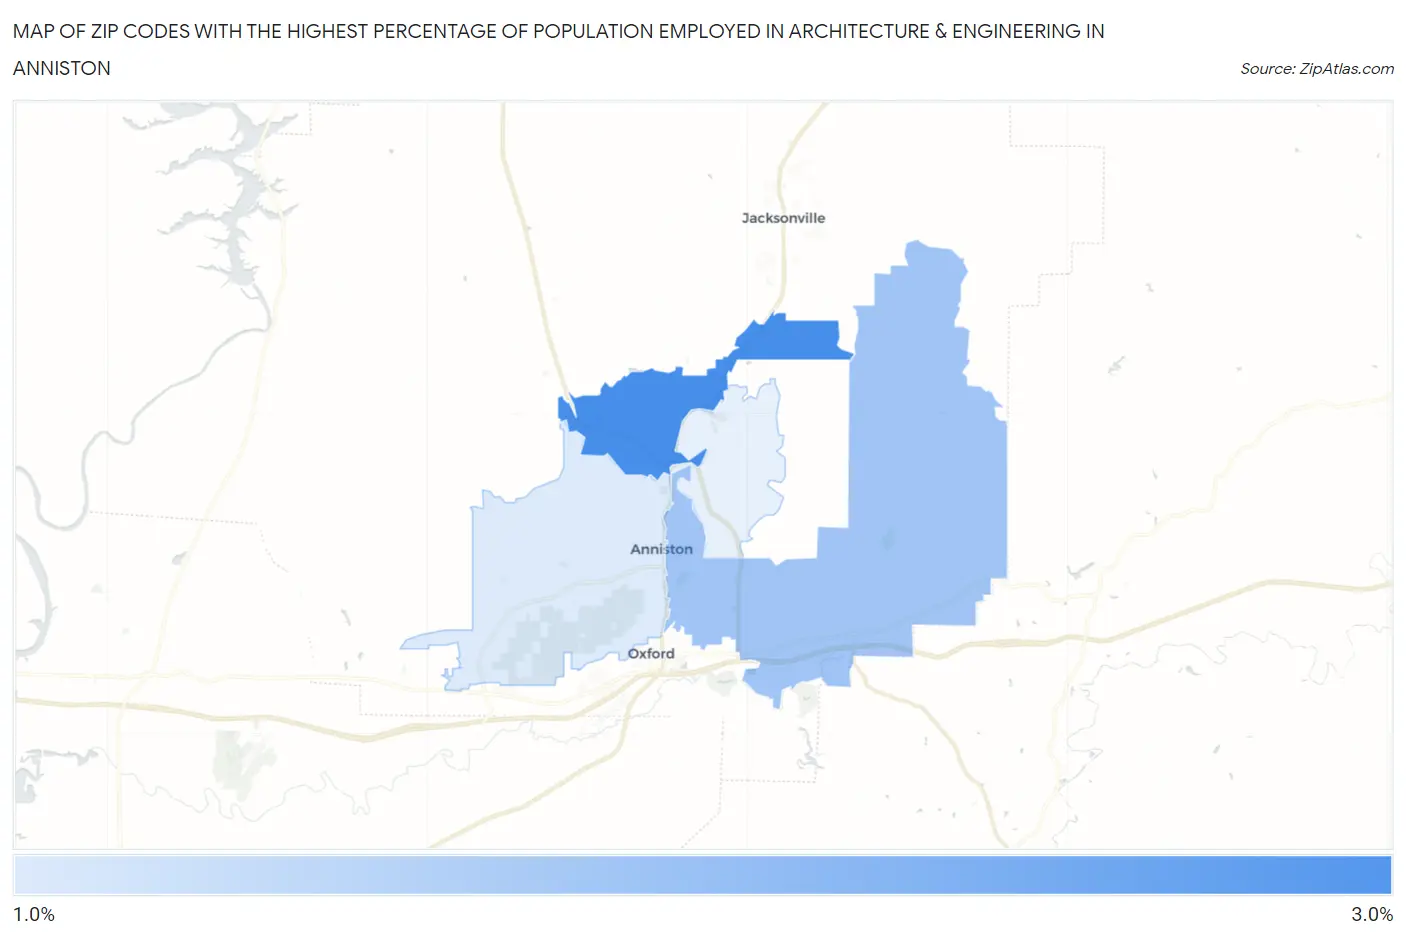
Map of Zip Codes with the Highest Percentage of Population Employed in Architecture & Engineering in Anniston
1.5%
2.9%
Zip Codes with the Highest Percentage of Population Employed in Architecture & Engineering in Anniston, AL
| Zip Code | % Employed | vs State | vs National | |
| 1. | 36206 | 2.9% | 2.4%(+0.535)#115 | 2.1%(+0.793)#5,269 |
| 2. | 36207 | 2.1% | 2.4%(-0.315)#182 | 2.1%(-0.057)#9,099 |
| 3. | 36201 | 1.5% | 2.4%(-0.886)#243 | 2.1%(-0.628)#12,723 |
1
Common Questions
What are the Top 3 Zip Codes with the Highest Percentage of Population Employed in Architecture & Engineering in Anniston, AL?
Top 3 Zip Codes with the Highest Percentage of Population Employed in Architecture & Engineering in Anniston, AL are:
What zip code has the Highest Percentage of Population Employed in Architecture & Engineering in Anniston, AL?
36206 has the Highest Percentage of Population Employed in Architecture & Engineering in Anniston, AL with 2.9%.
What is the Percentage of Population Employed in Architecture & Engineering in Anniston, AL?
Percentage of Population Employed in Architecture & Engineering in Anniston is 2.7%.
What is the Percentage of Population Employed in Architecture & Engineering in Alabama?
Percentage of Population Employed in Architecture & Engineering in Alabama is 2.4%.
What is the Percentage of Population Employed in Architecture & Engineering in the United States?
Percentage of Population Employed in Architecture & Engineering in the United States is 2.1%.