Zip Codes with the Highest Percentage of Households with Income Below $10,000 in Pittsburgh, PA
RELATED REPORTS & OPTIONS
Household Income | $0-10k
Pittsburgh
Compare Zip Codes
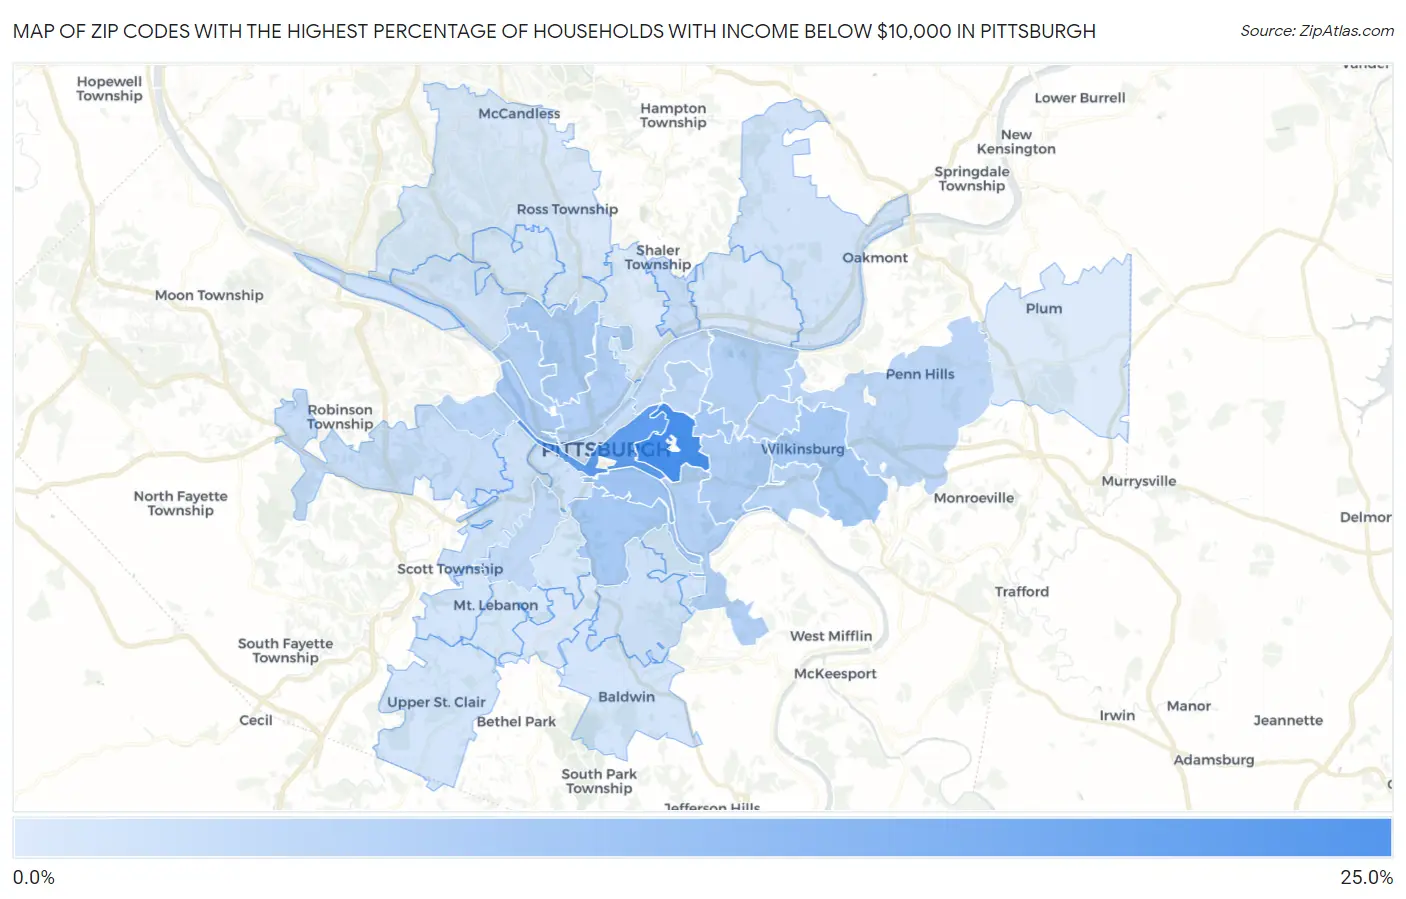
Map of Zip Codes with the Highest Percentage of Households with Income Below $10,000 in Pittsburgh
2.0%
23.7%
Zip Codes with the Highest Percentage of Households with Income Below $10,000 in Pittsburgh, PA
| Zip Code | Households with Income < $10k | vs State | vs National | |
| 1. | 15213 | 23.7% | 4.8%(+18.9)#18 | 4.9%(+18.8)#547 |
| 2. | 15219 | 19.6% | 4.8%(+14.8)#26 | 4.9%(+14.7)#830 |
| 3. | 15203 | 10.2% | 4.8%(+5.40)#129 | 4.9%(+5.30)#3,438 |
| 4. | 15221 | 9.3% | 4.8%(+4.50)#155 | 4.9%(+4.40)#4,100 |
| 5. | 15210 | 9.3% | 4.8%(+4.50)#156 | 4.9%(+4.40)#4,102 |
| 6. | 15232 | 9.3% | 4.8%(+4.50)#157 | 4.9%(+4.40)#4,115 |
| 7. | 15214 | 8.6% | 4.8%(+3.80)#180 | 4.9%(+3.70)#4,839 |
| 8. | 15233 | 8.4% | 4.8%(+3.60)#190 | 4.9%(+3.50)#5,081 |
| 9. | 15217 | 8.3% | 4.8%(+3.50)#196 | 4.9%(+3.40)#5,167 |
| 10. | 15207 | 7.7% | 4.8%(+2.90)#217 | 4.9%(+2.80)#5,956 |
| 11. | 15212 | 7.5% | 4.8%(+2.70)#232 | 4.9%(+2.60)#6,209 |
| 12. | 15206 | 7.4% | 4.8%(+2.60)#234 | 4.9%(+2.50)#6,349 |
| 13. | 15208 | 6.9% | 4.8%(+2.10)#267 | 4.9%(+2.00)#7,162 |
| 14. | 15218 | 6.8% | 4.8%(+2.00)#277 | 4.9%(+1.90)#7,362 |
| 15. | 15204 | 6.7% | 4.8%(+1.90)#290 | 4.9%(+1.80)#7,587 |
| 16. | 15235 | 6.2% | 4.8%(+1.40)#336 | 4.9%(+1.30)#8,530 |
| 17. | 15224 | 6.0% | 4.8%(+1.20)#357 | 4.9%(+1.10)#9,040 |
| 18. | 15201 | 5.7% | 4.8%(+0.900)#394 | 4.9%(+0.800)#9,765 |
| 19. | 15216 | 5.6% | 4.8%(+0.800)#407 | 4.9%(+0.700)#9,996 |
| 20. | 15223 | 4.9% | 4.8%(+0.100)#509 | 4.9%(=0.000)#12,118 |
| 21. | 15205 | 4.8% | 4.8%(=0.000)#515 | 4.9%(-0.100)#12,342 |
| 22. | 15222 | 4.7% | 4.8%(-0.100)#540 | 4.9%(-0.200)#12,788 |
| 23. | 15227 | 3.9% | 4.8%(-0.900)#683 | 4.9%(-1.00)#15,636 |
| 24. | 15220 | 3.9% | 4.8%(-0.900)#686 | 4.9%(-1.00)#15,685 |
| 25. | 15211 | 3.8% | 4.8%(-1.00)#703 | 4.9%(-1.10)#16,124 |
| 26. | 15202 | 3.6% | 4.8%(-1.20)#749 | 4.9%(-1.30)#16,887 |
| 27. | 15238 | 3.6% | 4.8%(-1.20)#753 | 4.9%(-1.30)#16,927 |
| 28. | 15225 | 3.6% | 4.8%(-1.20)#767 | 4.9%(-1.30)#17,106 |
| 29. | 15236 | 3.3% | 4.8%(-1.50)#838 | 4.9%(-1.60)#18,092 |
| 30. | 15241 | 3.3% | 4.8%(-1.50)#842 | 4.9%(-1.60)#18,135 |
| 31. | 15243 | 3.3% | 4.8%(-1.50)#845 | 4.9%(-1.60)#18,184 |
| 32. | 15229 | 3.0% | 4.8%(-1.80)#913 | 4.9%(-1.90)#19,436 |
| 33. | 15226 | 2.9% | 4.8%(-1.90)#946 | 4.9%(-2.00)#19,928 |
| 34. | 15228 | 2.8% | 4.8%(-2.00)#971 | 4.9%(-2.10)#20,335 |
| 35. | 15237 | 2.6% | 4.8%(-2.20)#1,019 | 4.9%(-2.30)#21,067 |
| 36. | 15215 | 2.6% | 4.8%(-2.20)#1,023 | 4.9%(-2.30)#21,209 |
| 37. | 15234 | 2.4% | 4.8%(-2.40)#1,074 | 4.9%(-2.50)#22,102 |
| 38. | 15239 | 2.0% | 4.8%(-2.80)#1,173 | 4.9%(-2.90)#23,646 |
| 39. | 15209 | 2.0% | 4.8%(-2.80)#1,174 | 4.9%(-2.90)#23,690 |
1
Common Questions
What are the Top 10 Zip Codes with the Highest Percentage of Households with Income Below $10,000 in Pittsburgh, PA?
Top 10 Zip Codes with the Highest Percentage of Households with Income Below $10,000 in Pittsburgh, PA are:
What zip code has the Highest Percentage of Households with Income Below $10,000 in Pittsburgh, PA?
15213 has the Highest Percentage of Households with Income Below $10,000 in Pittsburgh, PA with 23.7%.
What is the Percentage of Households with Income Below $10,000 in Pittsburgh, PA?
Percentage of Households with Income Below $10,000 in Pittsburgh is 8.9%.
What is the Percentage of Households with Income Below $10,000 in Pennsylvania?
Percentage of Households with Income Below $10,000 in Pennsylvania is 4.8%.
What is the Percentage of Households with Income Below $10,000 in the United States?
Percentage of Households with Income Below $10,000 in the United States is 4.9%.