Zip Codes with the Highest Percentage of Households with Income Above $100,000 in Pittsburgh, PA

RELATED REPORTS & OPTIONS

Household Income | $100k+
Population
Families and Households
Female Fertility
Female Fertility (Unmarried)
Race (Community Size)
Race (Percentage)
Ancestry (Community Size)
AfghanAfricanAlbanianAlsatianAmericanApacheArabArgentineanArmenianAustralianAustrianBahamianBarbadianBasqueBelgianBhutaneseBlackfeetBolivianBrazilianBritishBritish West IndianBulgarianBurmeseCajunCambodianCanadianCape VerdeanCarpatho RusynCelticCentral AmericanCentral American IndianCherokeeChickasawChileanChippewaChoctawColombianComancheCosta RicanCreekCroatianCubanCypriotCzechCzechoslovakianDanishDelawareDominicanDutchEastern EuropeanEcuadorianEgyptianEnglishEthiopianEuropeanFilipinoFinnishFrenchFrench American IndianFrench CanadianGermanGhanaianGreekGuamanian / ChamorroGuatemalanGuyaneseHaitianHonduranHungarianIndian (Asian)IndonesianIranianIraqiIrishIroquoisIsraeliItalianJamaicanJapaneseJordanianKenyanKoreanLaotianLatvianLebaneseLiberianLithuanianLumbeeLuxembourgerMacedonianMalaysianMalteseMexicanMexican American IndianMongolianMoroccanNative HawaiianNavajoNew ZealanderNicaraguanNigerianNorthern EuropeanNorwegianPakistaniPalestinianPanamanianParaguayanPennsylvania GermanPeruvianPolishPortuguesePuerto RicanRomanianRussianSalvadoranSamoanScandinavianScotch-IrishScottishSeminoleSerbianSiouxSlavicSlovakSloveneSouth AfricanSouth AmericanSouth American IndianSoviet UnionSpaniardSpanishSri LankanSubsaharan AfricanSudaneseSwedishSwissSyrianThaiTrinidadian and TobagonianTurkishU.S. Virgin IslanderUgandanUkrainianUruguayanVenezuelanVietnameseWelshWest IndianYugoslavian
Ancestry (Percentage)
AfghanAfricanAlbanianAlsatianAmericanApacheArabArgentineanArmenianAustralianAustrianBahamianBarbadianBasqueBelgianBhutaneseBlackfeetBolivianBrazilianBritishBritish West IndianBulgarianBurmeseCajunCambodianCanadianCape VerdeanCarpatho RusynCelticCentral AmericanCentral American IndianCherokeeChickasawChileanChippewaChoctawColombianComancheCosta RicanCreekCroatianCubanCypriotCzechCzechoslovakianDanishDelawareDominicanDutchEastern EuropeanEcuadorianEgyptianEnglishEthiopianEuropeanFilipinoFinnishFrenchFrench American IndianFrench CanadianGermanGhanaianGreekGuamanian / ChamorroGuatemalanGuyaneseHaitianHonduranHungarianIndian (Asian)IndonesianIranianIraqiIrishIroquoisIsraeliItalianJamaicanJapaneseJordanianKenyanKoreanLaotianLatvianLebaneseLiberianLithuanianLumbeeLuxembourgerMacedonianMalaysianMalteseMexicanMexican American IndianMongolianMoroccanNative HawaiianNavajoNew ZealanderNicaraguanNigerianNorthern EuropeanNorwegianPakistaniPalestinianPanamanianParaguayanPennsylvania GermanPeruvianPolishPortuguesePuerto RicanRomanianRussianSalvadoranSamoanScandinavianScotch-IrishScottishSeminoleSerbianSiouxSlavicSlovakSloveneSouth AfricanSouth AmericanSouth American IndianSoviet UnionSpaniardSpanishSri LankanSubsaharan AfricanSudaneseSwedishSwissSyrianThaiTrinidadian and TobagonianTurkishU.S. Virgin IslanderUgandanUkrainianUruguayanVenezuelanVietnameseWelshWest IndianYugoslavian
Immigrant Origin (Total)
AfghanistanAfricaAlbaniaArgentinaAsiaAustraliaAustriaBahamasBangladeshBelarusBelgiumBoliviaBosnia and HerzegovinaBrazilBulgariaBurma / MyanmarCambodiaCameroonCanadaCaribbeanCentral AmericaChileChinaColombiaCongoCosta RicaCroatiaCubaCzechoslovakiaDenmarkDominican RepublicEastern AfricaEastern AsiaEastern EuropeEcuadorEgyptEl SalvadorEnglandEritreaEthiopiaEuropeFranceGermanyGhanaGreeceGuatemalaGuyanaHaitiHondurasHong KongHungaryIndiaIndonesiaIranIraqIrelandIsraelItalyJamaicaJapanJordanKazakhstanKenyaKoreaKuwaitLatin AmericaLatviaLebanonLiberiaLithuaniaMalaysiaMexicoMiddle AfricaMoldovaMoroccoNepalNetherlandsNigeriaNorthern AfricaNorthern EuropeNorwayOceaniaPakistanPanamaPeruPhilippinesPolandPortugalRomaniaRussiaSaudi ArabiaScotlandSerbiaSingaporeSouth AfricaSouth AmericaSouth Central AsiaSouth Eastern AsiaSouthern EuropeSpainSri LankaSudanSwedenSwitzerlandSyriaTaiwanThailandTrinidad and TobagoTurkeyUgandaUkraineUzbekistanVenezuelaVietnamWestern AfricaWestern AsiaWestern EuropeZaire
Immigrant Origin (Percentage)
AfghanistanAfricaAlbaniaArgentinaAsiaAustraliaAustriaBahamasBangladeshBelarusBelgiumBoliviaBosnia and HerzegovinaBrazilBulgariaBurma / MyanmarCambodiaCameroonCanadaCaribbeanCentral AmericaChileChinaColombiaCongoCosta RicaCroatiaCubaCzechoslovakiaDenmarkDominican RepublicEastern AfricaEastern AsiaEastern EuropeEcuadorEgyptEl SalvadorEnglandEritreaEthiopiaEuropeFranceGermanyGhanaGreeceGuatemalaGuyanaHaitiHondurasHong KongHungaryIndiaIndonesiaIranIraqIrelandIsraelItalyJamaicaJapanJordanKazakhstanKenyaKoreaKuwaitLatin AmericaLatviaLebanonLiberiaLithuaniaMalaysiaMexicoMiddle AfricaMoldovaMoroccoNepalNetherlandsNigeriaNorthern AfricaNorthern EuropeNorwayOceaniaPakistanPanamaPeruPhilippinesPolandPortugalRomaniaRussiaSaudi ArabiaScotlandSerbiaSingaporeSouth AfricaSouth AmericaSouth Central AsiaSouth Eastern AsiaSouthern EuropeSpainSri LankaSudanSwedenSwitzerlandSyriaTaiwanThailandTrinidad and TobagoTurkeyUgandaUkraineUzbekistanVenezuelaVietnamWestern AfricaWestern AsiaWestern EuropeZaire
Income
Income (Families)
Income (Households)
Poverty
Poverty (Families)
Unemployment
Employment Occupations
Employment Industries
Employer Class
Commute Time
Commute Means
School Enrollment
Education by Degree Field
Occupancy
Finances
Physical Characteristics
Pittsburgh
Compare Zip Codes
Comparison Subject

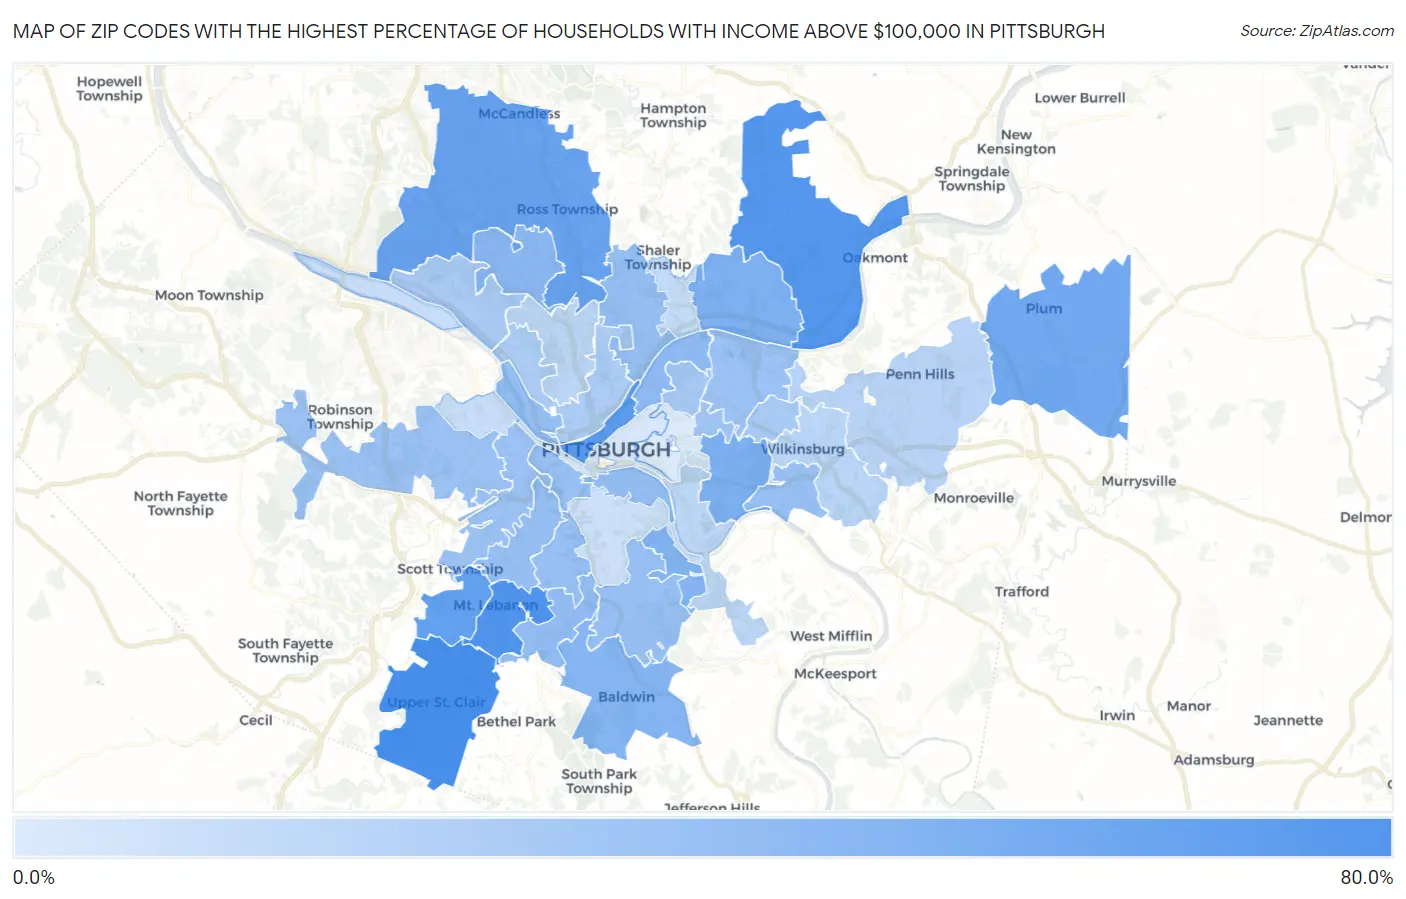
Map of Zip Codes with the Highest Percentage of Households with Income Above $100,000 in Pittsburgh

0.0%
80.0%
Zip Codes with the Highest Percentage of Households with Income Above $100,000 in Pittsburgh Map

Zip Codes with the Highest Percentage of Households with Income Above $100,000 in Pittsburgh, PA

Zip Code Households with Income > $100k vs State vs National
1.1524164.4%35.9%(+28.5)#8137.3%(+27.1)#1,628
2.1522861.2%35.9%(+25.3)#11337.3%(+23.9)#2,140
3.1523858.7%35.9%(+22.8)#13137.3%(+21.4)#2,626
4.1522256.1%35.9%(+20.2)#15937.3%(+18.8)#3,178
5.1524353.6%35.9%(+17.7)#18937.3%(+16.3)#3,810
6.1523751.7%35.9%(+15.8)#21237.3%(+14.4)#4,328
7.1523948.0%35.9%(+12.1)#26637.3%(+10.7)#5,496
8.1521744.4%35.9%(+8.50)#33437.3%(+7.10)#6,849
9.1521543.3%35.9%(+7.40)#36337.3%(+6.00)#7,296
10.1523640.9%35.9%(+5.00)#41437.3%(+3.60)#8,444
11.1522939.6%35.9%(+3.70)#45937.3%(+2.30)#9,129
12.1520137.9%35.9%(+2.00)#50437.3%(+0.600)#10,048
13.1523436.9%35.9%(+1.00)#53437.3%(-0.400)#10,629
14.1520336.4%35.9%(+0.500)#55537.3%(-0.900)#10,923
15.1523335.6%35.9%(-0.300)#58837.3%(-1.70)#11,392
16.1521635.5%35.9%(-0.400)#58937.3%(-1.80)#11,445
17.1520935.3%35.9%(-0.600)#60337.3%(-2.00)#11,598
18.1521134.9%35.9%(-1.00)#61937.3%(-2.40)#11,829
19.1521834.8%35.9%(-1.10)#62137.3%(-2.50)#11,894
20.1522734.6%35.9%(-1.30)#63137.3%(-2.70)#12,014
21.1522634.4%35.9%(-1.50)#63637.3%(-2.90)#12,145
22.1522033.9%35.9%(-2.00)#66137.3%(-3.40)#12,497
23.1520533.2%35.9%(-2.70)#69037.3%(-4.10)#12,961
24.1520632.9%35.9%(-3.00)#71137.3%(-4.40)#13,184
25.1523231.4%35.9%(-4.50)#79037.3%(-5.90)#14,316
26.1522429.8%35.9%(-6.10)#87837.3%(-7.50)#15,594
27.1520828.9%35.9%(-7.00)#92337.3%(-8.40)#16,336
28.1520228.8%35.9%(-7.10)#92837.3%(-8.50)#16,414
29.1521227.5%35.9%(-8.40)#99737.3%(-9.80)#17,546
30.1523524.1%35.9%(-11.8)#1,18137.3%(-13.2)#20,573
31.1522123.7%35.9%(-12.2)#1,20037.3%(-13.6)#20,914
32.1520723.0%35.9%(-12.9)#1,23837.3%(-14.3)#21,575
33.1521422.6%35.9%(-13.3)#1,25337.3%(-14.7)#21,900
34.1522320.3%35.9%(-15.6)#1,37037.3%(-17.0)#23,815
35.1520419.5%35.9%(-16.4)#1,39937.3%(-17.8)#24,446
36.1522519.1%35.9%(-16.8)#1,42837.3%(-18.2)#24,792
37.1521017.8%35.9%(-18.1)#1,46937.3%(-19.5)#25,685
38.1521914.4%35.9%(-21.5)#1,57737.3%(-22.9)#27,889
39.1521313.3%35.9%(-22.6)#1,60337.3%(-24.0)#28,436

Common Questions

What are the Top 10 Zip Codes with the Highest Percentage of Households with Income Above $100,000 in Pittsburgh, PA?
Top 10 Zip Codes with the Highest Percentage of Households with Income Above $100,000 in Pittsburgh, PA are:
#1
64.4%
#2
61.2%
#3
58.7%
#4
56.1%
#5
53.6%
#6
51.7%
#7
48.0%
#8
44.4%
#9
43.3%
#10
40.9%
What zip code has the Highest Percentage of Households with Income Above $100,000 in Pittsburgh, PA?
15241 has the Highest Percentage of Households with Income Above $100,000 in Pittsburgh, PA with 64.4%.
What is the Percentage of Households with Income Above $100,000 in Pittsburgh, PA?
Percentage of Households with Income Above $100,000 in Pittsburgh is 29.2%.
What is the Percentage of Households with Income Above $100,000 in Pennsylvania?
Percentage of Households with Income Above $100,000 in Pennsylvania is 35.9%.
What is the Percentage of Households with Income Above $100,000 in the United States?
Percentage of Households with Income Above $100,000 in the United States is 37.3%.