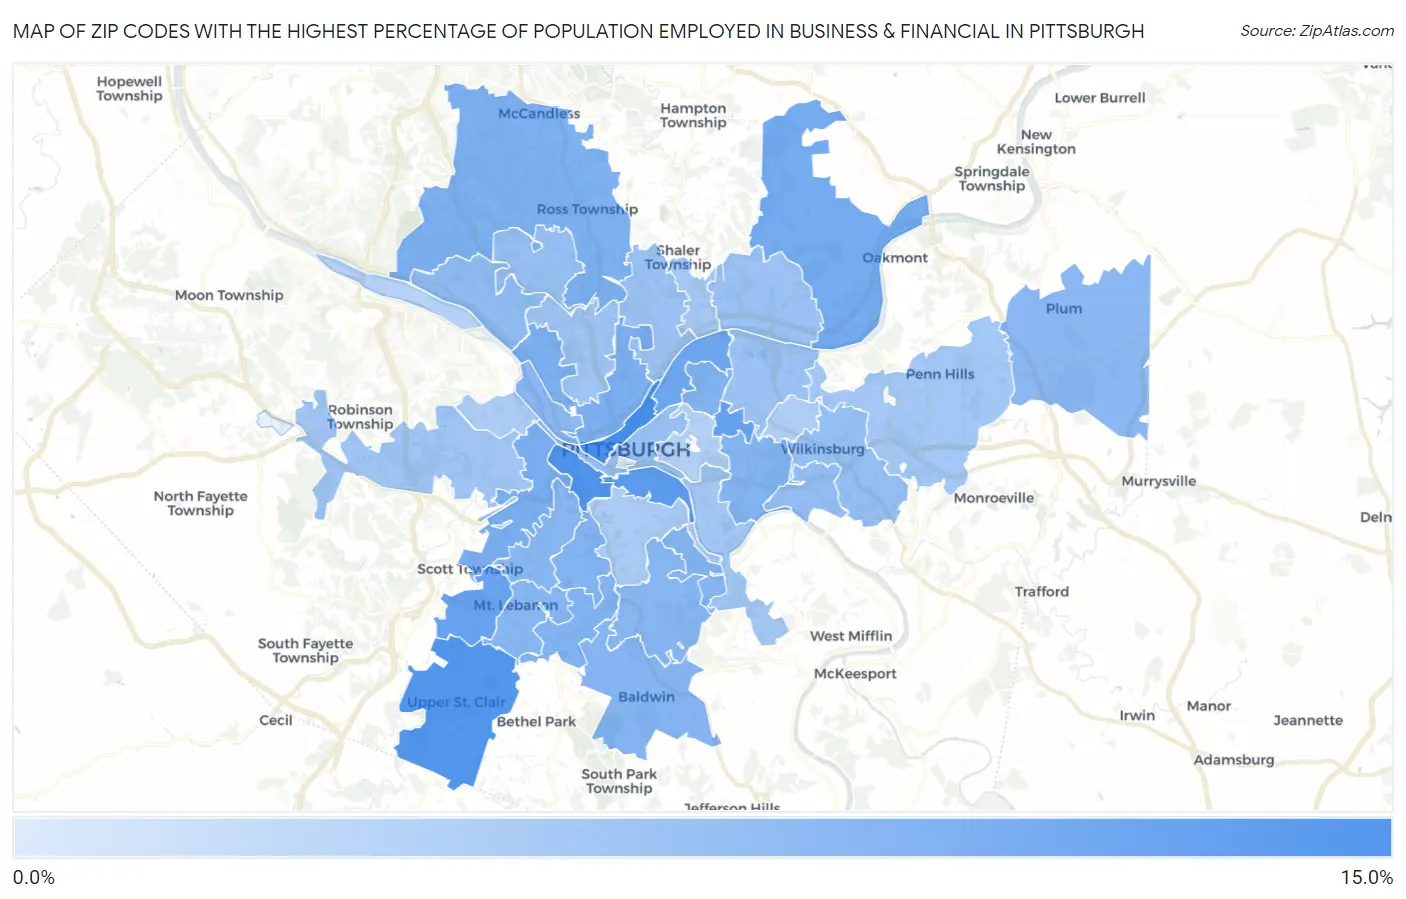
Zip Codes with the Highest Percentage of Population Employed in Business & Financial in Pittsburgh, PA
RELATED REPORTS & OPTIONS
Business & Financial
Pittsburgh
Compare Zip Codes
Map of Zip Codes with the Highest Percentage of Population Employed in Business & Financial in Pittsburgh
0.61%
14.7%
Zip Codes with the Highest Percentage of Population Employed in Business & Financial in Pittsburgh, PA
| Zip Code | % Employed | vs State | vs National | |
| 1. | 15222 | 14.7% | 5.9%(+8.83)#39 | 5.8%(+8.96)#640 |
| 2. | 15211 | 13.9% | 5.9%(+8.04)#45 | 5.8%(+8.17)#749 |
| 3. | 15241 | 13.5% | 5.9%(+7.60)#51 | 5.8%(+7.74)#834 |
| 4. | 15203 | 13.0% | 5.9%(+7.08)#56 | 5.8%(+7.22)#946 |
| 5. | 15232 | 11.7% | 5.9%(+5.85)#74 | 5.8%(+5.98)#1,308 |
| 6. | 15243 | 11.6% | 5.9%(+5.67)#77 | 5.8%(+5.81)#1,379 |
| 7. | 15201 | 10.8% | 5.9%(+4.88)#97 | 5.8%(+5.01)#1,752 |
| 8. | 15238 | 10.2% | 5.9%(+4.26)#120 | 5.8%(+4.39)#2,091 |
| 9. | 15220 | 9.8% | 5.9%(+3.94)#138 | 5.8%(+4.07)#2,317 |
| 10. | 15212 | 9.6% | 5.9%(+3.68)#155 | 5.8%(+3.81)#2,562 |
| 11. | 15237 | 9.3% | 5.9%(+3.38)#170 | 5.8%(+3.51)#2,827 |
| 12. | 15224 | 9.1% | 5.9%(+3.18)#180 | 5.8%(+3.31)#3,013 |
| 13. | 15234 | 9.0% | 5.9%(+3.15)#182 | 5.8%(+3.28)#3,039 |
| 14. | 15226 | 8.8% | 5.9%(+2.92)#195 | 5.8%(+3.05)#3,278 |
| 15. | 15217 | 8.8% | 5.9%(+2.91)#196 | 5.8%(+3.04)#3,280 |
| 16. | 15236 | 8.6% | 5.9%(+2.67)#205 | 5.8%(+2.80)#3,529 |
| 17. | 15227 | 8.4% | 5.9%(+2.51)#209 | 5.8%(+2.64)#3,721 |
| 18. | 15228 | 8.4% | 5.9%(+2.50)#212 | 5.8%(+2.63)#3,731 |
| 19. | 15216 | 8.4% | 5.9%(+2.50)#214 | 5.8%(+2.63)#3,736 |
| 20. | 15239 | 8.2% | 5.9%(+2.29)#228 | 5.8%(+2.42)#3,993 |
| 21. | 15233 | 8.0% | 5.9%(+2.08)#240 | 5.8%(+2.22)#4,274 |
| 22. | 15202 | 7.5% | 5.9%(+1.64)#266 | 5.8%(+1.77)#4,920 |
| 23. | 15218 | 7.3% | 5.9%(+1.40)#293 | 5.8%(+1.53)#5,316 |
| 24. | 15221 | 7.1% | 5.9%(+1.17)#313 | 5.8%(+1.30)#5,712 |
| 25. | 15219 | 6.9% | 5.9%(+1.04)#325 | 5.8%(+1.17)#5,911 |
| 26. | 15229 | 6.8% | 5.9%(+0.896)#338 | 5.8%(+1.03)#6,189 |
| 27. | 15206 | 6.6% | 5.9%(+0.729)#358 | 5.8%(+0.860)#6,518 |
| 28. | 15209 | 6.6% | 5.9%(+0.696)#362 | 5.8%(+0.827)#6,593 |
| 29. | 15215 | 6.4% | 5.9%(+0.521)#379 | 5.8%(+0.652)#6,937 |
| 30. | 15205 | 6.1% | 5.9%(+0.159)#418 | 5.8%(+0.290)#7,715 |
| 31. | 15214 | 6.0% | 5.9%(+0.070)#427 | 5.8%(+0.201)#7,921 |
| 32. | 15235 | 5.9% | 5.9%(+0.026)#434 | 5.8%(+0.157)#8,016 |
| 33. | 15207 | 5.8% | 5.9%(-0.121)#455 | 5.8%(+0.010)#8,357 |
| 34. | 15223 | 5.6% | 5.9%(-0.247)#473 | 5.8%(-0.116)#8,656 |
| 35. | 15210 | 5.1% | 5.9%(-0.793)#565 | 5.8%(-0.661)#10,188 |
| 36. | 15204 | 4.9% | 5.9%(-1.01)#604 | 5.8%(-0.878)#10,794 |
| 37. | 15208 | 4.8% | 5.9%(-1.13)#629 | 5.8%(-0.995)#11,186 |
| 38. | 15213 | 4.3% | 5.9%(-1.63)#723 | 5.8%(-1.50)#12,912 |
| 39. | 15225 | 4.2% | 5.9%(-1.69)#731 | 5.8%(-1.56)#13,123 |
| 40. | 15282 | 0.61% | 5.9%(-5.29)#1,428 | 5.8%(-5.16)#25,951 |
1
Common Questions
What are the Top 10 Zip Codes with the Highest Percentage of Population Employed in Business & Financial in Pittsburgh, PA?
Top 10 Zip Codes with the Highest Percentage of Population Employed in Business & Financial in Pittsburgh, PA are:
What zip code has the Highest Percentage of Population Employed in Business & Financial in Pittsburgh, PA?
15222 has the Highest Percentage of Population Employed in Business & Financial in Pittsburgh, PA with 14.7%.
What is the Percentage of Population Employed in Business & Financial in Pittsburgh, PA?
Percentage of Population Employed in Business & Financial in Pittsburgh is 8.0%.
What is the Percentage of Population Employed in Business & Financial in Pennsylvania?
Percentage of Population Employed in Business & Financial in Pennsylvania is 5.9%.
What is the Percentage of Population Employed in Business & Financial in the United States?
Percentage of Population Employed in Business & Financial in the United States is 5.8%.