Zip Codes with the Highest Percentage of Population Employed in Office & Administration in Pittsburgh, PA
RELATED REPORTS & OPTIONS
Office & Administration
Pittsburgh
Compare Zip Codes
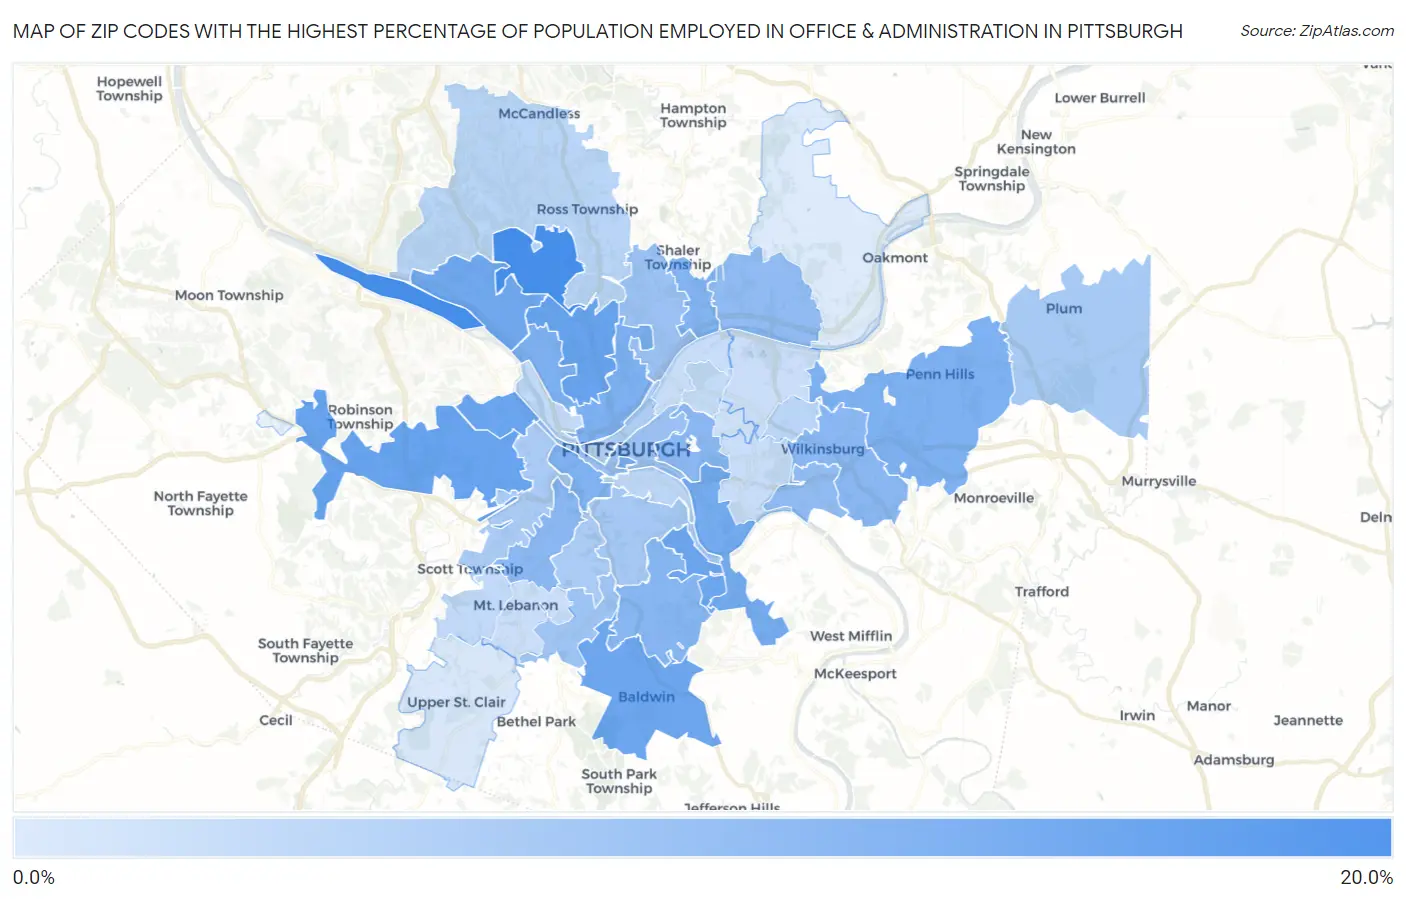
Map of Zip Codes with the Highest Percentage of Population Employed in Office & Administration in Pittsburgh
5.6%
17.2%
Zip Codes with the Highest Percentage of Population Employed in Office & Administration in Pittsburgh, PA
| Zip Code | % Employed | vs State | vs National | |
| 1. | 15225 | 17.2% | 10.9%(+6.31)#186 | 10.9%(+6.34)#2,749 |
| 2. | 15229 | 17.1% | 10.9%(+6.24)#191 | 10.9%(+6.27)#2,786 |
| 3. | 15205 | 14.4% | 10.9%(+3.55)#342 | 10.9%(+3.58)#5,340 |
| 4. | 15214 | 14.3% | 10.9%(+3.46)#352 | 10.9%(+3.49)#5,461 |
| 5. | 15204 | 14.3% | 10.9%(+3.38)#362 | 10.9%(+3.41)#5,605 |
| 6. | 15236 | 14.0% | 10.9%(+3.14)#381 | 10.9%(+3.17)#5,977 |
| 7. | 15202 | 13.7% | 10.9%(+2.81)#404 | 10.9%(+2.85)#6,535 |
| 8. | 15207 | 13.5% | 10.9%(+2.59)#426 | 10.9%(+2.62)#6,976 |
| 9. | 15282 | 13.2% | 10.9%(+2.33)#444 | 10.9%(+2.36)#7,537 |
| 10. | 15212 | 12.8% | 10.9%(+1.94)#498 | 10.9%(+1.97)#8,479 |
| 11. | 15235 | 12.8% | 10.9%(+1.92)#502 | 10.9%(+1.95)#8,535 |
| 12. | 15211 | 12.6% | 10.9%(+1.67)#536 | 10.9%(+1.70)#9,135 |
| 13. | 15223 | 12.5% | 10.9%(+1.63)#542 | 10.9%(+1.66)#9,228 |
| 14. | 15227 | 12.1% | 10.9%(+1.26)#610 | 10.9%(+1.29)#10,292 |
| 15. | 15216 | 11.9% | 10.9%(+1.06)#644 | 10.9%(+1.09)#10,910 |
| 16. | 15213 | 11.9% | 10.9%(+1.03)#652 | 10.9%(+1.07)#10,983 |
| 17. | 15221 | 11.9% | 10.9%(+1.01)#656 | 10.9%(+1.05)#11,057 |
| 18. | 15215 | 11.4% | 10.9%(+0.515)#736 | 10.9%(+0.547)#12,536 |
| 19. | 15218 | 11.4% | 10.9%(+0.467)#752 | 10.9%(+0.498)#12,703 |
| 20. | 15209 | 10.6% | 10.9%(-0.298)#899 | 10.9%(-0.266)#15,168 |
| 21. | 15219 | 10.6% | 10.9%(-0.299)#900 | 10.9%(-0.268)#15,169 |
| 22. | 15234 | 10.3% | 10.9%(-0.615)#960 | 10.9%(-0.583)#16,257 |
| 23. | 15210 | 9.7% | 10.9%(-1.20)#1,057 | 10.9%(-1.17)#18,102 |
| 24. | 15239 | 9.6% | 10.9%(-1.31)#1,076 | 10.9%(-1.27)#18,475 |
| 25. | 15220 | 9.3% | 10.9%(-1.56)#1,116 | 10.9%(-1.53)#19,288 |
| 26. | 15226 | 9.2% | 10.9%(-1.73)#1,142 | 10.9%(-1.70)#19,782 |
| 27. | 15222 | 9.0% | 10.9%(-1.93)#1,175 | 10.9%(-1.90)#20,364 |
| 28. | 15237 | 8.3% | 10.9%(-2.62)#1,284 | 10.9%(-2.59)#22,317 |
| 29. | 15208 | 8.2% | 10.9%(-2.73)#1,293 | 10.9%(-2.69)#22,631 |
| 30. | 15203 | 8.0% | 10.9%(-2.94)#1,317 | 10.9%(-2.90)#23,130 |
| 31. | 15243 | 7.7% | 10.9%(-3.20)#1,353 | 10.9%(-3.17)#23,745 |
| 32. | 15224 | 7.6% | 10.9%(-3.32)#1,364 | 10.9%(-3.29)#24,007 |
| 33. | 15233 | 7.5% | 10.9%(-3.40)#1,372 | 10.9%(-3.37)#24,197 |
| 34. | 15201 | 7.2% | 10.9%(-3.66)#1,401 | 10.9%(-3.63)#24,769 |
| 35. | 15217 | 7.1% | 10.9%(-3.77)#1,414 | 10.9%(-3.74)#25,002 |
| 36. | 15206 | 7.1% | 10.9%(-3.83)#1,420 | 10.9%(-3.80)#25,103 |
| 37. | 15228 | 7.0% | 10.9%(-3.94)#1,430 | 10.9%(-3.90)#25,304 |
| 38. | 15232 | 6.6% | 10.9%(-4.28)#1,457 | 10.9%(-4.25)#25,904 |
| 39. | 15241 | 6.0% | 10.9%(-4.89)#1,501 | 10.9%(-4.86)#26,848 |
| 40. | 15238 | 5.6% | 10.9%(-5.25)#1,518 | 10.9%(-5.22)#27,362 |
1
Common Questions
What are the Top 10 Zip Codes with the Highest Percentage of Population Employed in Office & Administration in Pittsburgh, PA?
Top 10 Zip Codes with the Highest Percentage of Population Employed in Office & Administration in Pittsburgh, PA are:
What zip code has the Highest Percentage of Population Employed in Office & Administration in Pittsburgh, PA?
15225 has the Highest Percentage of Population Employed in Office & Administration in Pittsburgh, PA with 17.2%.
What is the Percentage of Population Employed in Office & Administration in Pittsburgh, PA?
Percentage of Population Employed in Office & Administration in Pittsburgh is 10.1%.
What is the Percentage of Population Employed in Office & Administration in Pennsylvania?
Percentage of Population Employed in Office & Administration in Pennsylvania is 10.9%.
What is the Percentage of Population Employed in Office & Administration in the United States?
Percentage of Population Employed in Office & Administration in the United States is 10.9%.