Zip Codes with the Highest Percentage of Population with a Degree in Psychology in Pittsburgh, PA

RELATED REPORTS & OPTIONS

Psychology
Population
Families and Households
Female Fertility
Female Fertility (Unmarried)
Race (Community Size)
Race (Percentage)
Ancestry (Community Size)
AfghanAfricanAlbanianAlsatianAmericanApacheArabArgentineanArmenianAustralianAustrianBahamianBarbadianBasqueBelgianBhutaneseBlackfeetBolivianBrazilianBritishBritish West IndianBulgarianBurmeseCajunCambodianCanadianCape VerdeanCarpatho RusynCelticCentral AmericanCentral American IndianCherokeeChickasawChileanChippewaChoctawColombianComancheCosta RicanCreekCroatianCubanCypriotCzechCzechoslovakianDanishDelawareDominicanDutchEastern EuropeanEcuadorianEgyptianEnglishEthiopianEuropeanFilipinoFinnishFrenchFrench American IndianFrench CanadianGermanGhanaianGreekGuamanian / ChamorroGuatemalanGuyaneseHaitianHonduranHungarianIndian (Asian)IndonesianIranianIraqiIrishIroquoisIsraeliItalianJamaicanJapaneseJordanianKenyanKoreanLaotianLatvianLebaneseLiberianLithuanianLumbeeLuxembourgerMacedonianMalaysianMalteseMexicanMexican American IndianMongolianMoroccanNative HawaiianNavajoNew ZealanderNicaraguanNigerianNorthern EuropeanNorwegianPakistaniPalestinianPanamanianParaguayanPennsylvania GermanPeruvianPolishPortuguesePuerto RicanRomanianRussianSalvadoranSamoanScandinavianScotch-IrishScottishSeminoleSerbianSiouxSlavicSlovakSloveneSouth AfricanSouth AmericanSouth American IndianSoviet UnionSpaniardSpanishSri LankanSubsaharan AfricanSudaneseSwedishSwissSyrianThaiTrinidadian and TobagonianTurkishU.S. Virgin IslanderUgandanUkrainianUruguayanVenezuelanVietnameseWelshWest IndianYugoslavian
Ancestry (Percentage)
AfghanAfricanAlbanianAlsatianAmericanApacheArabArgentineanArmenianAustralianAustrianBahamianBarbadianBasqueBelgianBhutaneseBlackfeetBolivianBrazilianBritishBritish West IndianBulgarianBurmeseCajunCambodianCanadianCape VerdeanCarpatho RusynCelticCentral AmericanCentral American IndianCherokeeChickasawChileanChippewaChoctawColombianComancheCosta RicanCreekCroatianCubanCypriotCzechCzechoslovakianDanishDelawareDominicanDutchEastern EuropeanEcuadorianEgyptianEnglishEthiopianEuropeanFilipinoFinnishFrenchFrench American IndianFrench CanadianGermanGhanaianGreekGuamanian / ChamorroGuatemalanGuyaneseHaitianHonduranHungarianIndian (Asian)IndonesianIranianIraqiIrishIroquoisIsraeliItalianJamaicanJapaneseJordanianKenyanKoreanLaotianLatvianLebaneseLiberianLithuanianLumbeeLuxembourgerMacedonianMalaysianMalteseMexicanMexican American IndianMongolianMoroccanNative HawaiianNavajoNew ZealanderNicaraguanNigerianNorthern EuropeanNorwegianPakistaniPalestinianPanamanianParaguayanPennsylvania GermanPeruvianPolishPortuguesePuerto RicanRomanianRussianSalvadoranSamoanScandinavianScotch-IrishScottishSeminoleSerbianSiouxSlavicSlovakSloveneSouth AfricanSouth AmericanSouth American IndianSoviet UnionSpaniardSpanishSri LankanSubsaharan AfricanSudaneseSwedishSwissSyrianThaiTrinidadian and TobagonianTurkishU.S. Virgin IslanderUgandanUkrainianUruguayanVenezuelanVietnameseWelshWest IndianYugoslavian
Immigrant Origin (Total)
AfghanistanAfricaAlbaniaArgentinaAsiaAustraliaAustriaBahamasBangladeshBelarusBelgiumBoliviaBosnia and HerzegovinaBrazilBulgariaBurma / MyanmarCambodiaCameroonCanadaCaribbeanCentral AmericaChileChinaColombiaCongoCosta RicaCroatiaCubaCzechoslovakiaDenmarkDominican RepublicEastern AfricaEastern AsiaEastern EuropeEcuadorEgyptEl SalvadorEnglandEritreaEthiopiaEuropeFranceGermanyGhanaGreeceGuatemalaGuyanaHaitiHondurasHong KongHungaryIndiaIndonesiaIranIraqIrelandIsraelItalyJamaicaJapanJordanKazakhstanKenyaKoreaKuwaitLatin AmericaLatviaLebanonLiberiaLithuaniaMalaysiaMexicoMiddle AfricaMoldovaMoroccoNepalNetherlandsNigeriaNorthern AfricaNorthern EuropeNorwayOceaniaPakistanPanamaPeruPhilippinesPolandPortugalRomaniaRussiaSaudi ArabiaScotlandSerbiaSingaporeSouth AfricaSouth AmericaSouth Central AsiaSouth Eastern AsiaSouthern EuropeSpainSri LankaSudanSwedenSwitzerlandSyriaTaiwanThailandTrinidad and TobagoTurkeyUgandaUkraineUzbekistanVenezuelaVietnamWestern AfricaWestern AsiaWestern EuropeZaire
Immigrant Origin (Percentage)
AfghanistanAfricaAlbaniaArgentinaAsiaAustraliaAustriaBahamasBangladeshBelarusBelgiumBoliviaBosnia and HerzegovinaBrazilBulgariaBurma / MyanmarCambodiaCameroonCanadaCaribbeanCentral AmericaChileChinaColombiaCongoCosta RicaCroatiaCubaCzechoslovakiaDenmarkDominican RepublicEastern AfricaEastern AsiaEastern EuropeEcuadorEgyptEl SalvadorEnglandEritreaEthiopiaEuropeFranceGermanyGhanaGreeceGuatemalaGuyanaHaitiHondurasHong KongHungaryIndiaIndonesiaIranIraqIrelandIsraelItalyJamaicaJapanJordanKazakhstanKenyaKoreaKuwaitLatin AmericaLatviaLebanonLiberiaLithuaniaMalaysiaMexicoMiddle AfricaMoldovaMoroccoNepalNetherlandsNigeriaNorthern AfricaNorthern EuropeNorwayOceaniaPakistanPanamaPeruPhilippinesPolandPortugalRomaniaRussiaSaudi ArabiaScotlandSerbiaSingaporeSouth AfricaSouth AmericaSouth Central AsiaSouth Eastern AsiaSouthern EuropeSpainSri LankaSudanSwedenSwitzerlandSyriaTaiwanThailandTrinidad and TobagoTurkeyUgandaUkraineUzbekistanVenezuelaVietnamWestern AfricaWestern AsiaWestern EuropeZaire
Income
Income (Families)
Income (Households)
Poverty
Poverty (Families)
Unemployment
Employment Occupations
Employment Industries
Employer Class
Commute Time
Commute Means
School Enrollment
Education by Degree Field
Occupancy
Finances
Physical Characteristics
Pittsburgh
Compare Zip Codes
Comparison Subject

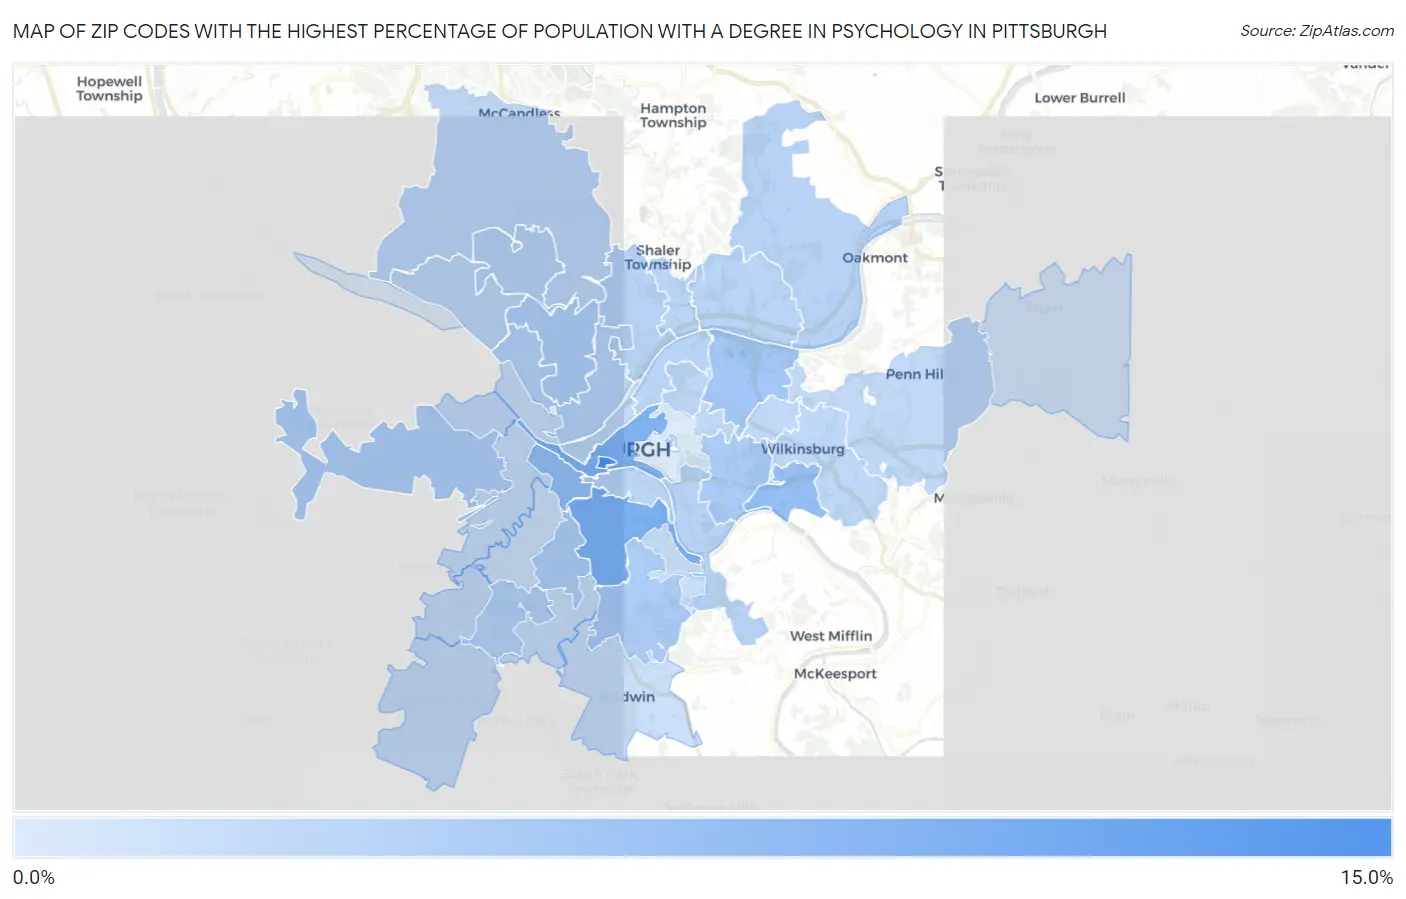
Map of Zip Codes with the Highest Percentage of Population with a Degree in Psychology in Pittsburgh

0.0%
15.0%
Zip Codes with the Highest Percentage of Population with a Degree in Psychology in Pittsburgh Map

Zip Codes with the Highest Percentage of Population with a Degree in Psychology in Pittsburgh, PA

Zip Code % Graduates vs State vs National
1.1528213.7%5.3%(+8.47)#915.1%(+8.67)#1,325
2.152109.8%5.3%(+4.53)#1635.1%(+4.74)#2,609
3.152199.6%5.3%(+4.32)#1745.1%(+4.52)#2,740
4.152188.1%5.3%(+2.85)#2535.1%(+3.06)#4,007
5.152118.1%5.3%(+2.79)#2585.1%(+3.00)#4,068
6.152067.2%5.3%(+1.97)#3155.1%(+2.17)#5,249
7.152176.7%5.3%(+1.44)#3725.1%(+1.64)#6,237
8.152276.6%5.3%(+1.33)#3885.1%(+1.53)#6,480
9.152146.2%5.3%(+0.948)#4435.1%(+1.15)#7,358
10.152056.1%5.3%(+0.848)#4575.1%(+1.05)#7,654
11.152266.1%5.3%(+0.837)#4595.1%(+1.04)#7,688
12.152075.8%5.3%(+0.546)#5135.1%(+0.751)#8,562
13.152095.8%5.3%(+0.505)#5215.1%(+0.710)#8,709
14.152385.7%5.3%(+0.484)#5235.1%(+0.689)#8,758
15.152285.7%5.3%(+0.438)#5325.1%(+0.643)#8,905
16.152125.6%5.3%(+0.361)#5465.1%(+0.566)#9,131
17.152015.6%5.3%(+0.333)#5535.1%(+0.538)#9,226
18.152155.6%5.3%(+0.330)#5545.1%(+0.535)#9,233
19.152035.6%5.3%(+0.322)#5575.1%(+0.527)#9,254
20.152245.5%5.3%(+0.265)#5685.1%(+0.470)#9,454
21.152295.5%5.3%(+0.253)#5715.1%(+0.458)#9,496
22.152235.5%5.3%(+0.213)#5815.1%(+0.418)#9,637
23.152215.4%5.3%(+0.095)#6055.1%(+0.301)#9,994
24.152375.2%5.3%(-0.040)#6215.1%(+0.165)#10,478
25.152355.2%5.3%(-0.065)#6255.1%(+0.141)#10,570
26.152325.2%5.3%(-0.094)#6315.1%(+0.111)#10,675
27.152085.2%5.3%(-0.097)#6325.1%(+0.109)#10,684
28.152025.0%5.3%(-0.216)#6495.1%(-0.011)#11,115
29.152225.0%5.3%(-0.227)#6535.1%(-0.022)#11,160
30.152044.7%5.3%(-0.538)#7135.1%(-0.333)#12,252
31.152414.6%5.3%(-0.607)#7285.1%(-0.402)#12,527
32.152434.6%5.3%(-0.641)#7425.1%(-0.435)#12,654
33.152204.4%5.3%(-0.870)#7915.1%(-0.665)#13,534
34.152344.4%5.3%(-0.882)#7945.1%(-0.677)#13,582
35.152364.4%5.3%(-0.901)#7985.1%(-0.695)#13,641
36.152334.3%5.3%(-0.980)#8125.1%(-0.775)#13,940
37.152164.0%5.3%(-1.22)#8455.1%(-1.01)#14,795
38.152393.5%5.3%(-1.77)#9655.1%(-1.57)#16,741
39.152133.4%5.3%(-1.90)#9855.1%(-1.70)#17,140

Common Questions

What are the Top 10 Zip Codes with the Highest Percentage of Population with a Degree in Psychology in Pittsburgh, PA?
Top 10 Zip Codes with the Highest Percentage of Population with a Degree in Psychology in Pittsburgh, PA are:
#1
13.7%
#2
9.8%
#3
9.6%
#4
8.1%
#5
8.1%
#6
7.2%
#7
6.7%
#8
6.6%
#9
6.2%
#10
6.1%
What zip code has the Highest Percentage of Population with a Degree in Psychology in Pittsburgh, PA?
15282 has the Highest Percentage of Population with a Degree in Psychology in Pittsburgh, PA with 13.7%.
What is the Percentage of Population with a Degree in Psychology in Pittsburgh, PA?
Percentage of Population with a Degree in Psychology in Pittsburgh is 6.1%.
What is the Percentage of Population with a Degree in Psychology in Pennsylvania?
Percentage of Population with a Degree in Psychology in Pennsylvania is 5.3%.
What is the Percentage of Population with a Degree in Psychology in the United States?
Percentage of Population with a Degree in Psychology in the United States is 5.1%.