Zip Codes with the Lowest Poverty Level Among Children Under the Age of 5 in Pittsburgh, PA

RELATED REPORTS & OPTIONS

Lowest Poverty | Child 0-5
Population
Families and Households
Female Fertility
Female Fertility (Unmarried)
Race (Community Size)
Race (Percentage)
Ancestry (Community Size)
AfghanAfricanAlbanianAlsatianAmericanApacheArabArgentineanArmenianAustralianAustrianBahamianBarbadianBasqueBelgianBhutaneseBlackfeetBolivianBrazilianBritishBritish West IndianBulgarianBurmeseCajunCambodianCanadianCape VerdeanCarpatho RusynCelticCentral AmericanCentral American IndianCherokeeChickasawChileanChippewaChoctawColombianComancheCosta RicanCreekCroatianCubanCypriotCzechCzechoslovakianDanishDelawareDominicanDutchEastern EuropeanEcuadorianEgyptianEnglishEthiopianEuropeanFilipinoFinnishFrenchFrench American IndianFrench CanadianGermanGhanaianGreekGuamanian / ChamorroGuatemalanGuyaneseHaitianHonduranHungarianIndian (Asian)IndonesianIranianIraqiIrishIroquoisIsraeliItalianJamaicanJapaneseJordanianKenyanKoreanLaotianLatvianLebaneseLiberianLithuanianLumbeeLuxembourgerMacedonianMalaysianMalteseMexicanMexican American IndianMongolianMoroccanNative HawaiianNavajoNew ZealanderNicaraguanNigerianNorthern EuropeanNorwegianPakistaniPalestinianPanamanianParaguayanPennsylvania GermanPeruvianPolishPortuguesePuerto RicanRomanianRussianSalvadoranSamoanScandinavianScotch-IrishScottishSeminoleSerbianSiouxSlavicSlovakSloveneSouth AfricanSouth AmericanSouth American IndianSoviet UnionSpaniardSpanishSri LankanSubsaharan AfricanSudaneseSwedishSwissSyrianThaiTrinidadian and TobagonianTurkishU.S. Virgin IslanderUgandanUkrainianUruguayanVenezuelanVietnameseWelshWest IndianYugoslavian
Ancestry (Percentage)
AfghanAfricanAlbanianAlsatianAmericanApacheArabArgentineanArmenianAustralianAustrianBahamianBarbadianBasqueBelgianBhutaneseBlackfeetBolivianBrazilianBritishBritish West IndianBulgarianBurmeseCajunCambodianCanadianCape VerdeanCarpatho RusynCelticCentral AmericanCentral American IndianCherokeeChickasawChileanChippewaChoctawColombianComancheCosta RicanCreekCroatianCubanCypriotCzechCzechoslovakianDanishDelawareDominicanDutchEastern EuropeanEcuadorianEgyptianEnglishEthiopianEuropeanFilipinoFinnishFrenchFrench American IndianFrench CanadianGermanGhanaianGreekGuamanian / ChamorroGuatemalanGuyaneseHaitianHonduranHungarianIndian (Asian)IndonesianIranianIraqiIrishIroquoisIsraeliItalianJamaicanJapaneseJordanianKenyanKoreanLaotianLatvianLebaneseLiberianLithuanianLumbeeLuxembourgerMacedonianMalaysianMalteseMexicanMexican American IndianMongolianMoroccanNative HawaiianNavajoNew ZealanderNicaraguanNigerianNorthern EuropeanNorwegianPakistaniPalestinianPanamanianParaguayanPennsylvania GermanPeruvianPolishPortuguesePuerto RicanRomanianRussianSalvadoranSamoanScandinavianScotch-IrishScottishSeminoleSerbianSiouxSlavicSlovakSloveneSouth AfricanSouth AmericanSouth American IndianSoviet UnionSpaniardSpanishSri LankanSubsaharan AfricanSudaneseSwedishSwissSyrianThaiTrinidadian and TobagonianTurkishU.S. Virgin IslanderUgandanUkrainianUruguayanVenezuelanVietnameseWelshWest IndianYugoslavian
Immigrant Origin (Total)
AfghanistanAfricaAlbaniaArgentinaAsiaAustraliaAustriaBahamasBangladeshBelarusBelgiumBoliviaBosnia and HerzegovinaBrazilBulgariaBurma / MyanmarCambodiaCameroonCanadaCaribbeanCentral AmericaChileChinaColombiaCongoCosta RicaCroatiaCubaCzechoslovakiaDenmarkDominican RepublicEastern AfricaEastern AsiaEastern EuropeEcuadorEgyptEl SalvadorEnglandEritreaEthiopiaEuropeFranceGermanyGhanaGreeceGuatemalaGuyanaHaitiHondurasHong KongHungaryIndiaIndonesiaIranIraqIrelandIsraelItalyJamaicaJapanJordanKazakhstanKenyaKoreaKuwaitLatin AmericaLatviaLebanonLiberiaLithuaniaMalaysiaMexicoMiddle AfricaMoldovaMoroccoNepalNetherlandsNigeriaNorthern AfricaNorthern EuropeNorwayOceaniaPakistanPanamaPeruPhilippinesPolandPortugalRomaniaRussiaSaudi ArabiaScotlandSerbiaSingaporeSouth AfricaSouth AmericaSouth Central AsiaSouth Eastern AsiaSouthern EuropeSpainSri LankaSudanSwedenSwitzerlandSyriaTaiwanThailandTrinidad and TobagoTurkeyUgandaUkraineUzbekistanVenezuelaVietnamWestern AfricaWestern AsiaWestern EuropeZaire
Immigrant Origin (Percentage)
AfghanistanAfricaAlbaniaArgentinaAsiaAustraliaAustriaBahamasBangladeshBelarusBelgiumBoliviaBosnia and HerzegovinaBrazilBulgariaBurma / MyanmarCambodiaCameroonCanadaCaribbeanCentral AmericaChileChinaColombiaCongoCosta RicaCroatiaCubaCzechoslovakiaDenmarkDominican RepublicEastern AfricaEastern AsiaEastern EuropeEcuadorEgyptEl SalvadorEnglandEritreaEthiopiaEuropeFranceGermanyGhanaGreeceGuatemalaGuyanaHaitiHondurasHong KongHungaryIndiaIndonesiaIranIraqIrelandIsraelItalyJamaicaJapanJordanKazakhstanKenyaKoreaKuwaitLatin AmericaLatviaLebanonLiberiaLithuaniaMalaysiaMexicoMiddle AfricaMoldovaMoroccoNepalNetherlandsNigeriaNorthern AfricaNorthern EuropeNorwayOceaniaPakistanPanamaPeruPhilippinesPolandPortugalRomaniaRussiaSaudi ArabiaScotlandSerbiaSingaporeSouth AfricaSouth AmericaSouth Central AsiaSouth Eastern AsiaSouthern EuropeSpainSri LankaSudanSwedenSwitzerlandSyriaTaiwanThailandTrinidad and TobagoTurkeyUgandaUkraineUzbekistanVenezuelaVietnamWestern AfricaWestern AsiaWestern EuropeZaire
Income
Income (Families)
Income (Households)
Poverty
Poverty (Families)
Unemployment
Employment Occupations
Employment Industries
Employer Class
Commute Time
Commute Means
School Enrollment
Education by Degree Field
Occupancy
Finances
Physical Characteristics
Pittsburgh
Compare Zip Codes
Comparison Subject

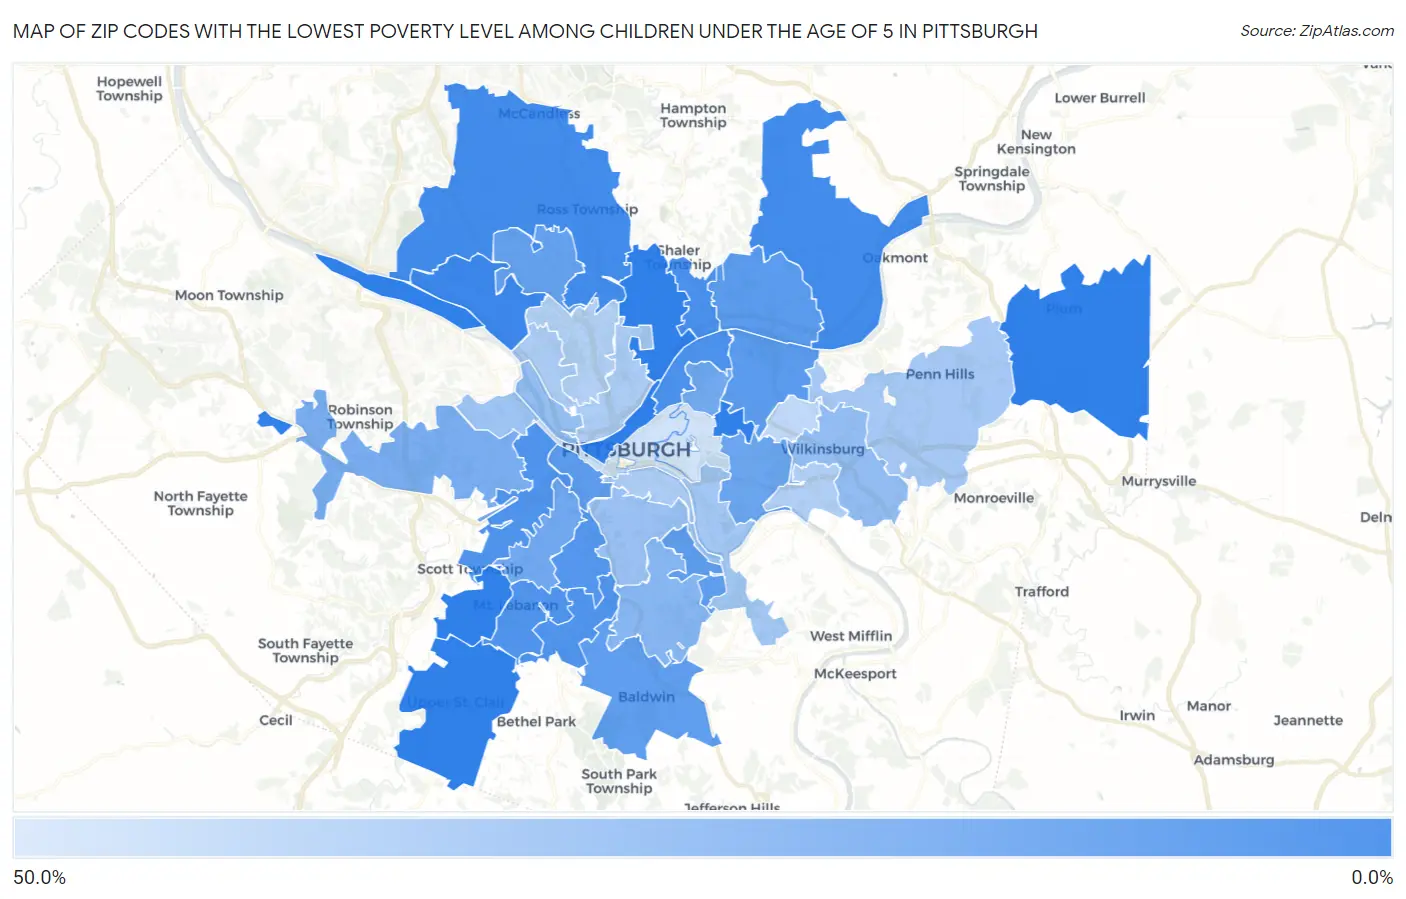
Map of Zip Codes with the Lowest Poverty Level Among Children Under the Age of 5 in Pittsburgh

50.0%
0.0%
Zip Codes with the Lowest Poverty Level Among Children Under the Age of 5 in Pittsburgh Map

Zip Codes with the Lowest Poverty Level Among Children Under the Age of 5 in Pittsburgh, PA

Zip Code Child Poverty vs State vs National
1.152020.81%17.3%(-16.4)#1318.1%(-17.3)#179
2.152382.5%17.3%(-14.8)#7318.1%(-15.6)#1,137
3.152372.6%17.3%(-14.7)#8018.1%(-15.5)#1,210
4.152234.7%17.3%(-12.6)#15918.1%(-13.4)#2,679
5.152015.0%17.3%(-12.2)#17018.1%(-13.0)#2,930
6.152346.0%17.3%(-11.3)#21518.1%(-12.1)#3,586
7.152206.1%17.3%(-11.2)#21818.1%(-12.0)#3,655
8.152286.3%17.3%(-11.0)#23018.1%(-11.8)#3,827
9.152267.6%17.3%(-9.65)#27118.1%(-10.5)#4,673
10.152069.2%17.3%(-8.08)#33118.1%(-8.88)#5,738
11.152159.3%17.3%(-8.00)#33318.1%(-8.81)#5,788
12.1521110.3%17.3%(-7.01)#36318.1%(-7.81)#6,407
13.1523610.5%17.3%(-6.77)#37118.1%(-7.58)#6,548
14.1522912.0%17.3%(-5.27)#41518.1%(-6.07)#7,446
15.1521713.8%17.3%(-3.50)#47318.1%(-4.30)#8,488
16.1521615.4%17.3%(-1.84)#52218.1%(-2.65)#9,461
17.1522415.6%17.3%(-1.71)#52618.1%(-2.51)#9,520
18.1520518.2%17.3%(+0.921)#60118.1%(+0.119)#10,786
19.1522722.0%17.3%(+4.70)#68018.1%(+3.90)#12,468
20.1522125.9%17.3%(+8.64)#74718.1%(+7.83)#13,997
21.1523326.6%17.3%(+9.33)#75718.1%(+8.53)#14,231
22.1521027.6%17.3%(+10.3)#77018.1%(+9.53)#14,576
23.1520429.5%17.3%(+12.2)#80518.1%(+11.4)#15,170
24.1520730.9%17.3%(+13.7)#82018.1%(+12.8)#15,554
25.1523531.6%17.3%(+14.3)#82818.1%(+13.5)#15,741
26.1520333.8%17.3%(+16.6)#87018.1%(+15.8)#16,339
27.1521234.1%17.3%(+16.9)#87318.1%(+16.1)#16,410
28.1521835.6%17.3%(+18.4)#89118.1%(+17.6)#16,752
29.1521436.1%17.3%(+18.9)#89918.1%(+18.1)#16,875
30.1520841.2%17.3%(+23.9)#94318.1%(+23.1)#17,872
31.1521946.8%17.3%(+29.6)#98318.1%(+28.8)#18,729
32.1521346.8%17.3%(+29.6)#98418.1%(+28.8)#18,736

Common Questions

What are the Top 10 Zip Codes with the Lowest Poverty Level Among Children Under the Age of 5 in Pittsburgh, PA?
Top 10 Zip Codes with the Lowest Poverty Level Among Children Under the Age of 5 in Pittsburgh, PA are:
#1
0.0%
#2
0.0%
#3
0.0%
#4
0.0%
#5
0.0%
#6
0.0%
#7
0.0%
#8
0.0%
#9
0.81%
#10
2.5%
What zip code has the Lowest Poverty Level Among Children Under the Age of 5 in Pittsburgh, PA?
15202 has the Lowest Poverty Level Among Children Under the Age of 5 in Pittsburgh, PA with 0.81%.
What is the Poverty Level Among Children Under the Age of 5 in Pittsburgh, PA?
Poverty Level Among Children Under the Age of 5 in Pittsburgh is 27.3%.
What is the Poverty Level Among Children Under the Age of 5 in Pennsylvania?
Poverty Level Among Children Under the Age of 5 in Pennsylvania is 17.3%.
What is the Poverty Level Among Children Under the Age of 5 in the United States?
Poverty Level Among Children Under the Age of 5 in the United States is 18.1%.