Zip Codes with the Highest Percentage of Households with Income Below $10,000 in Levittown, PA
RELATED REPORTS & OPTIONS
Household Income | $0-10k
Levittown
Compare Zip Codes
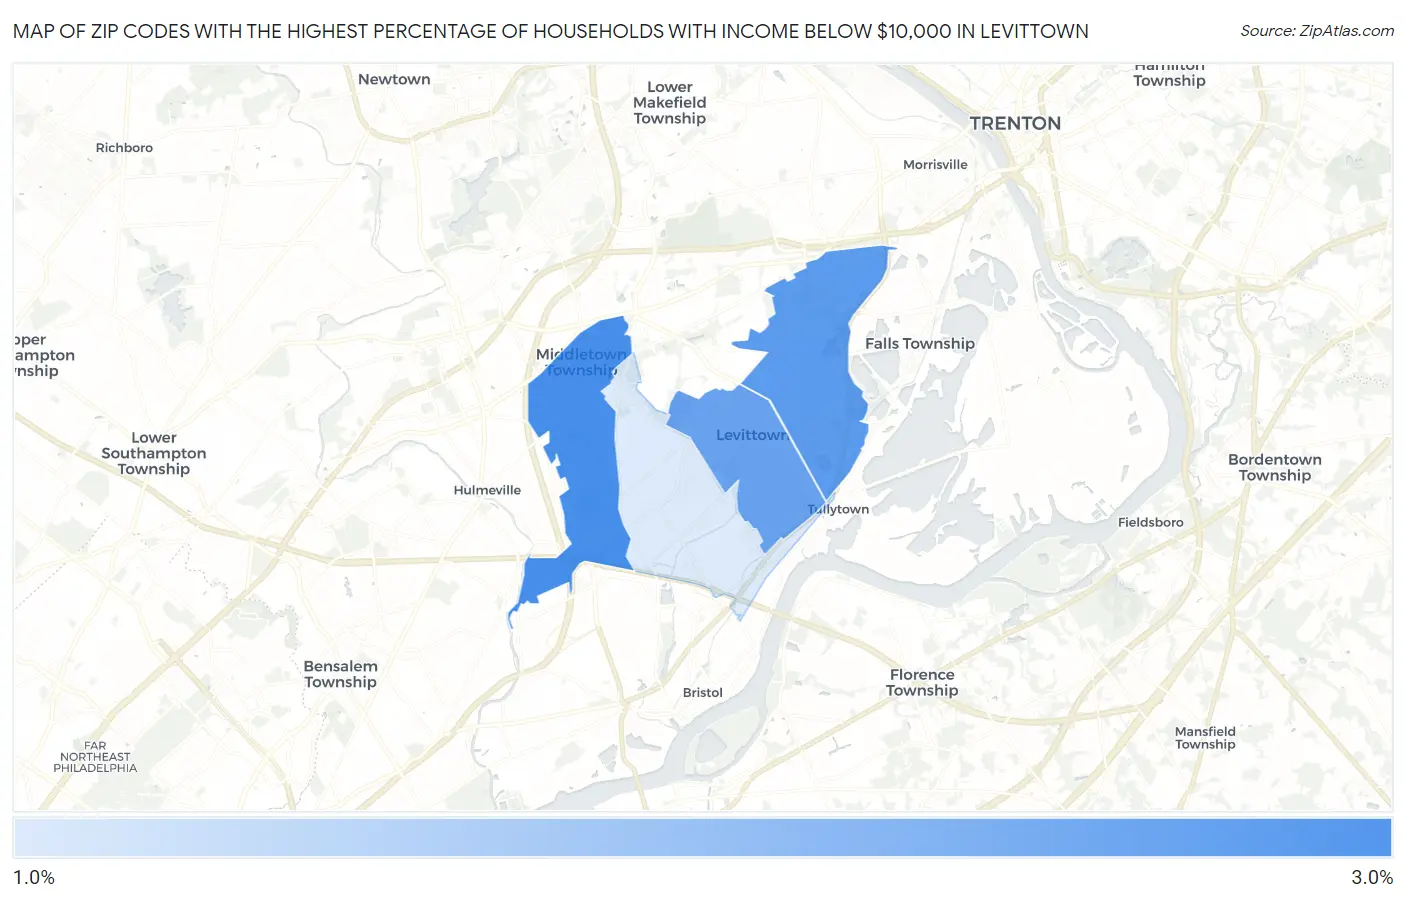
Map of Zip Codes with the Highest Percentage of Households with Income Below $10,000 in Levittown
1.4%
2.8%
Zip Codes with the Highest Percentage of Households with Income Below $10,000 in Levittown, PA
| Zip Code | Households with Income < $10k | vs State | vs National | |
| 1. | 19056 | 2.8% | 4.8%(-2.00)#973 | 4.9%(-2.10)#20,350 |
| 2. | 19054 | 2.6% | 4.8%(-2.20)#1,021 | 4.9%(-2.30)#21,175 |
| 3. | 19055 | 2.5% | 4.8%(-2.30)#1,048 | 4.9%(-2.40)#21,654 |
| 4. | 19057 | 1.4% | 4.8%(-3.40)#1,304 | 4.9%(-3.50)#25,742 |
1
Common Questions
What are the Top 3 Zip Codes with the Highest Percentage of Households with Income Below $10,000 in Levittown, PA?
Top 3 Zip Codes with the Highest Percentage of Households with Income Below $10,000 in Levittown, PA are:
What zip code has the Highest Percentage of Households with Income Below $10,000 in Levittown, PA?
19056 has the Highest Percentage of Households with Income Below $10,000 in Levittown, PA with 2.8%.
What is the Percentage of Households with Income Below $10,000 in Levittown, PA?
Percentage of Households with Income Below $10,000 in Levittown is 1.9%.
What is the Percentage of Households with Income Below $10,000 in Pennsylvania?
Percentage of Households with Income Below $10,000 in Pennsylvania is 4.8%.
What is the Percentage of Households with Income Below $10,000 in the United States?
Percentage of Households with Income Below $10,000 in the United States is 4.9%.