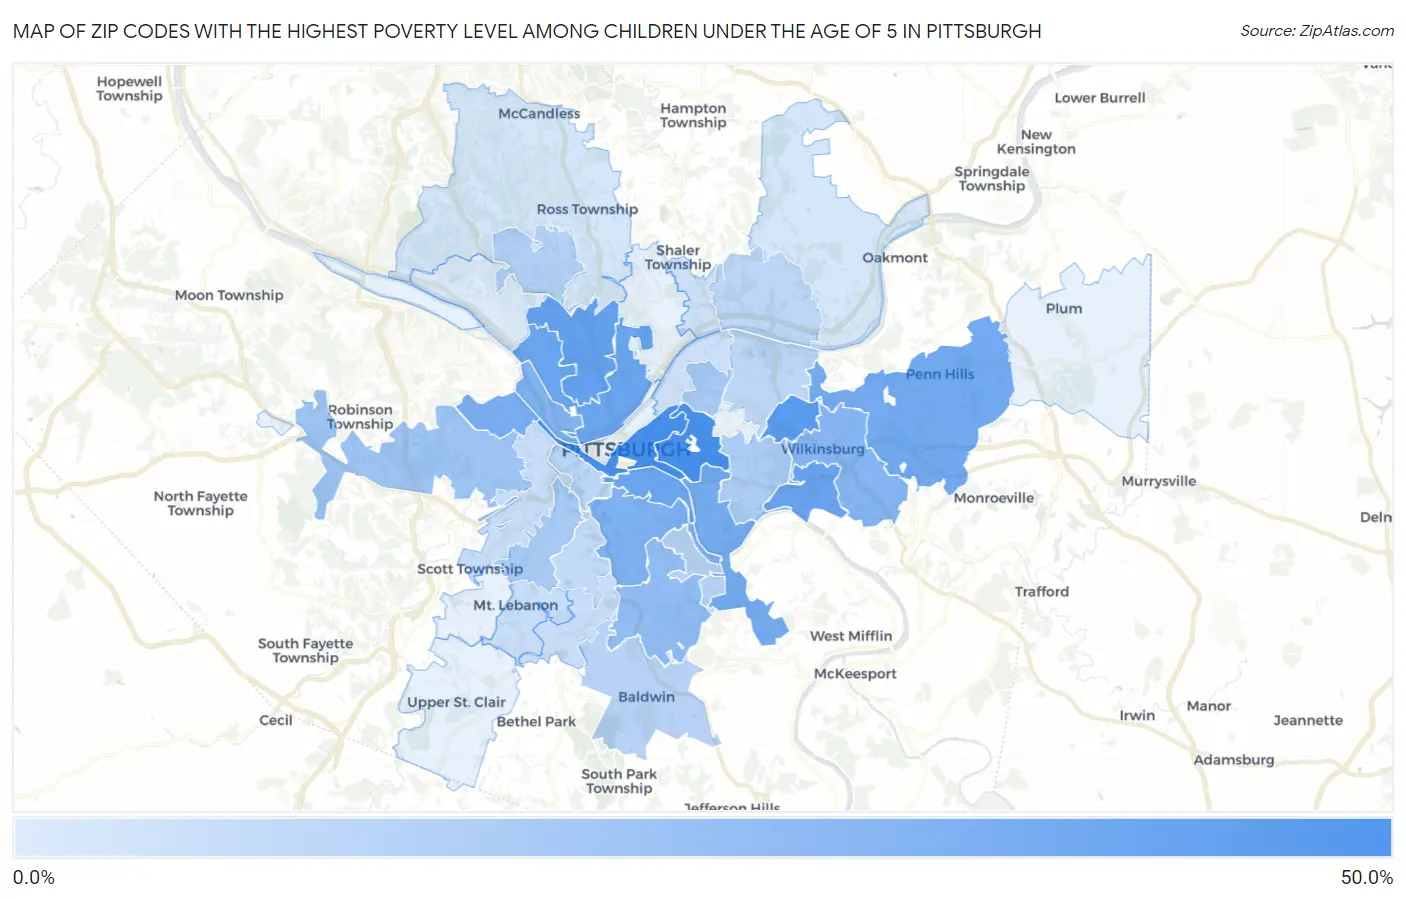
Zip Codes with the Highest Poverty Level Among Children Under the Age of 5 in Pittsburgh, PA
RELATED REPORTS & OPTIONS
Highest Poverty | Child 0-5
Pittsburgh
Compare Zip Codes
Map of Zip Codes with the Highest Poverty Level Among Children Under the Age of 5 in Pittsburgh
0.81%
46.8%
Zip Codes with the Highest Poverty Level Among Children Under the Age of 5 in Pittsburgh, PA
| Zip Code | Child Poverty | vs State | vs National | |
| 1. | 15213 | 46.8% | 17.3%(+29.6)#116 | 18.1%(+28.8)#2,936 |
| 2. | 15219 | 46.8% | 17.3%(+29.6)#117 | 18.1%(+28.8)#2,943 |
| 3. | 15208 | 41.2% | 17.3%(+23.9)#157 | 18.1%(+23.1)#3,800 |
| 4. | 15214 | 36.1% | 17.3%(+18.9)#201 | 18.1%(+18.1)#4,797 |
| 5. | 15218 | 35.6% | 17.3%(+18.4)#209 | 18.1%(+17.6)#4,920 |
| 6. | 15212 | 34.1% | 17.3%(+16.9)#227 | 18.1%(+16.1)#5,262 |
| 7. | 15203 | 33.8% | 17.3%(+16.6)#230 | 18.1%(+15.8)#5,332 |
| 8. | 15235 | 31.6% | 17.3%(+14.3)#272 | 18.1%(+13.5)#5,931 |
| 9. | 15207 | 30.9% | 17.3%(+13.7)#280 | 18.1%(+12.8)#6,118 |
| 10. | 15204 | 29.5% | 17.3%(+12.2)#295 | 18.1%(+11.4)#6,502 |
| 11. | 15210 | 27.6% | 17.3%(+10.3)#330 | 18.1%(+9.53)#7,096 |
| 12. | 15233 | 26.6% | 17.3%(+9.33)#343 | 18.1%(+8.53)#7,442 |
| 13. | 15221 | 25.9% | 17.3%(+8.64)#353 | 18.1%(+7.83)#7,675 |
| 14. | 15227 | 22.0% | 17.3%(+4.70)#420 | 18.1%(+3.90)#9,204 |
| 15. | 15205 | 18.2% | 17.3%(+0.921)#498 | 18.1%(+0.119)#10,851 |
| 16. | 15224 | 15.6% | 17.3%(-1.71)#574 | 18.1%(-2.51)#12,148 |
| 17. | 15216 | 15.4% | 17.3%(-1.84)#578 | 18.1%(-2.65)#12,211 |
| 18. | 15217 | 13.8% | 17.3%(-3.50)#627 | 18.1%(-4.30)#13,184 |
| 19. | 15229 | 12.0% | 17.3%(-5.27)#685 | 18.1%(-6.07)#14,226 |
| 20. | 15236 | 10.5% | 17.3%(-6.77)#729 | 18.1%(-7.58)#15,124 |
| 21. | 15211 | 10.3% | 17.3%(-7.01)#737 | 18.1%(-7.81)#15,265 |
| 22. | 15215 | 9.3% | 17.3%(-8.00)#767 | 18.1%(-8.81)#15,884 |
| 23. | 15206 | 9.2% | 17.3%(-8.08)#769 | 18.1%(-8.88)#15,934 |
| 24. | 15226 | 7.6% | 17.3%(-9.65)#829 | 18.1%(-10.5)#16,997 |
| 25. | 15228 | 6.3% | 17.3%(-11.0)#870 | 18.1%(-11.8)#17,844 |
| 26. | 15220 | 6.1% | 17.3%(-11.2)#882 | 18.1%(-12.0)#18,017 |
| 27. | 15234 | 6.0% | 17.3%(-11.3)#885 | 18.1%(-12.1)#18,086 |
| 28. | 15201 | 5.0% | 17.3%(-12.2)#930 | 18.1%(-13.0)#18,742 |
| 29. | 15223 | 4.7% | 17.3%(-12.6)#941 | 18.1%(-13.4)#18,993 |
| 30. | 15237 | 2.6% | 17.3%(-14.7)#1,020 | 18.1%(-15.5)#20,462 |
| 31. | 15238 | 2.5% | 17.3%(-14.8)#1,027 | 18.1%(-15.6)#20,535 |
| 32. | 15202 | 0.81% | 17.3%(-16.4)#1,087 | 18.1%(-17.3)#21,493 |
1
Common Questions
What are the Top 10 Zip Codes with the Highest Poverty Level Among Children Under the Age of 5 in Pittsburgh, PA?
Top 10 Zip Codes with the Highest Poverty Level Among Children Under the Age of 5 in Pittsburgh, PA are:
What zip code has the Highest Poverty Level Among Children Under the Age of 5 in Pittsburgh, PA?
15213 has the Highest Poverty Level Among Children Under the Age of 5 in Pittsburgh, PA with 46.8%.
What is the Poverty Level Among Children Under the Age of 5 in Pittsburgh, PA?
Poverty Level Among Children Under the Age of 5 in Pittsburgh is 27.3%.
What is the Poverty Level Among Children Under the Age of 5 in Pennsylvania?
Poverty Level Among Children Under the Age of 5 in Pennsylvania is 17.3%.
What is the Poverty Level Among Children Under the Age of 5 in the United States?
Poverty Level Among Children Under the Age of 5 in the United States is 18.1%.