Zip Codes with the Highest Percentage of Households with Income Below $10,000 in Harrisburg, PA

RELATED REPORTS & OPTIONS

Household Income | $0-10k
Population
Families and Households
Female Fertility
Female Fertility (Unmarried)
Race (Community Size)
Race (Percentage)
Ancestry (Community Size)
AfricanAlbanianAmericanArabArgentineanArmenianAustrianBelgianBhutaneseBlackfeetBrazilianBritishBurmeseCanadianCarpatho RusynCelticCentral AmericanCentral American IndianCherokeeChileanColombianCroatianCubanCzechCzechoslovakianDanishDominicanDutchEastern EuropeanEcuadorianEgyptianEnglishEuropeanFinnishFrenchFrench CanadianGermanGreekGuamanian / ChamorroGuatemalanGuyaneseHaitianHonduranHungarianIndian (Asian)InupiatIrishIsraeliItalianJamaicanJapaneseKenyanKoreanLaotianLebaneseLithuanianLumbeeMacedonianMexicanMexican American IndianMoroccanNative HawaiianNicaraguanNigerianNorthern EuropeanNorwegianPakistaniPalestinianPanamanianPennsylvania GermanPeruvianPolishPortuguesePuerto RicanRomanianRussianSalvadoranScandinavianScotch-IrishScottishSerbianSlavicSlovakSloveneSouth AmericanSouth American IndianSpaniardSpanishSri LankanSubsaharan AfricanSwedishSwissSyrianThaiTrinidadian and TobagonianUkrainianVenezuelanVietnameseWelshWest IndianYugoslavian
Ancestry (Percentage)
AfricanAlbanianAmericanArabArgentineanArmenianAustrianBelgianBhutaneseBlackfeetBrazilianBritishBurmeseCanadianCarpatho RusynCelticCentral AmericanCentral American IndianCherokeeChileanColombianCroatianCubanCzechCzechoslovakianDanishDominicanDutchEastern EuropeanEcuadorianEgyptianEnglishEuropeanFinnishFrenchFrench CanadianGermanGreekGuamanian / ChamorroGuatemalanGuyaneseHaitianHonduranHungarianIndian (Asian)InupiatIrishIsraeliItalianJamaicanJapaneseKenyanKoreanLaotianLebaneseLithuanianLumbeeMacedonianMexicanMexican American IndianMoroccanNative HawaiianNicaraguanNigerianNorthern EuropeanNorwegianPakistaniPalestinianPanamanianPennsylvania GermanPeruvianPolishPortuguesePuerto RicanRomanianRussianSalvadoranScandinavianScotch-IrishScottishSerbianSlavicSlovakSloveneSouth AmericanSouth American IndianSpaniardSpanishSri LankanSubsaharan AfricanSwedishSwissSyrianThaiTrinidadian and TobagonianUkrainianVenezuelanVietnameseWelshWest IndianYugoslavian
Immigrant Origin (Total)
Immigrant Origin (Percentage)
Income
Income (Families)
Income (Households)
Poverty
Poverty (Families)
Unemployment
Employment Occupations
Employment Industries
Employer Class
Commute Time
Commute Means
School Enrollment
Education by Degree Field
Occupancy
Finances
Physical Characteristics
Harrisburg
Compare Zip Codes
Comparison Subject

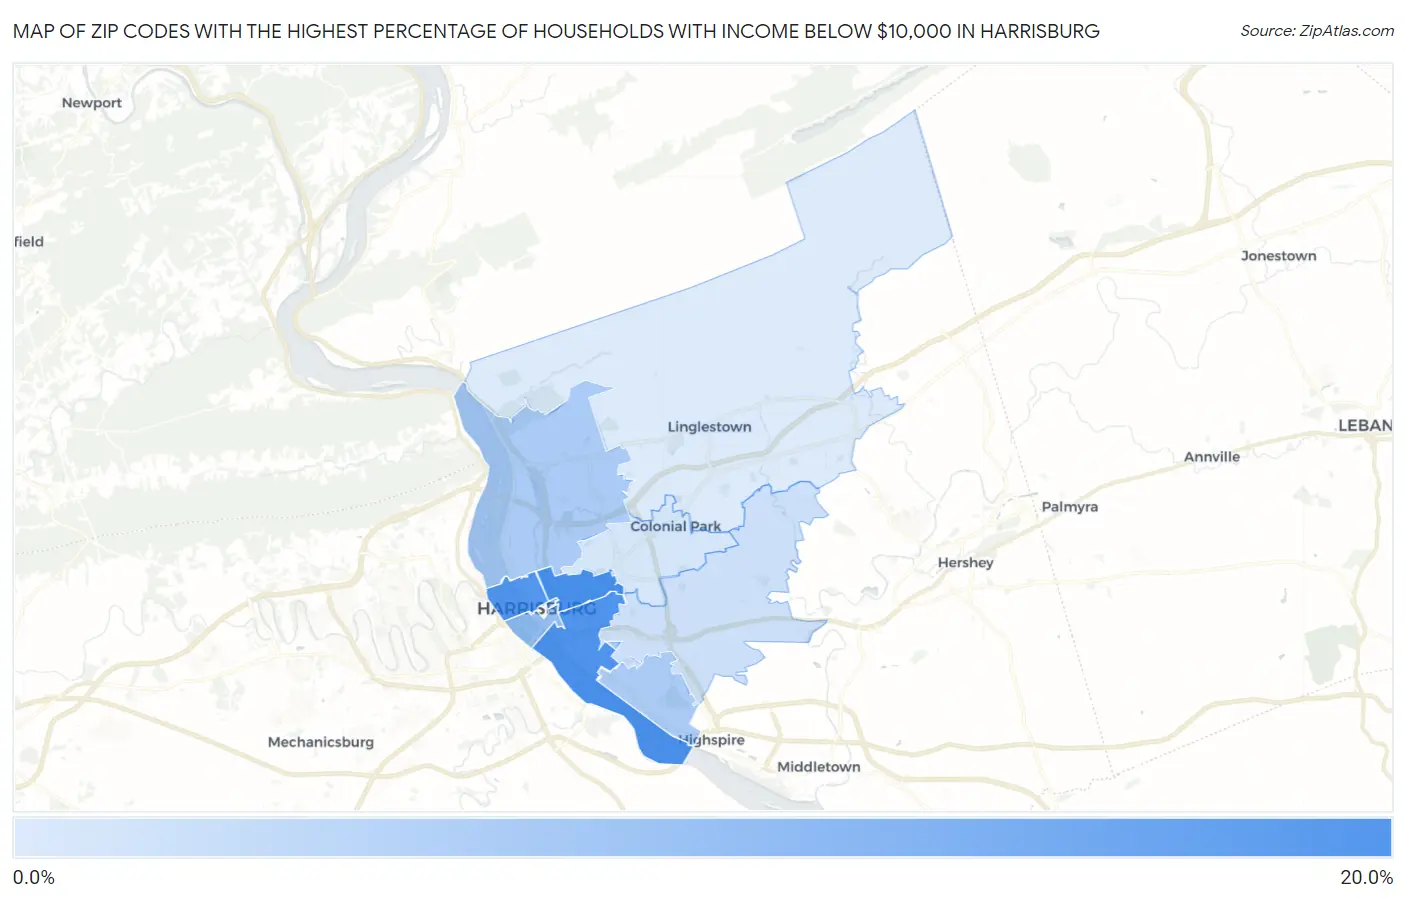
Map of Zip Codes with the Highest Percentage of Households with Income Below $10,000 in Harrisburg

0.0%
20.0%
Zip Codes with the Highest Percentage of Households with Income Below $10,000 in Harrisburg Map

Zip Codes with the Highest Percentage of Households with Income Below $10,000 in Harrisburg, PA

Zip Code Households with Income < $10k vs State vs National
1.1710315.9%4.8%(+11.1)#464.9%(+11.0)#1,356
2.1710415.2%4.8%(+10.4)#514.9%(+10.3)#1,477
3.1710214.9%4.8%(+10.1)#564.9%(+10.00)#1,544
4.171018.7%4.8%(+3.90)#1794.9%(+3.80)#4,773
5.171106.8%4.8%(+2.00)#2734.9%(+1.90)#7,331
6.171136.8%4.8%(+2.00)#2794.9%(+1.90)#7,371
7.171113.8%4.8%(-1.00)#6984.9%(-1.10)#15,998
8.171092.9%4.8%(-1.90)#9394.9%(-2.00)#19,844
9.171122.4%4.8%(-2.40)#1,0674.9%(-2.50)#22,006

Common Questions

What are the Top 5 Zip Codes with the Highest Percentage of Households with Income Below $10,000 in Harrisburg, PA?
Top 5 Zip Codes with the Highest Percentage of Households with Income Below $10,000 in Harrisburg, PA are:
#1
15.9%
#2
15.2%
#3
14.9%
#4
8.7%
#5
6.8%
What zip code has the Highest Percentage of Households with Income Below $10,000 in Harrisburg, PA?
17103 has the Highest Percentage of Households with Income Below $10,000 in Harrisburg, PA with 15.9%.
What is the Percentage of Households with Income Below $10,000 in Harrisburg, PA?
Percentage of Households with Income Below $10,000 in Harrisburg is 13.7%.
What is the Percentage of Households with Income Below $10,000 in Pennsylvania?
Percentage of Households with Income Below $10,000 in Pennsylvania is 4.8%.
What is the Percentage of Households with Income Below $10,000 in the United States?
Percentage of Households with Income Below $10,000 in the United States is 4.9%.