Zip Codes with the Highest Percentage of Population Employed in Architecture & Engineering in Pittsburgh, PA
RELATED REPORTS & OPTIONS
Architecture & Engineering
Pittsburgh
Compare Zip Codes
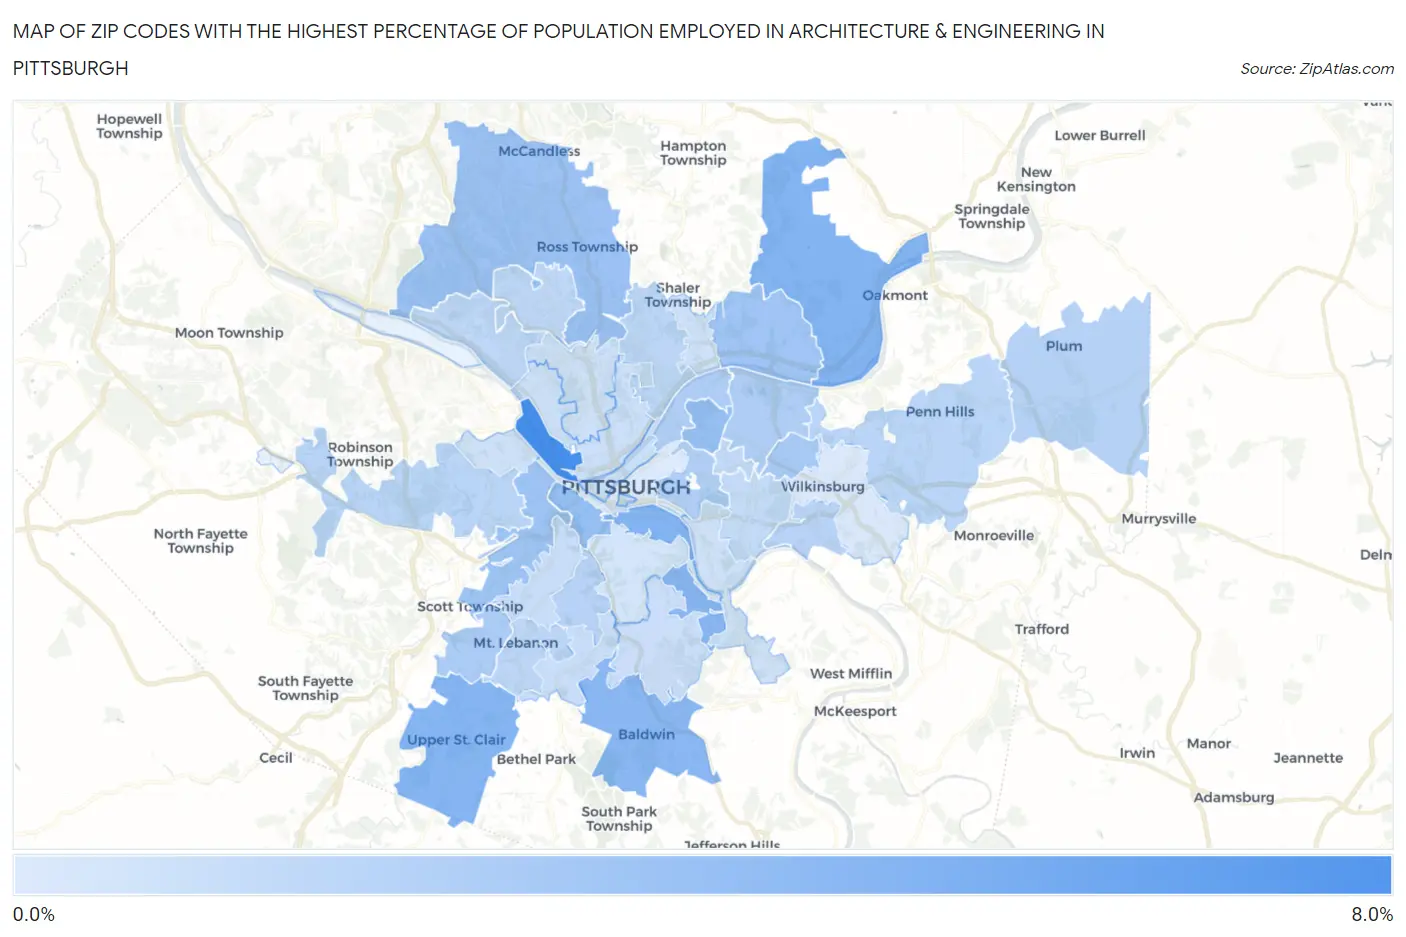
Map of Zip Codes with the Highest Percentage of Population Employed in Architecture & Engineering in Pittsburgh
0.80%
7.9%
Zip Codes with the Highest Percentage of Population Employed in Architecture & Engineering in Pittsburgh, PA
| Zip Code | % Employed | vs State | vs National | |
| 1. | 15233 | 7.9% | 2.0%(+5.81)#24 | 2.1%(+5.70)#594 |
| 2. | 15203 | 5.0% | 2.0%(+2.96)#66 | 2.1%(+2.85)#1,663 |
| 3. | 15238 | 4.9% | 2.0%(+2.90)#70 | 2.1%(+2.79)#1,702 |
| 4. | 15241 | 4.8% | 2.0%(+2.78)#81 | 2.1%(+2.67)#1,814 |
| 5. | 15236 | 4.6% | 2.0%(+2.56)#91 | 2.1%(+2.45)#2,020 |
| 6. | 15224 | 4.1% | 2.0%(+2.08)#118 | 2.1%(+1.97)#2,590 |
| 7. | 15211 | 4.1% | 2.0%(+2.04)#122 | 2.1%(+1.93)#2,645 |
| 8. | 15237 | 3.8% | 2.0%(+1.79)#136 | 2.1%(+1.69)#3,030 |
| 9. | 15220 | 3.6% | 2.0%(+1.61)#158 | 2.1%(+1.50)#3,408 |
| 10. | 15215 | 3.5% | 2.0%(+1.47)#182 | 2.1%(+1.36)#3,706 |
| 11. | 15208 | 3.2% | 2.0%(+1.17)#225 | 2.1%(+1.06)#4,429 |
| 12. | 15243 | 3.1% | 2.0%(+1.04)#258 | 2.1%(+0.928)#4,796 |
| 13. | 15201 | 2.9% | 2.0%(+0.899)#285 | 2.1%(+0.791)#5,277 |
| 14. | 15206 | 2.9% | 2.0%(+0.837)#295 | 2.1%(+0.728)#5,506 |
| 15. | 15213 | 2.8% | 2.0%(+0.739)#323 | 2.1%(+0.631)#5,864 |
| 16. | 15239 | 2.6% | 2.0%(+0.600)#347 | 2.1%(+0.492)#6,404 |
| 17. | 15226 | 2.5% | 2.0%(+0.503)#376 | 2.1%(+0.395)#6,820 |
| 18. | 15218 | 2.5% | 2.0%(+0.478)#382 | 2.1%(+0.370)#6,917 |
| 19. | 15205 | 2.4% | 2.0%(+0.390)#414 | 2.1%(+0.282)#7,330 |
| 20. | 15235 | 2.4% | 2.0%(+0.309)#432 | 2.1%(+0.201)#7,715 |
| 21. | 15228 | 2.3% | 2.0%(+0.269)#443 | 2.1%(+0.161)#7,891 |
| 22. | 15209 | 2.3% | 2.0%(+0.247)#449 | 2.1%(+0.139)#8,012 |
| 23. | 15229 | 2.2% | 2.0%(+0.163)#472 | 2.1%(+0.054)#8,461 |
| 24. | 15202 | 2.2% | 2.0%(+0.133)#482 | 2.1%(+0.025)#8,631 |
| 25. | 15232 | 2.1% | 2.0%(+0.076)#505 | 2.1%(-0.033)#8,939 |
| 26. | 15217 | 2.0% | 2.0%(-0.070)#556 | 2.1%(-0.178)#9,792 |
| 27. | 15216 | 1.8% | 2.0%(-0.272)#628 | 2.1%(-0.380)#11,014 |
| 28. | 15234 | 1.8% | 2.0%(-0.282)#632 | 2.1%(-0.390)#11,078 |
| 29. | 15282 | 1.7% | 2.0%(-0.343)#664 | 2.1%(-0.451)#11,505 |
| 30. | 15227 | 1.6% | 2.0%(-0.394)#687 | 2.1%(-0.502)#11,853 |
| 31. | 15222 | 1.5% | 2.0%(-0.524)#747 | 2.1%(-0.632)#12,759 |
| 32. | 15212 | 1.5% | 2.0%(-0.537)#751 | 2.1%(-0.645)#12,851 |
| 33. | 15223 | 1.5% | 2.0%(-0.567)#765 | 2.1%(-0.675)#13,061 |
| 34. | 15214 | 1.4% | 2.0%(-0.596)#772 | 2.1%(-0.704)#13,262 |
| 35. | 15207 | 1.4% | 2.0%(-0.620)#784 | 2.1%(-0.728)#13,426 |
| 36. | 15204 | 1.4% | 2.0%(-0.642)#793 | 2.1%(-0.750)#13,591 |
| 37. | 15210 | 1.2% | 2.0%(-0.805)#868 | 2.1%(-0.913)#14,790 |
| 38. | 15221 | 0.94% | 2.0%(-1.10)#986 | 2.1%(-1.21)#17,036 |
| 39. | 15219 | 0.80% | 2.0%(-1.24)#1,040 | 2.1%(-1.35)#18,118 |
1
Common Questions
What are the Top 10 Zip Codes with the Highest Percentage of Population Employed in Architecture & Engineering in Pittsburgh, PA?
Top 10 Zip Codes with the Highest Percentage of Population Employed in Architecture & Engineering in Pittsburgh, PA are:
What zip code has the Highest Percentage of Population Employed in Architecture & Engineering in Pittsburgh, PA?
15233 has the Highest Percentage of Population Employed in Architecture & Engineering in Pittsburgh, PA with 7.9%.
What is the Percentage of Population Employed in Architecture & Engineering in Pittsburgh, PA?
Percentage of Population Employed in Architecture & Engineering in Pittsburgh is 2.4%.
What is the Percentage of Population Employed in Architecture & Engineering in Pennsylvania?
Percentage of Population Employed in Architecture & Engineering in Pennsylvania is 2.0%.
What is the Percentage of Population Employed in Architecture & Engineering in the United States?
Percentage of Population Employed in Architecture & Engineering in the United States is 2.1%.