Zip Codes with the Highest Percentage of Population with a Degree in Engineering in Pittsburgh, PA
RELATED REPORTS & OPTIONS
Engineering
Pittsburgh
Compare Zip Codes
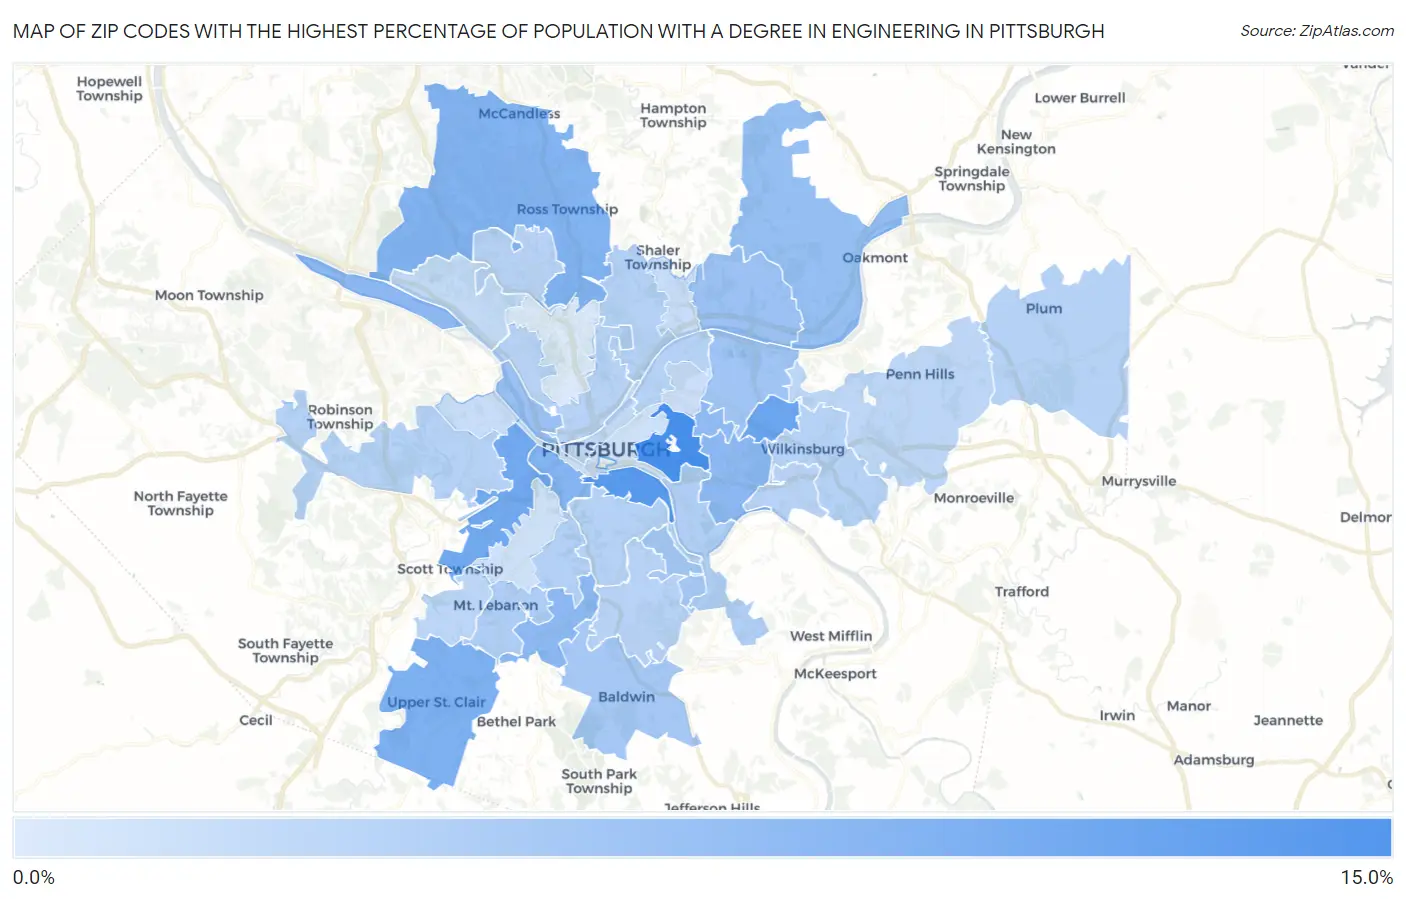
Map of Zip Codes with the Highest Percentage of Population with a Degree in Engineering in Pittsburgh
3.4%
14.5%
Zip Codes with the Highest Percentage of Population with a Degree in Engineering in Pittsburgh, PA
| Zip Code | % Graduates | vs State | vs National | |
| 1. | 15213 | 14.5% | 6.7%(+7.76)#80 | 7.6%(+6.85)#1,869 |
| 2. | 15203 | 13.3% | 6.7%(+6.55)#101 | 7.6%(+5.64)#2,306 |
| 3. | 15208 | 11.7% | 6.7%(+4.99)#136 | 7.6%(+4.08)#3,038 |
| 4. | 15220 | 11.2% | 6.7%(+4.48)#163 | 7.6%(+3.57)#3,385 |
| 5. | 15241 | 10.3% | 6.7%(+3.52)#193 | 7.6%(+2.62)#4,207 |
| 6. | 15237 | 9.9% | 6.7%(+3.13)#210 | 7.6%(+2.23)#4,557 |
| 7. | 15211 | 9.8% | 6.7%(+3.08)#213 | 7.6%(+2.17)#4,613 |
| 8. | 15225 | 9.3% | 6.7%(+2.55)#238 | 7.6%(+1.64)#5,217 |
| 9. | 15234 | 9.2% | 6.7%(+2.46)#245 | 7.6%(+1.55)#5,314 |
| 10. | 15217 | 9.2% | 6.7%(+2.45)#247 | 7.6%(+1.54)#5,323 |
| 11. | 15232 | 9.0% | 6.7%(+2.22)#261 | 7.6%(+1.31)#5,671 |
| 12. | 15238 | 8.5% | 6.7%(+1.74)#298 | 7.6%(+0.829)#6,312 |
| 13. | 15215 | 8.2% | 6.7%(+1.46)#323 | 7.6%(+0.549)#6,749 |
| 14. | 15233 | 8.2% | 6.7%(+1.45)#325 | 7.6%(+0.542)#6,773 |
| 15. | 15206 | 7.7% | 6.7%(+0.993)#369 | 7.6%(+0.084)#7,565 |
| 16. | 15236 | 7.4% | 6.7%(+0.666)#409 | 7.6%(-0.243)#8,198 |
| 17. | 15228 | 6.7% | 6.7%(-0.057)#486 | 7.6%(-0.966)#9,658 |
| 18. | 15207 | 6.5% | 6.7%(-0.216)#502 | 7.6%(-1.12)#9,964 |
| 19. | 15226 | 6.4% | 6.7%(-0.364)#520 | 7.6%(-1.27)#10,291 |
| 20. | 15201 | 6.3% | 6.7%(-0.454)#530 | 7.6%(-1.36)#10,502 |
| 21. | 15239 | 6.3% | 6.7%(-0.458)#531 | 7.6%(-1.37)#10,509 |
| 22. | 15209 | 6.3% | 6.7%(-0.475)#534 | 7.6%(-1.38)#10,550 |
| 23. | 15210 | 6.2% | 6.7%(-0.517)#542 | 7.6%(-1.43)#10,652 |
| 24. | 15221 | 6.2% | 6.7%(-0.546)#543 | 7.6%(-1.45)#10,725 |
| 25. | 15205 | 6.1% | 6.7%(-0.608)#552 | 7.6%(-1.52)#10,875 |
| 26. | 15227 | 6.1% | 6.7%(-0.650)#560 | 7.6%(-1.56)#10,980 |
| 27. | 15218 | 6.1% | 6.7%(-0.677)#564 | 7.6%(-1.59)#11,033 |
| 28. | 15229 | 6.0% | 6.7%(-0.705)#570 | 7.6%(-1.61)#11,109 |
| 29. | 15212 | 6.0% | 6.7%(-0.749)#577 | 7.6%(-1.66)#11,216 |
| 30. | 15243 | 5.8% | 6.7%(-0.965)#603 | 7.6%(-1.87)#11,757 |
| 31. | 15235 | 5.7% | 6.7%(-1.08)#625 | 7.6%(-1.98)#12,038 |
| 32. | 15222 | 5.3% | 6.7%(-1.40)#672 | 7.6%(-2.31)#12,829 |
| 33. | 15202 | 5.2% | 6.7%(-1.56)#686 | 7.6%(-2.47)#13,246 |
| 34. | 15204 | 4.9% | 6.7%(-1.79)#718 | 7.6%(-2.70)#13,839 |
| 35. | 15223 | 4.8% | 6.7%(-1.90)#735 | 7.6%(-2.81)#14,162 |
| 36. | 15224 | 4.7% | 6.7%(-2.07)#756 | 7.6%(-2.98)#14,615 |
| 37. | 15219 | 4.4% | 6.7%(-2.30)#787 | 7.6%(-3.21)#15,232 |
| 38. | 15216 | 4.4% | 6.7%(-2.34)#793 | 7.6%(-3.25)#15,317 |
| 39. | 15214 | 3.4% | 6.7%(-3.32)#946 | 7.6%(-4.23)#17,847 |
1
Common Questions
What are the Top 10 Zip Codes with the Highest Percentage of Population with a Degree in Engineering in Pittsburgh, PA?
Top 10 Zip Codes with the Highest Percentage of Population with a Degree in Engineering in Pittsburgh, PA are:
What zip code has the Highest Percentage of Population with a Degree in Engineering in Pittsburgh, PA?
15213 has the Highest Percentage of Population with a Degree in Engineering in Pittsburgh, PA with 14.5%.
What is the Percentage of Population with a Degree in Engineering in Pittsburgh, PA?
Percentage of Population with a Degree in Engineering in Pittsburgh is 7.9%.
What is the Percentage of Population with a Degree in Engineering in Pennsylvania?
Percentage of Population with a Degree in Engineering in Pennsylvania is 6.7%.
What is the Percentage of Population with a Degree in Engineering in the United States?
Percentage of Population with a Degree in Engineering in the United States is 7.6%.