Zip Codes with the Highest Percentage of Population Employed in Arts, Media & Entertainment in Pittsburgh, PA
RELATED REPORTS & OPTIONS
Arts, Media & Entertainment
Pittsburgh
Compare Zip Codes
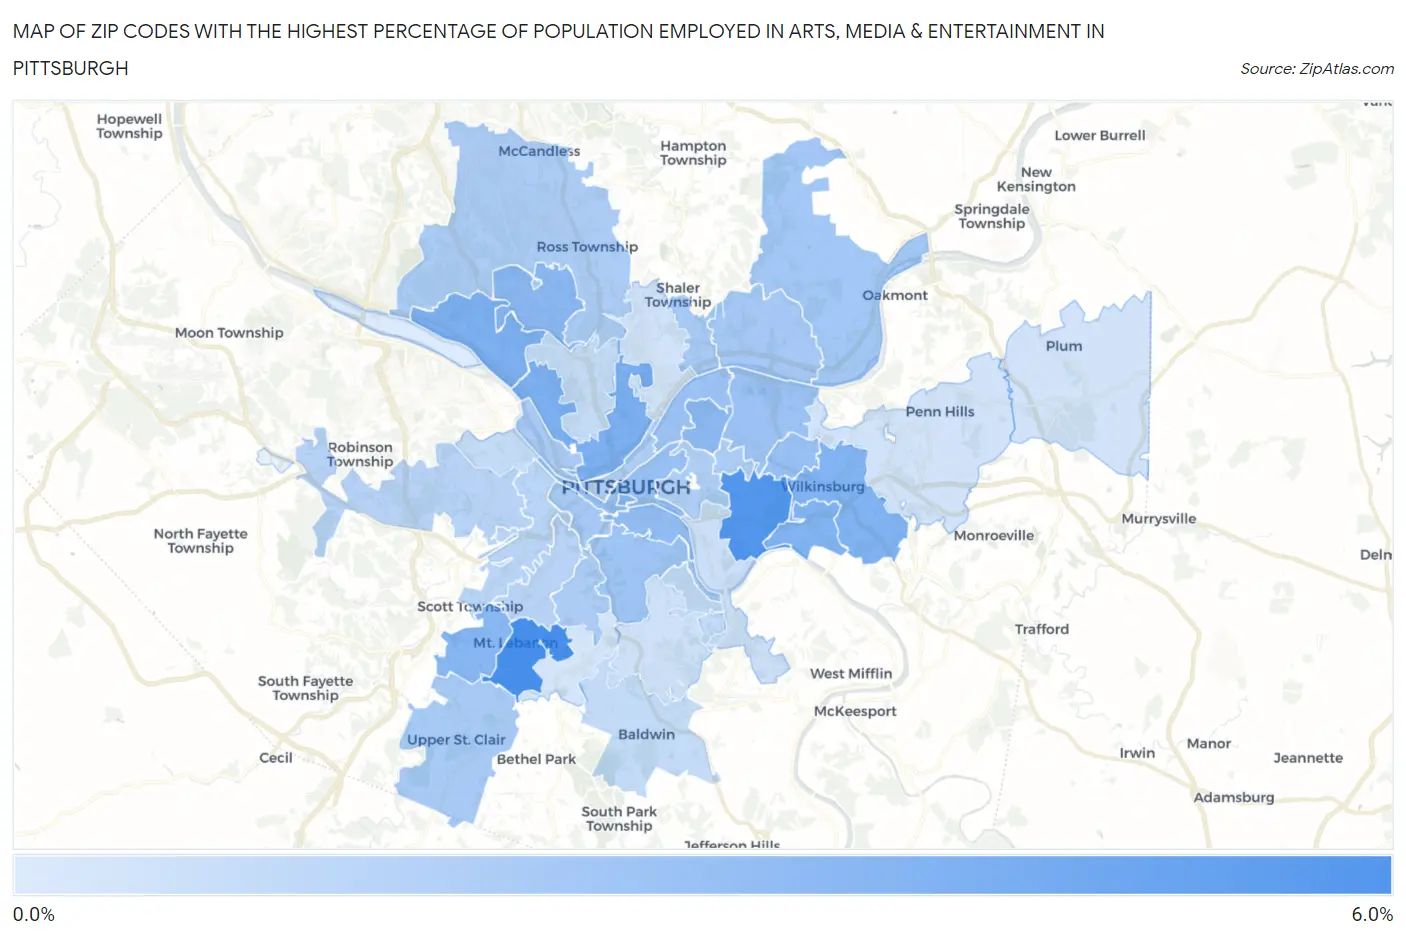
Map of Zip Codes with the Highest Percentage of Population Employed in Arts, Media & Entertainment in Pittsburgh
1.0%
5.4%
Zip Codes with the Highest Percentage of Population Employed in Arts, Media & Entertainment in Pittsburgh, PA
| Zip Code | % Employed | vs State | vs National | |
| 1. | 15228 | 5.4% | 1.8%(+3.64)#52 | 2.1%(+3.33)#1,307 |
| 2. | 15217 | 5.0% | 1.8%(+3.28)#56 | 2.1%(+2.98)#1,478 |
| 3. | 15212 | 3.8% | 1.8%(+2.04)#95 | 2.1%(+1.73)#2,633 |
| 4. | 15202 | 3.7% | 1.8%(+1.99)#100 | 2.1%(+1.68)#2,706 |
| 5. | 15221 | 3.7% | 1.8%(+1.93)#107 | 2.1%(+1.62)#2,793 |
| 6. | 15218 | 3.7% | 1.8%(+1.91)#108 | 2.1%(+1.60)#2,815 |
| 7. | 15282 | 3.6% | 1.8%(+1.82)#112 | 2.1%(+1.52)#2,949 |
| 8. | 15243 | 3.5% | 1.8%(+1.70)#123 | 2.1%(+1.39)#3,121 |
| 9. | 15229 | 3.4% | 1.8%(+1.67)#125 | 2.1%(+1.36)#3,197 |
| 10. | 15224 | 3.3% | 1.8%(+1.58)#131 | 2.1%(+1.27)#3,379 |
| 11. | 15203 | 3.2% | 1.8%(+1.45)#140 | 2.1%(+1.15)#3,600 |
| 12. | 15208 | 3.0% | 1.8%(+1.25)#158 | 2.1%(+0.945)#4,060 |
| 13. | 15219 | 3.0% | 1.8%(+1.23)#160 | 2.1%(+0.926)#4,120 |
| 14. | 15201 | 2.9% | 1.8%(+1.18)#168 | 2.1%(+0.868)#4,266 |
| 15. | 15206 | 2.9% | 1.8%(+1.12)#176 | 2.1%(+0.811)#4,423 |
| 16. | 15210 | 2.8% | 1.8%(+1.05)#184 | 2.1%(+0.742)#4,611 |
| 17. | 15238 | 2.7% | 1.8%(+0.919)#198 | 2.1%(+0.612)#4,988 |
| 18. | 15211 | 2.6% | 1.8%(+0.877)#204 | 2.1%(+0.570)#5,141 |
| 19. | 15215 | 2.6% | 1.8%(+0.860)#208 | 2.1%(+0.552)#5,182 |
| 20. | 15223 | 2.6% | 1.8%(+0.806)#215 | 2.1%(+0.498)#5,368 |
| 21. | 15241 | 2.5% | 1.8%(+0.791)#221 | 2.1%(+0.484)#5,413 |
| 22. | 15233 | 2.5% | 1.8%(+0.720)#236 | 2.1%(+0.413)#5,639 |
| 23. | 15232 | 2.4% | 1.8%(+0.673)#247 | 2.1%(+0.366)#5,833 |
| 24. | 15226 | 2.4% | 1.8%(+0.661)#251 | 2.1%(+0.354)#5,885 |
| 25. | 15237 | 2.4% | 1.8%(+0.657)#253 | 2.1%(+0.349)#5,900 |
| 26. | 15222 | 2.4% | 1.8%(+0.606)#263 | 2.1%(+0.299)#6,087 |
| 27. | 15213 | 2.3% | 1.8%(+0.578)#267 | 2.1%(+0.270)#6,236 |
| 28. | 15216 | 2.1% | 1.8%(+0.307)#340 | 2.1%(-0.001)#7,489 |
| 29. | 15205 | 2.0% | 1.8%(+0.289)#349 | 2.1%(-0.019)#7,585 |
| 30. | 15220 | 2.0% | 1.8%(+0.217)#372 | 2.1%(-0.090)#7,976 |
| 31. | 15236 | 1.8% | 1.8%(+0.008)#430 | 2.1%(-0.299)#9,198 |
| 32. | 15214 | 1.7% | 1.8%(-0.065)#452 | 2.1%(-0.372)#9,714 |
| 33. | 15204 | 1.7% | 1.8%(-0.074)#457 | 2.1%(-0.382)#9,781 |
| 34. | 15207 | 1.5% | 1.8%(-0.288)#535 | 2.1%(-0.596)#11,222 |
| 35. | 15227 | 1.4% | 1.8%(-0.385)#583 | 2.1%(-0.692)#11,927 |
| 36. | 15209 | 1.3% | 1.8%(-0.415)#602 | 2.1%(-0.723)#12,174 |
| 37. | 15235 | 1.3% | 1.8%(-0.448)#615 | 2.1%(-0.755)#12,411 |
| 38. | 15239 | 1.3% | 1.8%(-0.455)#620 | 2.1%(-0.762)#12,469 |
| 39. | 15234 | 1.3% | 1.8%(-0.462)#623 | 2.1%(-0.769)#12,512 |
| 40. | 15225 | 1.0% | 1.8%(-0.753)#760 | 2.1%(-1.06)#14,803 |
1
Common Questions
What are the Top 10 Zip Codes with the Highest Percentage of Population Employed in Arts, Media & Entertainment in Pittsburgh, PA?
Top 10 Zip Codes with the Highest Percentage of Population Employed in Arts, Media & Entertainment in Pittsburgh, PA are:
What zip code has the Highest Percentage of Population Employed in Arts, Media & Entertainment in Pittsburgh, PA?
15228 has the Highest Percentage of Population Employed in Arts, Media & Entertainment in Pittsburgh, PA with 5.4%.
What is the Percentage of Population Employed in Arts, Media & Entertainment in Pittsburgh, PA?
Percentage of Population Employed in Arts, Media & Entertainment in Pittsburgh is 3.0%.
What is the Percentage of Population Employed in Arts, Media & Entertainment in Pennsylvania?
Percentage of Population Employed in Arts, Media & Entertainment in Pennsylvania is 1.8%.
What is the Percentage of Population Employed in Arts, Media & Entertainment in the United States?
Percentage of Population Employed in Arts, Media & Entertainment in the United States is 2.1%.