Zip Codes with the Highest Percentage of Population with a Degree in Arts and Humanities in Pittsburgh, PA

RELATED REPORTS & OPTIONS

Arts and Humanities
Population
Families and Households
Female Fertility
Female Fertility (Unmarried)
Race (Community Size)
Race (Percentage)
Ancestry (Community Size)
AfghanAfricanAlbanianAlsatianAmericanApacheArabArgentineanArmenianAustralianAustrianBahamianBarbadianBasqueBelgianBhutaneseBlackfeetBolivianBrazilianBritishBritish West IndianBulgarianBurmeseCajunCambodianCanadianCape VerdeanCarpatho RusynCelticCentral AmericanCentral American IndianCherokeeChickasawChileanChippewaChoctawColombianComancheCosta RicanCreekCroatianCubanCypriotCzechCzechoslovakianDanishDelawareDominicanDutchEastern EuropeanEcuadorianEgyptianEnglishEthiopianEuropeanFilipinoFinnishFrenchFrench American IndianFrench CanadianGermanGhanaianGreekGuamanian / ChamorroGuatemalanGuyaneseHaitianHonduranHungarianIndian (Asian)IndonesianIranianIraqiIrishIroquoisIsraeliItalianJamaicanJapaneseJordanianKenyanKoreanLaotianLatvianLebaneseLiberianLithuanianLumbeeLuxembourgerMacedonianMalaysianMalteseMexicanMexican American IndianMongolianMoroccanNative HawaiianNavajoNew ZealanderNicaraguanNigerianNorthern EuropeanNorwegianPakistaniPalestinianPanamanianParaguayanPennsylvania GermanPeruvianPolishPortuguesePuerto RicanRomanianRussianSalvadoranSamoanScandinavianScotch-IrishScottishSeminoleSerbianSiouxSlavicSlovakSloveneSouth AfricanSouth AmericanSouth American IndianSoviet UnionSpaniardSpanishSri LankanSubsaharan AfricanSudaneseSwedishSwissSyrianThaiTrinidadian and TobagonianTurkishU.S. Virgin IslanderUgandanUkrainianUruguayanVenezuelanVietnameseWelshWest IndianYugoslavian
Ancestry (Percentage)
AfghanAfricanAlbanianAlsatianAmericanApacheArabArgentineanArmenianAustralianAustrianBahamianBarbadianBasqueBelgianBhutaneseBlackfeetBolivianBrazilianBritishBritish West IndianBulgarianBurmeseCajunCambodianCanadianCape VerdeanCarpatho RusynCelticCentral AmericanCentral American IndianCherokeeChickasawChileanChippewaChoctawColombianComancheCosta RicanCreekCroatianCubanCypriotCzechCzechoslovakianDanishDelawareDominicanDutchEastern EuropeanEcuadorianEgyptianEnglishEthiopianEuropeanFilipinoFinnishFrenchFrench American IndianFrench CanadianGermanGhanaianGreekGuamanian / ChamorroGuatemalanGuyaneseHaitianHonduranHungarianIndian (Asian)IndonesianIranianIraqiIrishIroquoisIsraeliItalianJamaicanJapaneseJordanianKenyanKoreanLaotianLatvianLebaneseLiberianLithuanianLumbeeLuxembourgerMacedonianMalaysianMalteseMexicanMexican American IndianMongolianMoroccanNative HawaiianNavajoNew ZealanderNicaraguanNigerianNorthern EuropeanNorwegianPakistaniPalestinianPanamanianParaguayanPennsylvania GermanPeruvianPolishPortuguesePuerto RicanRomanianRussianSalvadoranSamoanScandinavianScotch-IrishScottishSeminoleSerbianSiouxSlavicSlovakSloveneSouth AfricanSouth AmericanSouth American IndianSoviet UnionSpaniardSpanishSri LankanSubsaharan AfricanSudaneseSwedishSwissSyrianThaiTrinidadian and TobagonianTurkishU.S. Virgin IslanderUgandanUkrainianUruguayanVenezuelanVietnameseWelshWest IndianYugoslavian
Immigrant Origin (Total)
AfghanistanAfricaAlbaniaArgentinaAsiaAustraliaAustriaBahamasBangladeshBelarusBelgiumBoliviaBosnia and HerzegovinaBrazilBulgariaBurma / MyanmarCambodiaCameroonCanadaCaribbeanCentral AmericaChileChinaColombiaCongoCosta RicaCroatiaCubaCzechoslovakiaDenmarkDominican RepublicEastern AfricaEastern AsiaEastern EuropeEcuadorEgyptEl SalvadorEnglandEritreaEthiopiaEuropeFranceGermanyGhanaGreeceGuatemalaGuyanaHaitiHondurasHong KongHungaryIndiaIndonesiaIranIraqIrelandIsraelItalyJamaicaJapanJordanKazakhstanKenyaKoreaKuwaitLatin AmericaLatviaLebanonLiberiaLithuaniaMalaysiaMexicoMiddle AfricaMoldovaMoroccoNepalNetherlandsNigeriaNorthern AfricaNorthern EuropeNorwayOceaniaPakistanPanamaPeruPhilippinesPolandPortugalRomaniaRussiaSaudi ArabiaScotlandSerbiaSingaporeSouth AfricaSouth AmericaSouth Central AsiaSouth Eastern AsiaSouthern EuropeSpainSri LankaSudanSwedenSwitzerlandSyriaTaiwanThailandTrinidad and TobagoTurkeyUgandaUkraineUzbekistanVenezuelaVietnamWestern AfricaWestern AsiaWestern EuropeZaire
Immigrant Origin (Percentage)
AfghanistanAfricaAlbaniaArgentinaAsiaAustraliaAustriaBahamasBangladeshBelarusBelgiumBoliviaBosnia and HerzegovinaBrazilBulgariaBurma / MyanmarCambodiaCameroonCanadaCaribbeanCentral AmericaChileChinaColombiaCongoCosta RicaCroatiaCubaCzechoslovakiaDenmarkDominican RepublicEastern AfricaEastern AsiaEastern EuropeEcuadorEgyptEl SalvadorEnglandEritreaEthiopiaEuropeFranceGermanyGhanaGreeceGuatemalaGuyanaHaitiHondurasHong KongHungaryIndiaIndonesiaIranIraqIrelandIsraelItalyJamaicaJapanJordanKazakhstanKenyaKoreaKuwaitLatin AmericaLatviaLebanonLiberiaLithuaniaMalaysiaMexicoMiddle AfricaMoldovaMoroccoNepalNetherlandsNigeriaNorthern AfricaNorthern EuropeNorwayOceaniaPakistanPanamaPeruPhilippinesPolandPortugalRomaniaRussiaSaudi ArabiaScotlandSerbiaSingaporeSouth AfricaSouth AmericaSouth Central AsiaSouth Eastern AsiaSouthern EuropeSpainSri LankaSudanSwedenSwitzerlandSyriaTaiwanThailandTrinidad and TobagoTurkeyUgandaUkraineUzbekistanVenezuelaVietnamWestern AfricaWestern AsiaWestern EuropeZaire
Income
Income (Families)
Income (Households)
Poverty
Poverty (Families)
Unemployment
Employment Occupations
Employment Industries
Employer Class
Commute Time
Commute Means
School Enrollment
Education by Degree Field
Occupancy
Finances
Physical Characteristics
Pittsburgh
Compare Zip Codes
Comparison Subject

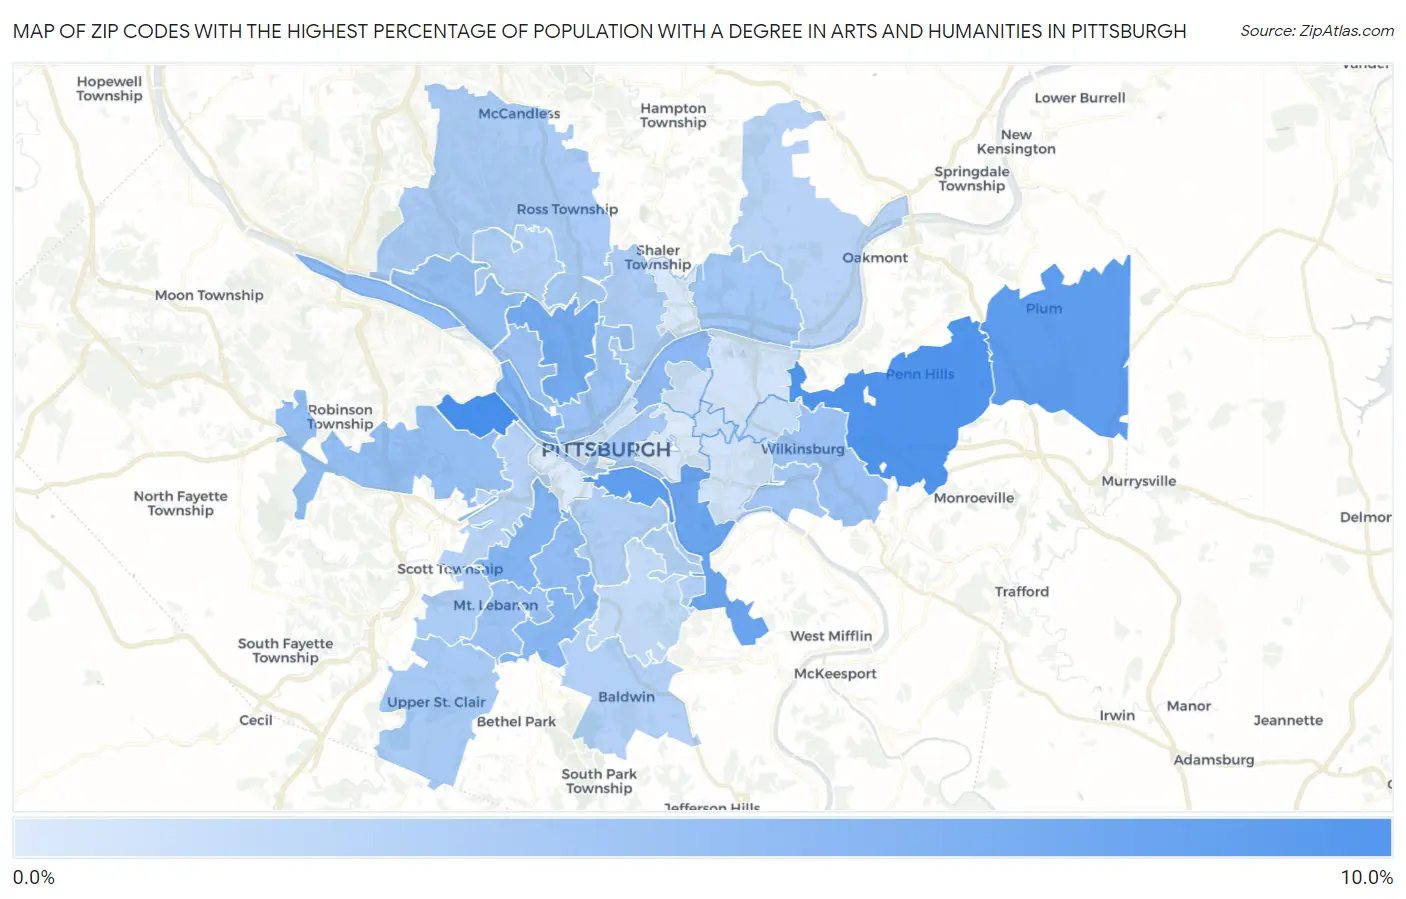
Map of Zip Codes with the Highest Percentage of Population with a Degree in Arts and Humanities in Pittsburgh

0.0%
10.0%
Zip Codes with the Highest Percentage of Population with a Degree in Arts and Humanities in Pittsburgh Map

Zip Codes with the Highest Percentage of Population with a Degree in Arts and Humanities in Pittsburgh, PA

Zip Code % Graduates vs State vs National
1.1520410.0%6.0%(+3.94)#3596.0%(+3.96)#6,315
2.152359.4%6.0%(+3.42)#4076.0%(+3.44)#7,041
3.152398.7%6.0%(+2.70)#4626.0%(+2.72)#8,220
4.152038.6%6.0%(+2.57)#4786.0%(+2.58)#8,470
5.152077.8%6.0%(+1.83)#5526.0%(+1.85)#9,951
6.152147.4%6.0%(+1.40)#5956.0%(+1.42)#10,923
7.152336.6%6.0%(+0.627)#6906.0%(+0.647)#12,901
8.152166.6%6.0%(+0.551)#7006.0%(+0.571)#13,085
9.152346.4%6.0%(+0.370)#7316.0%(+0.389)#13,566
10.152016.1%6.0%(+0.069)#7666.0%(+0.088)#14,436
11.152256.0%6.0%(-0.004)#7766.0%(+0.015)#14,641
12.152265.8%6.0%(-0.203)#8056.0%(-0.184)#15,209
13.152025.6%6.0%(-0.395)#8356.0%(-0.376)#15,781
14.152055.6%6.0%(-0.420)#8416.0%(-0.401)#15,860
15.152285.3%6.0%(-0.705)#8856.0%(-0.686)#16,676
16.152215.3%6.0%(-0.759)#8936.0%(-0.740)#16,862
17.152125.2%6.0%(-0.771)#8956.0%(-0.751)#16,899
18.152154.9%6.0%(-1.09)#9506.0%(-1.07)#17,829
19.152184.8%6.0%(-1.18)#9696.0%(-1.16)#18,086
20.152194.7%6.0%(-1.31)#9876.0%(-1.29)#18,424
21.152414.7%6.0%(-1.35)#9956.0%(-1.33)#18,553
22.152374.5%6.0%(-1.55)#1,0246.0%(-1.53)#19,108
23.152434.4%6.0%(-1.61)#1,0396.0%(-1.59)#19,276
24.152094.4%6.0%(-1.65)#1,0426.0%(-1.64)#19,396
25.152104.3%6.0%(-1.76)#1,0606.0%(-1.74)#19,653
26.152364.0%6.0%(-1.98)#1,0846.0%(-1.96)#20,242
27.152294.0%6.0%(-2.04)#1,0926.0%(-2.02)#20,414
28.152383.8%6.0%(-2.21)#1,1086.0%(-2.19)#20,840
29.152203.7%6.0%(-2.32)#1,1266.0%(-2.30)#21,112
30.152273.1%6.0%(-2.88)#1,2046.0%(-2.86)#22,403
31.152083.0%6.0%(-2.97)#1,2116.0%(-2.95)#22,563
32.152242.6%6.0%(-3.40)#1,2556.0%(-3.38)#23,363
33.152322.6%6.0%(-3.41)#1,2586.0%(-3.39)#23,386
34.152222.5%6.0%(-3.48)#1,2676.0%(-3.47)#23,525
35.152062.4%6.0%(-3.58)#1,2806.0%(-3.56)#23,702
36.152172.4%6.0%(-3.58)#1,2816.0%(-3.56)#23,703
37.152231.9%6.0%(-4.12)#1,3216.0%(-4.10)#24,474
38.152131.9%6.0%(-4.12)#1,3236.0%(-4.10)#24,488
39.152111.8%6.0%(-4.21)#1,3286.0%(-4.19)#24,613

Common Questions

What are the Top 10 Zip Codes with the Highest Percentage of Population with a Degree in Arts and Humanities in Pittsburgh, PA?
Top 10 Zip Codes with the Highest Percentage of Population with a Degree in Arts and Humanities in Pittsburgh, PA are:
#1
10.0%
#2
9.4%
#3
8.7%
#4
8.6%
#5
7.8%
#6
7.4%
#7
6.6%
#8
6.6%
#9
6.4%
#10
6.1%
What zip code has the Highest Percentage of Population with a Degree in Arts and Humanities in Pittsburgh, PA?
15204 has the Highest Percentage of Population with a Degree in Arts and Humanities in Pittsburgh, PA with 10.0%.
What is the Percentage of Population with a Degree in Arts and Humanities in Pittsburgh, PA?
Percentage of Population with a Degree in Arts and Humanities in Pittsburgh is 3.9%.
What is the Percentage of Population with a Degree in Arts and Humanities in Pennsylvania?
Percentage of Population with a Degree in Arts and Humanities in Pennsylvania is 6.0%.
What is the Percentage of Population with a Degree in Arts and Humanities in the United States?
Percentage of Population with a Degree in Arts and Humanities in the United States is 6.0%.