Zip Codes with the Highest Percentage of Households with Income Below $10,000 in York, PA

RELATED REPORTS & OPTIONS

Household Income | $0-10k
Population
Families and Households
Female Fertility
Female Fertility (Unmarried)
Race (Community Size)
Race (Percentage)
Ancestry (Community Size)
AfricanAlbanianAmericanApacheArabArgentineanArmenianAustralianAustrianBhutaneseBlackfeetBrazilianBritishBritish West IndianBulgarianBurmeseCambodianCanadianCentral AmericanCentral American IndianCherokeeColombianCroatianCubanCzechCzechoslovakianDanishDominicanDutchEastern EuropeanEcuadorianEgyptianEnglishEuropeanFinnishFrenchFrench CanadianGermanGhanaianGreekGuatemalanHaitianHonduranHungarianIndian (Asian)IranianIrishIroquoisItalianJamaicanJapaneseKenyanKoreanLaotianLebaneseLithuanianMalaysianMexicanNative HawaiianNigerianNorthern EuropeanNorwegianPakistaniPanamanianPennsylvania GermanPeruvianPolishPortuguesePuerto RicanRomanianRussianSalvadoranScandinavianScotch-IrishScottishSeminoleSerbianSierra LeoneanSiouxSlavicSlovakSloveneSouth AmericanSouth American IndianSpaniardSpanishSri LankanSubsaharan AfricanSwedishSwissSyrianThaiTrinidadian and TobagonianU.S. Virgin IslanderUkrainianWelshWest IndianYugoslavian
Ancestry (Percentage)
AfricanAlbanianAmericanApacheArabArgentineanArmenianAustralianAustrianBhutaneseBlackfeetBrazilianBritishBritish West IndianBulgarianBurmeseCambodianCanadianCentral AmericanCentral American IndianCherokeeColombianCroatianCubanCzechCzechoslovakianDanishDominicanDutchEastern EuropeanEcuadorianEgyptianEnglishEuropeanFinnishFrenchFrench CanadianGermanGhanaianGreekGuatemalanHaitianHonduranHungarianIndian (Asian)IranianIrishIroquoisItalianJamaicanJapaneseKenyanKoreanLaotianLebaneseLithuanianMalaysianMexicanNative HawaiianNigerianNorthern EuropeanNorwegianPakistaniPanamanianPennsylvania GermanPeruvianPolishPortuguesePuerto RicanRomanianRussianSalvadoranScandinavianScotch-IrishScottishSeminoleSerbianSierra LeoneanSiouxSlavicSlovakSloveneSouth AmericanSouth American IndianSpaniardSpanishSri LankanSubsaharan AfricanSwedishSwissSyrianThaiTrinidadian and TobagonianU.S. Virgin IslanderUkrainianWelshWest IndianYugoslavian
Immigrant Origin (Total)
Immigrant Origin (Percentage)
Income
Income (Families)
Income (Households)
Poverty
Poverty (Families)
Unemployment
Employment Occupations
Employment Industries
Employer Class
Commute Time
Commute Means
School Enrollment
Education by Degree Field
Occupancy
Finances
Physical Characteristics
York
Compare Zip Codes
Comparison Subject

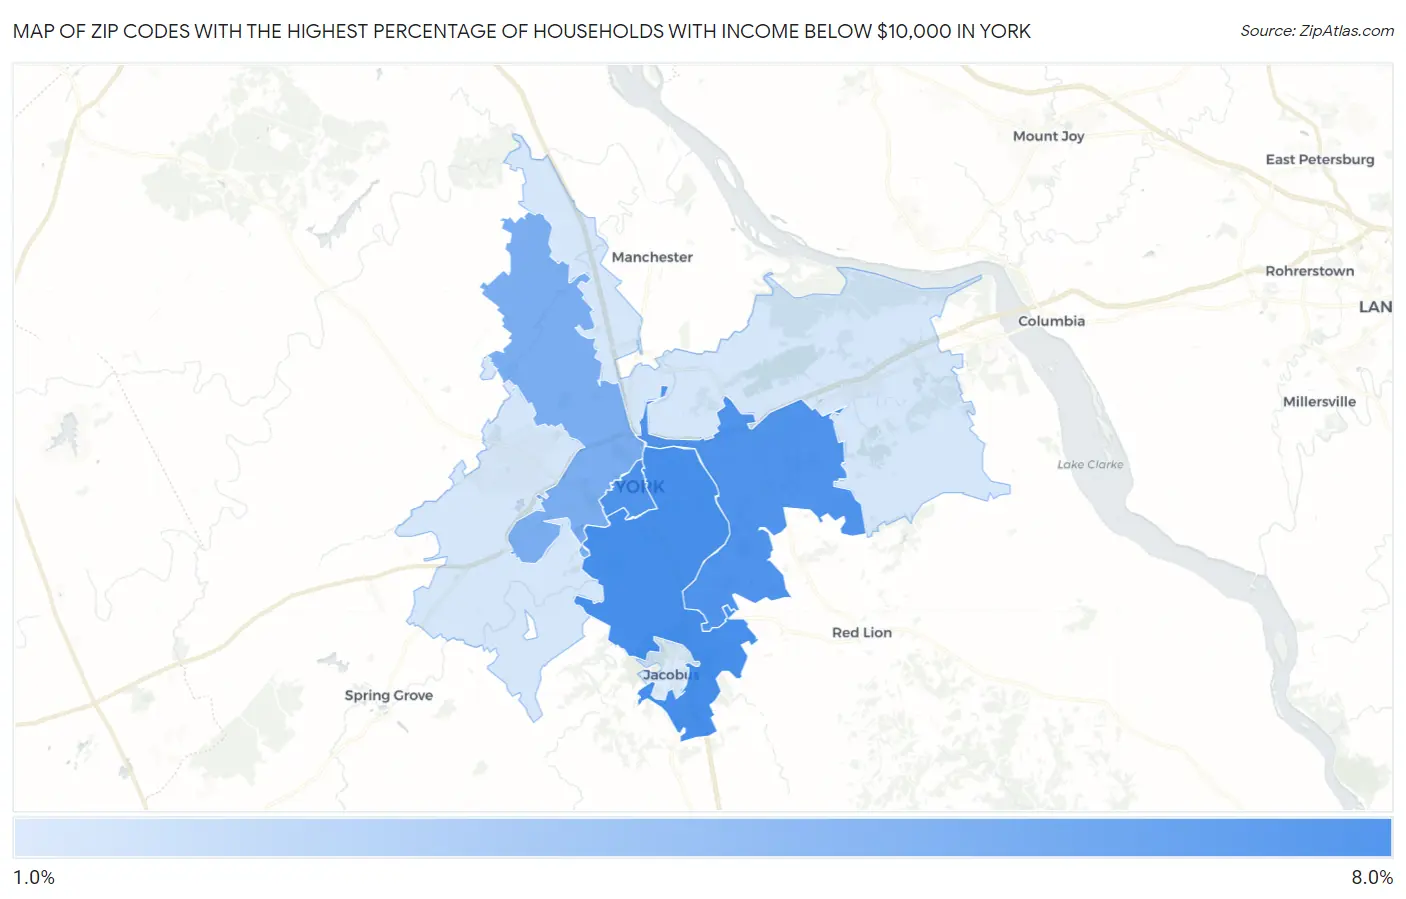
Map of Zip Codes with the Highest Percentage of Households with Income Below $10,000 in York

0.0%
8.0%
Zip Codes with the Highest Percentage of Households with Income Below $10,000 in York Map

Zip Codes with the Highest Percentage of Households with Income Below $10,000 in York, PA

Zip Code Households with Income < $10k vs State vs National
1.174036.7%4.8%(+1.90)#2874.9%(+1.80)#7,527
2.174026.5%4.8%(+1.70)#3104.9%(+1.60)#7,897
3.174016.4%4.8%(+1.60)#3234.9%(+1.50)#8,134
4.174045.0%4.8%(+0.200)#4914.9%(+0.100)#11,668
5.174082.0%4.8%(-2.80)#1,1714.9%(-2.90)#23,635
6.174062.0%4.8%(-2.80)#1,1724.9%(-2.90)#23,636
7.174071.8%4.8%(-3.00)#1,2354.9%(-3.10)#24,533

Common Questions

What are the Top 5 Zip Codes with the Highest Percentage of Households with Income Below $10,000 in York, PA?
Top 5 Zip Codes with the Highest Percentage of Households with Income Below $10,000 in York, PA are:
#1
6.7%
#2
6.5%
#3
6.4%
#4
5.0%
#5
2.0%
What zip code has the Highest Percentage of Households with Income Below $10,000 in York, PA?
17403 has the Highest Percentage of Households with Income Below $10,000 in York, PA with 6.7%.
What is the Percentage of Households with Income Below $10,000 in York, PA?
Percentage of Households with Income Below $10,000 in York is 8.2%.
What is the Percentage of Households with Income Below $10,000 in Pennsylvania?
Percentage of Households with Income Below $10,000 in Pennsylvania is 4.8%.
What is the Percentage of Households with Income Below $10,000 in the United States?
Percentage of Households with Income Below $10,000 in the United States is 4.9%.