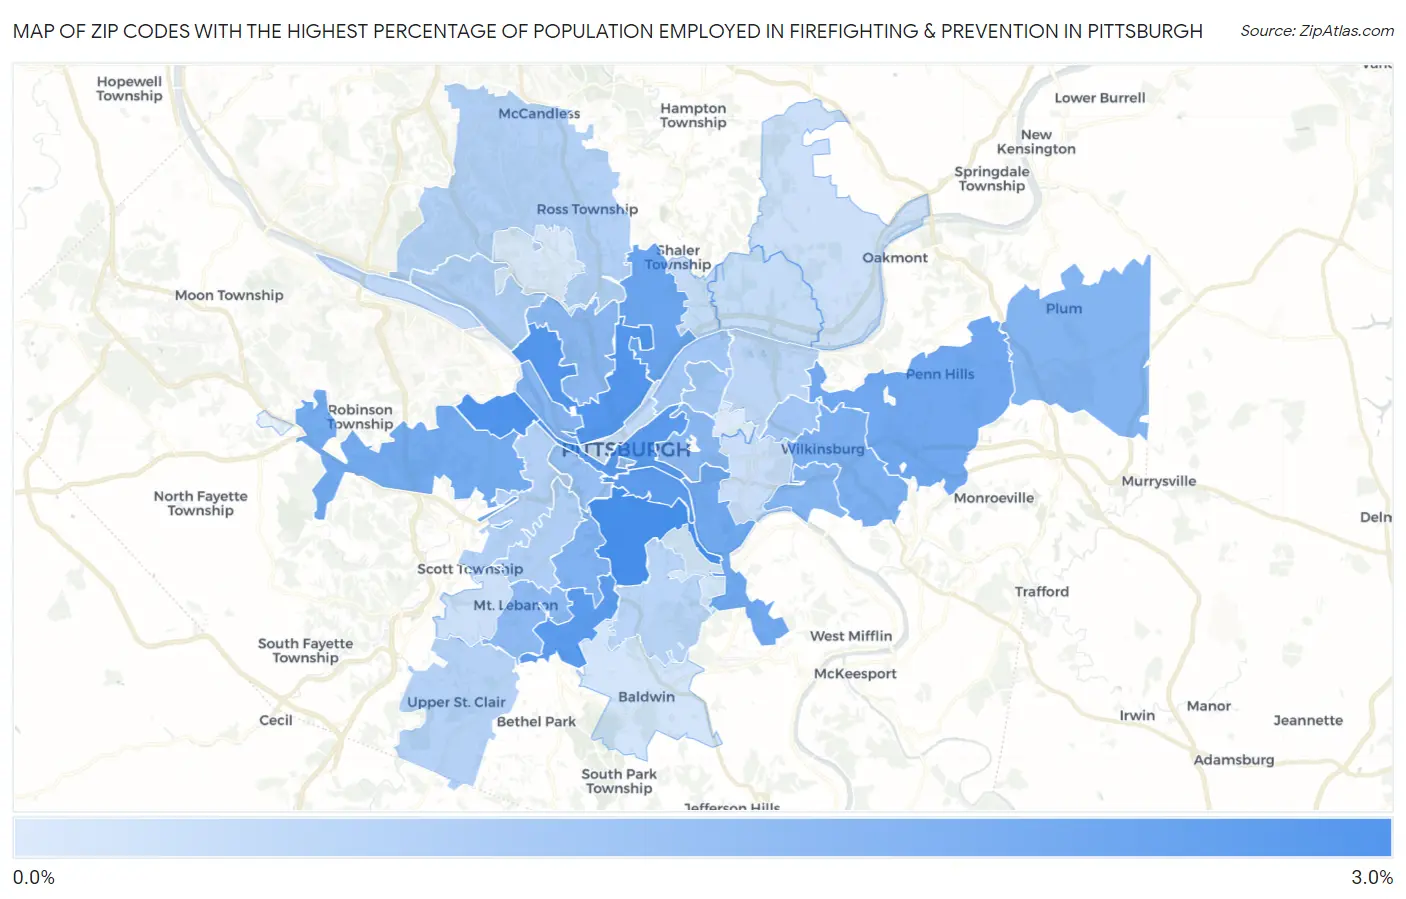
Zip Codes with the Highest Percentage of Population Employed in Firefighting & Prevention in Pittsburgh, PA
RELATED REPORTS & OPTIONS
Firefighting & Prevention
Pittsburgh
Compare Zip Codes
Map of Zip Codes with the Highest Percentage of Population Employed in Firefighting & Prevention in Pittsburgh
0.12%
2.7%
Zip Codes with the Highest Percentage of Population Employed in Firefighting & Prevention in Pittsburgh, PA
| Zip Code | % Employed | vs State | vs National | |
| 1. | 15210 | 2.7% | 1.0%(+1.69)#97 | 1.2%(+1.53)#2,699 |
| 2. | 15204 | 2.6% | 1.0%(+1.57)#109 | 1.2%(+1.41)#2,909 |
| 3. | 15212 | 2.5% | 1.0%(+1.47)#113 | 1.2%(+1.31)#3,112 |
| 4. | 15219 | 2.4% | 1.0%(+1.36)#121 | 1.2%(+1.20)#3,370 |
| 5. | 15234 | 2.3% | 1.0%(+1.33)#125 | 1.2%(+1.16)#3,450 |
| 6. | 15203 | 2.3% | 1.0%(+1.27)#129 | 1.2%(+1.11)#3,575 |
| 7. | 15209 | 2.1% | 1.0%(+1.06)#160 | 1.2%(+0.901)#4,194 |
| 8. | 15235 | 2.0% | 1.0%(+0.984)#174 | 1.2%(+0.822)#4,481 |
| 9. | 15207 | 1.9% | 1.0%(+0.908)#189 | 1.2%(+0.746)#4,780 |
| 10. | 15205 | 1.9% | 1.0%(+0.884)#192 | 1.2%(+0.722)#4,888 |
| 11. | 15221 | 1.8% | 1.0%(+0.775)#211 | 1.2%(+0.613)#5,362 |
| 12. | 15226 | 1.7% | 1.0%(+0.686)#232 | 1.2%(+0.524)#5,794 |
| 13. | 15239 | 1.7% | 1.0%(+0.643)#246 | 1.2%(+0.481)#6,010 |
| 14. | 15218 | 1.6% | 1.0%(+0.603)#254 | 1.2%(+0.442)#6,238 |
| 15. | 15233 | 1.6% | 1.0%(+0.584)#261 | 1.2%(+0.422)#6,334 |
| 16. | 15213 | 1.6% | 1.0%(+0.543)#271 | 1.2%(+0.381)#6,561 |
| 17. | 15214 | 1.5% | 1.0%(+0.497)#281 | 1.2%(+0.336)#6,841 |
| 18. | 15228 | 1.5% | 1.0%(+0.450)#290 | 1.2%(+0.288)#7,145 |
| 19. | 15282 | 1.3% | 1.0%(+0.310)#324 | 1.2%(+0.148)#8,097 |
| 20. | 15211 | 1.3% | 1.0%(+0.284)#332 | 1.2%(+0.123)#8,285 |
| 21. | 15208 | 1.2% | 1.0%(+0.142)#400 | 1.2%(-0.020)#9,449 |
| 22. | 15224 | 1.1% | 1.0%(+0.101)#413 | 1.2%(-0.061)#9,871 |
| 23. | 15201 | 1.1% | 1.0%(+0.087)#418 | 1.2%(-0.075)#10,000 |
| 24. | 15216 | 0.89% | 1.0%(-0.136)#517 | 1.2%(-0.297)#12,286 |
| 25. | 15202 | 0.88% | 1.0%(-0.141)#522 | 1.2%(-0.302)#12,337 |
| 26. | 15220 | 0.84% | 1.0%(-0.181)#551 | 1.2%(-0.343)#12,740 |
| 27. | 15237 | 0.81% | 1.0%(-0.210)#568 | 1.2%(-0.372)#13,035 |
| 28. | 15241 | 0.80% | 1.0%(-0.220)#579 | 1.2%(-0.381)#13,161 |
| 29. | 15227 | 0.70% | 1.0%(-0.324)#644 | 1.2%(-0.485)#14,321 |
| 30. | 15206 | 0.65% | 1.0%(-0.372)#668 | 1.2%(-0.534)#14,878 |
| 31. | 15225 | 0.60% | 1.0%(-0.424)#703 | 1.2%(-0.586)#15,419 |
| 32. | 15222 | 0.53% | 1.0%(-0.490)#750 | 1.2%(-0.652)#16,149 |
| 33. | 15223 | 0.53% | 1.0%(-0.496)#754 | 1.2%(-0.657)#16,221 |
| 34. | 15215 | 0.49% | 1.0%(-0.532)#775 | 1.2%(-0.694)#16,640 |
| 35. | 15217 | 0.42% | 1.0%(-0.608)#832 | 1.2%(-0.769)#17,461 |
| 36. | 15238 | 0.39% | 1.0%(-0.635)#855 | 1.2%(-0.797)#17,786 |
| 37. | 15243 | 0.38% | 1.0%(-0.646)#862 | 1.2%(-0.807)#17,901 |
| 38. | 15236 | 0.28% | 1.0%(-0.743)#927 | 1.2%(-0.905)#18,941 |
| 39. | 15229 | 0.18% | 1.0%(-0.845)#994 | 1.2%(-1.01)#19,846 |
| 40. | 15232 | 0.12% | 1.0%(-0.908)#1,025 | 1.2%(-1.07)#20,231 |
1
Common Questions
What are the Top 10 Zip Codes with the Highest Percentage of Population Employed in Firefighting & Prevention in Pittsburgh, PA?
Top 10 Zip Codes with the Highest Percentage of Population Employed in Firefighting & Prevention in Pittsburgh, PA are:
What zip code has the Highest Percentage of Population Employed in Firefighting & Prevention in Pittsburgh, PA?
15210 has the Highest Percentage of Population Employed in Firefighting & Prevention in Pittsburgh, PA with 2.7%.
What is the Percentage of Population Employed in Firefighting & Prevention in Pittsburgh, PA?
Percentage of Population Employed in Firefighting & Prevention in Pittsburgh is 1.6%.
What is the Percentage of Population Employed in Firefighting & Prevention in Pennsylvania?
Percentage of Population Employed in Firefighting & Prevention in Pennsylvania is 1.0%.
What is the Percentage of Population Employed in Firefighting & Prevention in the United States?
Percentage of Population Employed in Firefighting & Prevention in the United States is 1.2%.