Zip Codes with the Highest Percentage of Households with Income Below $10,000 in Reading, PA
RELATED REPORTS & OPTIONS
Household Income | $0-10k
Reading
Compare Zip Codes
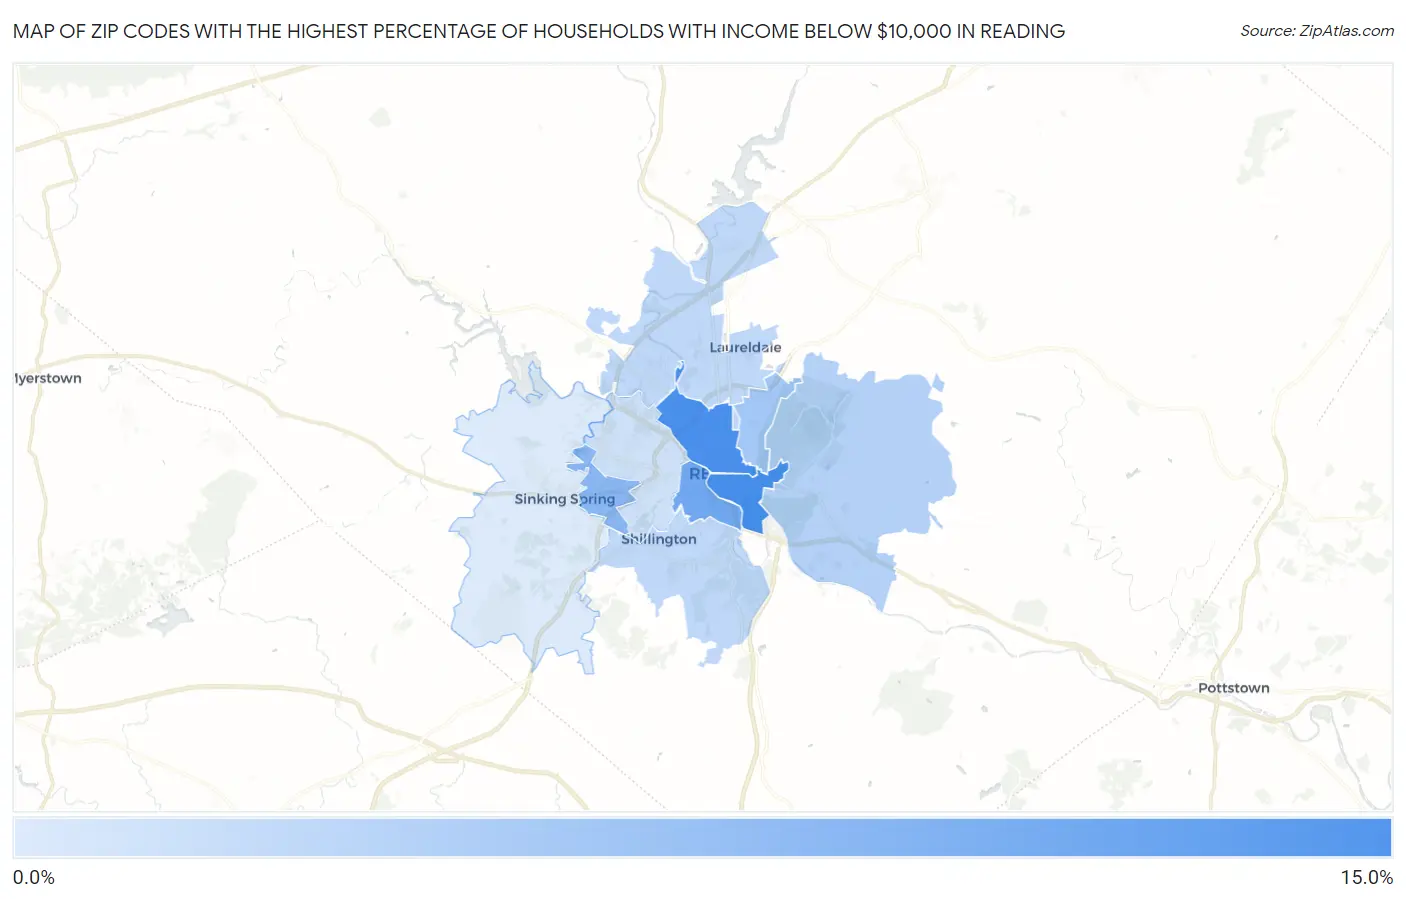
Map of Zip Codes with the Highest Percentage of Households with Income Below $10,000 in Reading
2.0%
10.8%
Zip Codes with the Highest Percentage of Households with Income Below $10,000 in Reading, PA
| Zip Code | Households with Income < $10k | vs State | vs National | |
| 1. | 19602 | 10.8% | 4.8%(+6.00)#113 | 4.9%(+5.90)#3,067 |
| 2. | 19601 | 10.7% | 4.8%(+5.90)#115 | 4.9%(+5.80)#3,115 |
| 3. | 19611 | 8.3% | 4.8%(+3.50)#197 | 4.9%(+3.40)#5,190 |
| 4. | 19609 | 6.8% | 4.8%(+2.00)#280 | 4.9%(+1.90)#7,377 |
| 5. | 19604 | 5.3% | 4.8%(+0.500)#450 | 4.9%(+0.400)#10,751 |
| 6. | 19606 | 4.3% | 4.8%(-0.500)#612 | 4.9%(-0.600)#14,068 |
| 7. | 19607 | 3.7% | 4.8%(-1.10)#720 | 4.9%(-1.20)#16,446 |
| 8. | 19605 | 3.7% | 4.8%(-1.10)#721 | 4.9%(-1.20)#16,469 |
| 9. | 19610 | 2.8% | 4.8%(-2.00)#972 | 4.9%(-2.10)#20,345 |
| 10. | 19608 | 2.0% | 4.8%(-2.80)#1,170 | 4.9%(-2.90)#23,633 |
1
Common Questions
What are the Top 5 Zip Codes with the Highest Percentage of Households with Income Below $10,000 in Reading, PA?
Top 5 Zip Codes with the Highest Percentage of Households with Income Below $10,000 in Reading, PA are:
What zip code has the Highest Percentage of Households with Income Below $10,000 in Reading, PA?
19602 has the Highest Percentage of Households with Income Below $10,000 in Reading, PA with 10.8%.
What is the Percentage of Households with Income Below $10,000 in Reading, PA?
Percentage of Households with Income Below $10,000 in Reading is 9.4%.
What is the Percentage of Households with Income Below $10,000 in Pennsylvania?
Percentage of Households with Income Below $10,000 in Pennsylvania is 4.8%.
What is the Percentage of Households with Income Below $10,000 in the United States?
Percentage of Households with Income Below $10,000 in the United States is 4.9%.