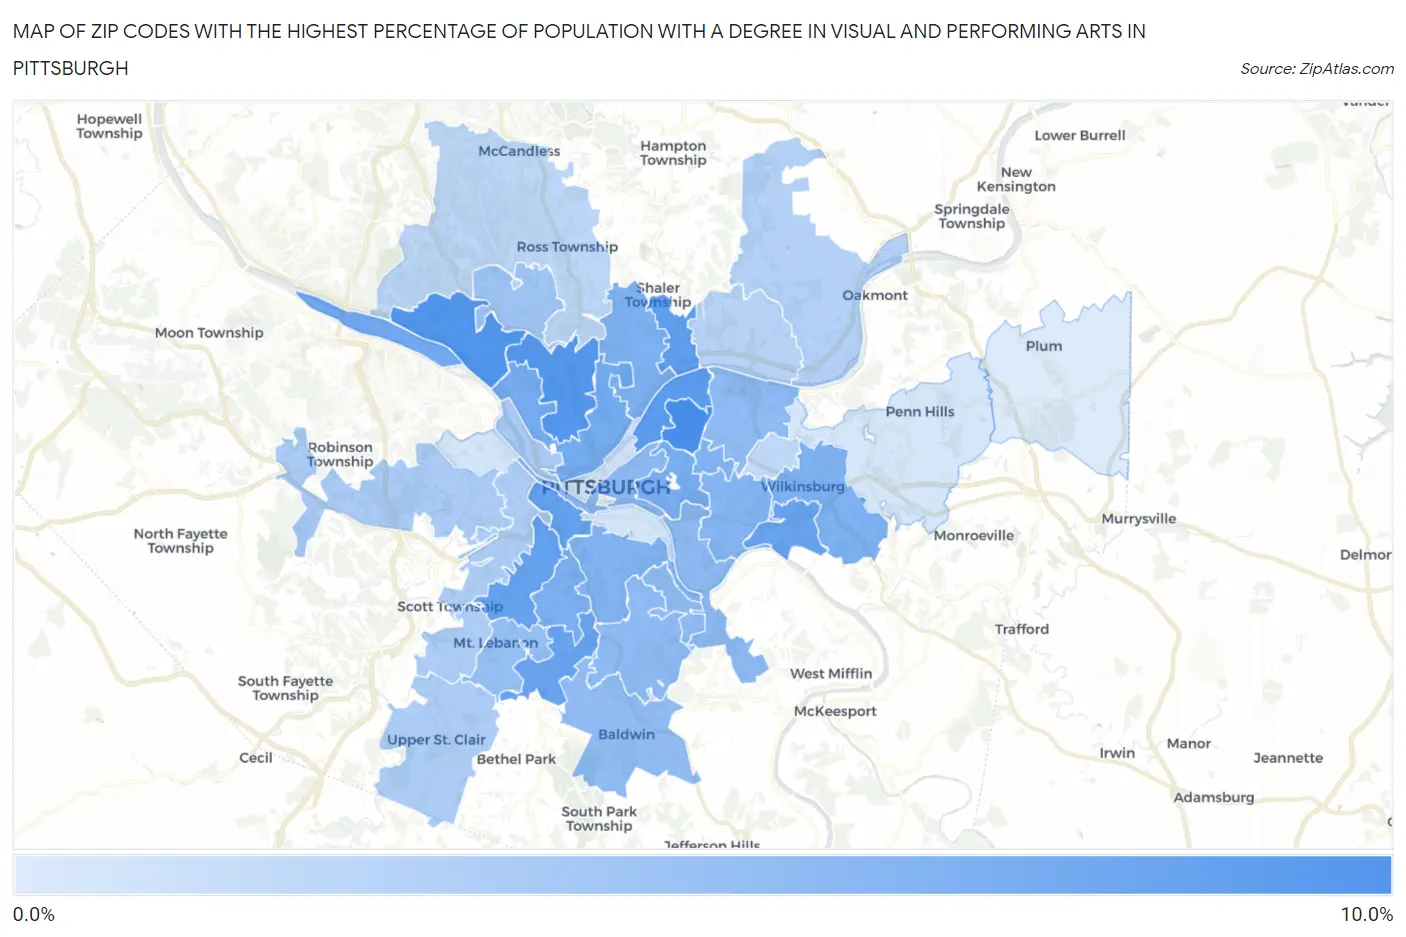
Zip Codes with the Highest Percentage of Population with a Degree in Visual and Performing Arts in Pittsburgh, PA
RELATED REPORTS & OPTIONS
Visual and Performing Arts
Pittsburgh
Compare Zip Codes
Map of Zip Codes with the Highest Percentage of Population with a Degree in Visual and Performing Arts in Pittsburgh
1.1%
8.8%
Zip Codes with the Highest Percentage of Population with a Degree in Visual and Performing Arts in Pittsburgh, PA
| Zip Code | % Graduates | vs State | vs National | |
| 1. | 15224 | 8.8% | 3.8%(+4.97)#104 | 4.3%(+4.54)#2,364 |
| 2. | 15202 | 8.2% | 3.8%(+4.36)#120 | 4.3%(+3.93)#2,727 |
| 3. | 15214 | 8.1% | 3.8%(+4.23)#126 | 4.3%(+3.80)#2,811 |
| 4. | 15201 | 7.7% | 3.8%(+3.88)#133 | 4.3%(+3.45)#3,049 |
| 5. | 15223 | 7.5% | 3.8%(+3.66)#140 | 4.3%(+3.23)#3,221 |
| 6. | 15211 | 7.3% | 3.8%(+3.51)#142 | 4.3%(+3.08)#3,341 |
| 7. | 15216 | 7.2% | 3.8%(+3.43)#145 | 4.3%(+3.00)#3,432 |
| 8. | 15234 | 7.1% | 3.8%(+3.32)#151 | 4.3%(+2.89)#3,526 |
| 9. | 15218 | 7.1% | 3.8%(+3.30)#152 | 4.3%(+2.87)#3,537 |
| 10. | 15225 | 6.6% | 3.8%(+2.73)#179 | 4.3%(+2.31)#4,167 |
| 11. | 15212 | 6.4% | 3.8%(+2.58)#194 | 4.3%(+2.15)#4,345 |
| 12. | 15213 | 6.2% | 3.8%(+2.39)#204 | 4.3%(+1.96)#4,581 |
| 13. | 15226 | 6.0% | 3.8%(+2.17)#223 | 4.3%(+1.74)#4,892 |
| 14. | 15209 | 5.9% | 3.8%(+2.12)#225 | 4.3%(+1.69)#4,943 |
| 15. | 15221 | 5.9% | 3.8%(+2.04)#229 | 4.3%(+1.62)#5,069 |
| 16. | 15232 | 5.8% | 3.8%(+1.97)#237 | 4.3%(+1.54)#5,182 |
| 17. | 15210 | 5.8% | 3.8%(+1.97)#238 | 4.3%(+1.54)#5,185 |
| 18. | 15217 | 5.6% | 3.8%(+1.76)#256 | 4.3%(+1.33)#5,532 |
| 19. | 15219 | 5.3% | 3.8%(+1.51)#282 | 4.3%(+1.08)#5,995 |
| 20. | 15207 | 5.2% | 3.8%(+1.33)#300 | 4.3%(+0.905)#6,322 |
| 21. | 15206 | 5.1% | 3.8%(+1.30)#306 | 4.3%(+0.869)#6,388 |
| 22. | 15227 | 5.0% | 3.8%(+1.20)#314 | 4.3%(+0.770)#6,581 |
| 23. | 15236 | 5.0% | 3.8%(+1.18)#317 | 4.3%(+0.752)#6,621 |
| 24. | 15228 | 4.7% | 3.8%(+0.863)#354 | 4.3%(+0.434)#7,331 |
| 25. | 15229 | 4.1% | 3.8%(+0.289)#416 | 4.3%(-0.140)#8,897 |
| 26. | 15205 | 3.7% | 3.8%(-0.111)#481 | 4.3%(-0.540)#10,122 |
| 27. | 15233 | 3.6% | 3.8%(-0.184)#489 | 4.3%(-0.612)#10,377 |
| 28. | 15243 | 3.6% | 3.8%(-0.267)#504 | 4.3%(-0.696)#10,673 |
| 29. | 15220 | 3.5% | 3.8%(-0.275)#507 | 4.3%(-0.703)#10,712 |
| 30. | 15241 | 3.5% | 3.8%(-0.304)#516 | 4.3%(-0.733)#10,818 |
| 31. | 15238 | 3.2% | 3.8%(-0.673)#588 | 4.3%(-1.10)#12,156 |
| 32. | 15215 | 3.0% | 3.8%(-0.847)#622 | 4.3%(-1.28)#12,813 |
| 33. | 15237 | 2.8% | 3.8%(-1.06)#669 | 4.3%(-1.49)#13,638 |
| 34. | 15208 | 2.7% | 3.8%(-1.16)#692 | 4.3%(-1.58)#14,025 |
| 35. | 15222 | 1.9% | 3.8%(-1.97)#860 | 4.3%(-2.40)#16,963 |
| 36. | 15203 | 1.6% | 3.8%(-2.22)#917 | 4.3%(-2.65)#17,835 |
| 37. | 15204 | 1.6% | 3.8%(-2.27)#925 | 4.3%(-2.70)#17,990 |
| 38. | 15235 | 1.4% | 3.8%(-2.40)#951 | 4.3%(-2.83)#18,387 |
| 39. | 15239 | 1.1% | 3.8%(-2.69)#993 | 4.3%(-3.12)#19,272 |
1
Common Questions
What are the Top 10 Zip Codes with the Highest Percentage of Population with a Degree in Visual and Performing Arts in Pittsburgh, PA?
Top 10 Zip Codes with the Highest Percentage of Population with a Degree in Visual and Performing Arts in Pittsburgh, PA are:
What zip code has the Highest Percentage of Population with a Degree in Visual and Performing Arts in Pittsburgh, PA?
15224 has the Highest Percentage of Population with a Degree in Visual and Performing Arts in Pittsburgh, PA with 8.8%.
What is the Percentage of Population with a Degree in Visual and Performing Arts in Pittsburgh, PA?
Percentage of Population with a Degree in Visual and Performing Arts in Pittsburgh is 5.5%.
What is the Percentage of Population with a Degree in Visual and Performing Arts in Pennsylvania?
Percentage of Population with a Degree in Visual and Performing Arts in Pennsylvania is 3.8%.
What is the Percentage of Population with a Degree in Visual and Performing Arts in the United States?
Percentage of Population with a Degree in Visual and Performing Arts in the United States is 4.3%.