Zip Codes with the Highest Percentage of Population Employed in Administrative & Support Services in Pittsburgh, PA
RELATED REPORTS & OPTIONS
Administrative & Support Services
Pittsburgh
Compare Zip Codes
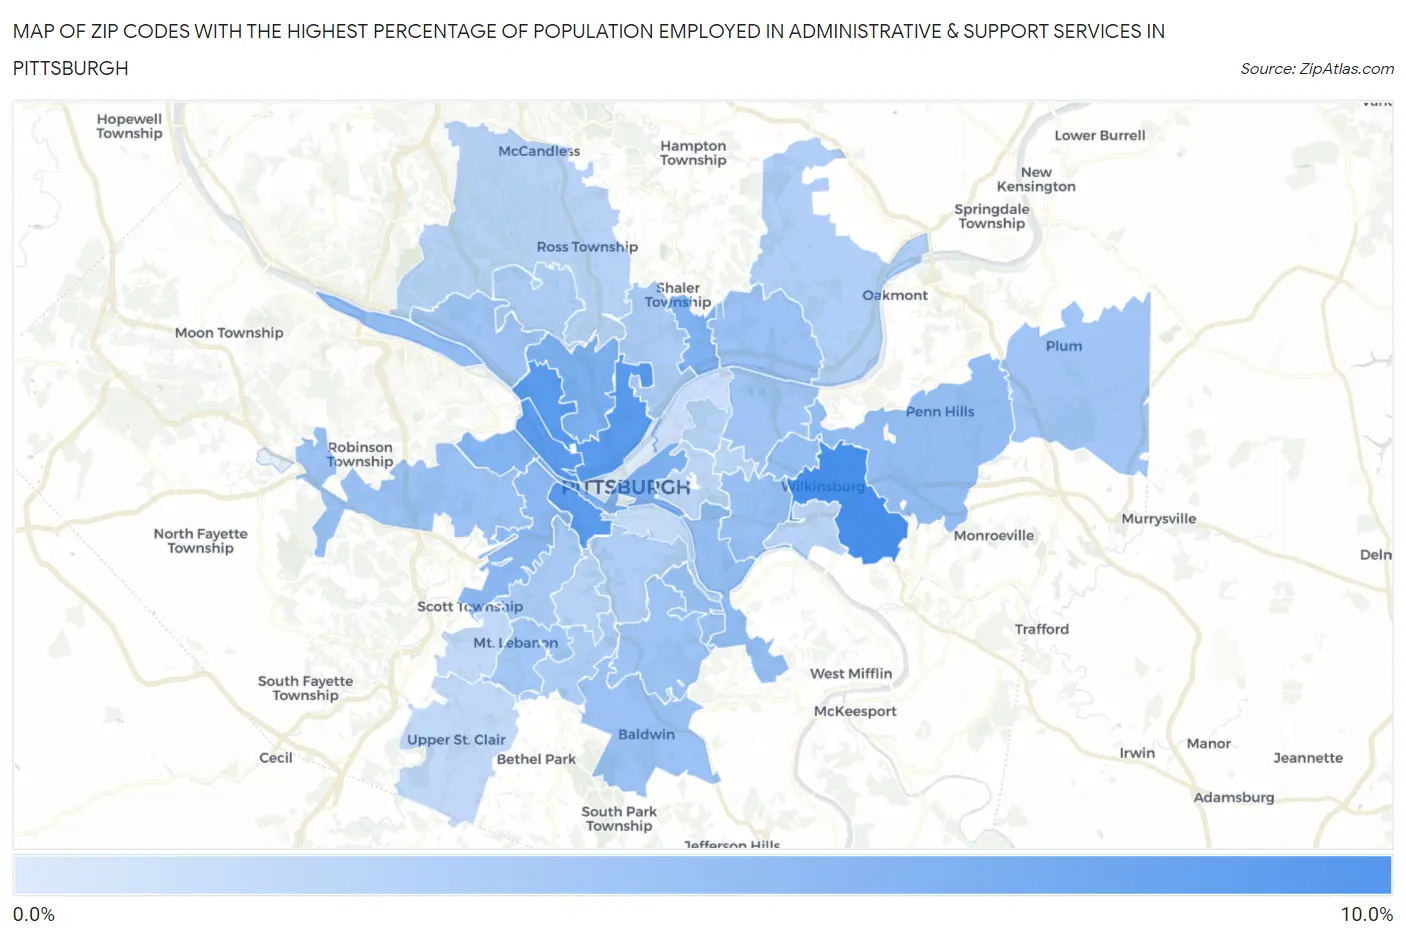
Map of Zip Codes with the Highest Percentage of Population Employed in Administrative & Support Services in Pittsburgh
0.59%
8.2%
Zip Codes with the Highest Percentage of Population Employed in Administrative & Support Services in Pittsburgh, PA
| Zip Code | % Employed | vs State | vs National | |
| 1. | 15221 | 8.2% | 3.6%(+4.59)#101 | 4.1%(+4.02)#2,160 |
| 2. | 15212 | 7.4% | 3.6%(+3.77)#127 | 4.1%(+3.20)#2,838 |
| 3. | 15211 | 7.1% | 3.6%(+3.47)#146 | 4.1%(+2.90)#3,164 |
| 4. | 15233 | 6.9% | 3.6%(+3.34)#153 | 4.1%(+2.78)#3,312 |
| 5. | 15214 | 5.3% | 3.6%(+1.72)#296 | 4.1%(+1.16)#6,301 |
| 6. | 15219 | 5.3% | 3.6%(+1.68)#306 | 4.1%(+1.11)#6,441 |
| 7. | 15223 | 5.1% | 3.6%(+1.56)#320 | 4.1%(+0.996)#6,721 |
| 8. | 15204 | 5.1% | 3.6%(+1.50)#328 | 4.1%(+0.938)#6,882 |
| 9. | 15220 | 4.5% | 3.6%(+0.962)#393 | 4.1%(+0.397)#8,551 |
| 10. | 15225 | 4.4% | 3.6%(+0.815)#416 | 4.1%(+0.250)#9,086 |
| 11. | 15235 | 4.3% | 3.6%(+0.710)#434 | 4.1%(+0.145)#9,466 |
| 12. | 15207 | 4.2% | 3.6%(+0.655)#445 | 4.1%(+0.091)#9,658 |
| 13. | 15208 | 4.1% | 3.6%(+0.509)#475 | 4.1%(-0.055)#10,258 |
| 14. | 15217 | 4.0% | 3.6%(+0.433)#499 | 4.1%(-0.132)#10,616 |
| 15. | 15205 | 4.0% | 3.6%(+0.372)#516 | 4.1%(-0.192)#10,869 |
| 16. | 15215 | 3.9% | 3.6%(+0.318)#525 | 4.1%(-0.247)#11,095 |
| 17. | 15236 | 3.8% | 3.6%(+0.226)#551 | 4.1%(-0.339)#11,480 |
| 18. | 15227 | 3.7% | 3.6%(+0.092)#594 | 4.1%(-0.472)#12,100 |
| 19. | 15206 | 3.6% | 3.6%(-0.020)#625 | 4.1%(-0.584)#12,630 |
| 20. | 15239 | 3.5% | 3.6%(-0.040)#635 | 4.1%(-0.605)#12,740 |
| 21. | 15202 | 3.5% | 3.6%(-0.077)#646 | 4.1%(-0.642)#12,930 |
| 22. | 15228 | 3.4% | 3.6%(-0.198)#677 | 4.1%(-0.763)#13,507 |
| 23. | 15216 | 3.2% | 3.6%(-0.408)#740 | 4.1%(-0.973)#14,589 |
| 24. | 15209 | 3.1% | 3.6%(-0.463)#758 | 4.1%(-1.03)#14,876 |
| 25. | 15234 | 3.0% | 3.6%(-0.571)#793 | 4.1%(-1.14)#15,401 |
| 26. | 15229 | 2.9% | 3.6%(-0.667)#829 | 4.1%(-1.23)#15,903 |
| 27. | 15210 | 2.8% | 3.6%(-0.775)#875 | 4.1%(-1.34)#16,488 |
| 28. | 15238 | 2.8% | 3.6%(-0.799)#889 | 4.1%(-1.36)#16,629 |
| 29. | 15224 | 2.6% | 3.6%(-1.01)#956 | 4.1%(-1.58)#17,761 |
| 30. | 15218 | 2.4% | 3.6%(-1.16)#1,014 | 4.1%(-1.73)#18,534 |
| 31. | 15226 | 2.4% | 3.6%(-1.17)#1,018 | 4.1%(-1.74)#18,576 |
| 32. | 15237 | 2.4% | 3.6%(-1.21)#1,029 | 4.1%(-1.77)#18,771 |
| 33. | 15232 | 2.3% | 3.6%(-1.29)#1,055 | 4.1%(-1.85)#19,192 |
| 34. | 15213 | 2.2% | 3.6%(-1.43)#1,095 | 4.1%(-1.99)#19,869 |
| 35. | 15243 | 2.0% | 3.6%(-1.59)#1,131 | 4.1%(-2.16)#20,675 |
| 36. | 15241 | 1.9% | 3.6%(-1.67)#1,151 | 4.1%(-2.23)#21,000 |
| 37. | 15203 | 1.7% | 3.6%(-1.92)#1,210 | 4.1%(-2.48)#22,112 |
| 38. | 15201 | 1.5% | 3.6%(-2.05)#1,239 | 4.1%(-2.61)#22,600 |
| 39. | 15222 | 0.59% | 3.6%(-3.00)#1,384 | 4.1%(-3.56)#25,658 |
1
Common Questions
What are the Top 10 Zip Codes with the Highest Percentage of Population Employed in Administrative & Support Services in Pittsburgh, PA?
Top 10 Zip Codes with the Highest Percentage of Population Employed in Administrative & Support Services in Pittsburgh, PA are:
What zip code has the Highest Percentage of Population Employed in Administrative & Support Services in Pittsburgh, PA?
15221 has the Highest Percentage of Population Employed in Administrative & Support Services in Pittsburgh, PA with 8.2%.
What is the Percentage of Population Employed in Administrative & Support Services in Pittsburgh, PA?
Percentage of Population Employed in Administrative & Support Services in Pittsburgh is 3.8%.
What is the Percentage of Population Employed in Administrative & Support Services in Pennsylvania?
Percentage of Population Employed in Administrative & Support Services in Pennsylvania is 3.6%.
What is the Percentage of Population Employed in Administrative & Support Services in the United States?
Percentage of Population Employed in Administrative & Support Services in the United States is 4.1%.