Zip Codes with the Highest Percentage of Population Employed in Real Estate, Rental & Leasing in Pittsburgh, PA
RELATED REPORTS & OPTIONS
Real Estate, Rental & Leasing
Pittsburgh
Compare Zip Codes
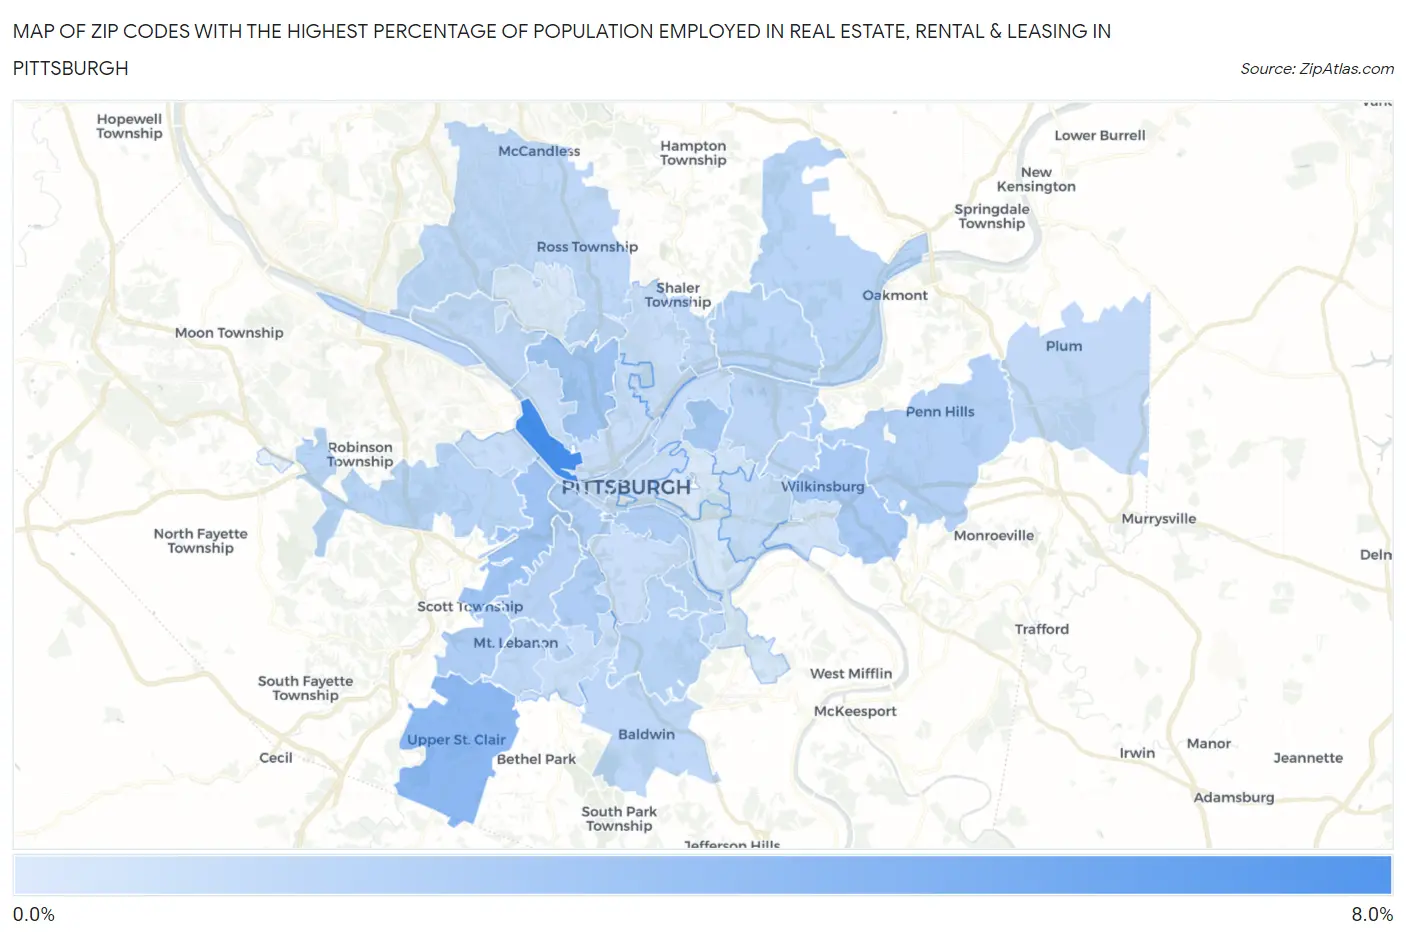
Map of Zip Codes with the Highest Percentage of Population Employed in Real Estate, Rental & Leasing in Pittsburgh
0.36%
7.1%
Zip Codes with the Highest Percentage of Population Employed in Real Estate, Rental & Leasing in Pittsburgh, PA
| Zip Code | % Employed | vs State | vs National | |
| 1. | 15233 | 7.1% | 1.5%(+5.56)#32 | 1.9%(+5.16)#722 |
| 2. | 15241 | 3.9% | 1.5%(+2.41)#81 | 1.9%(+2.01)#2,280 |
| 3. | 15220 | 3.0% | 1.5%(+1.47)#130 | 1.9%(+1.07)#4,000 |
| 4. | 15214 | 2.9% | 1.5%(+1.38)#139 | 1.9%(+0.984)#4,239 |
| 5. | 15224 | 2.7% | 1.5%(+1.18)#156 | 1.9%(+0.781)#4,837 |
| 6. | 15221 | 2.6% | 1.5%(+1.10)#164 | 1.9%(+0.696)#5,136 |
| 7. | 15226 | 2.4% | 1.5%(+0.922)#196 | 1.9%(+0.523)#5,833 |
| 8. | 15243 | 2.4% | 1.5%(+0.910)#198 | 1.9%(+0.511)#5,888 |
| 9. | 15203 | 2.3% | 1.5%(+0.789)#222 | 1.9%(+0.390)#6,390 |
| 10. | 15211 | 2.3% | 1.5%(+0.783)#223 | 1.9%(+0.384)#6,428 |
| 11. | 15235 | 2.2% | 1.5%(+0.666)#247 | 1.9%(+0.267)#7,024 |
| 12. | 15225 | 2.0% | 1.5%(+0.507)#278 | 1.9%(+0.108)#7,841 |
| 13. | 15216 | 2.0% | 1.5%(+0.489)#285 | 1.9%(+0.090)#7,940 |
| 14. | 15227 | 1.9% | 1.5%(+0.395)#309 | 1.9%(-0.004)#8,554 |
| 15. | 15205 | 1.9% | 1.5%(+0.392)#312 | 1.9%(-0.006)#8,574 |
| 16. | 15215 | 1.9% | 1.5%(+0.391)#313 | 1.9%(-0.008)#8,579 |
| 17. | 15238 | 1.8% | 1.5%(+0.337)#337 | 1.9%(-0.061)#8,929 |
| 18. | 15206 | 1.8% | 1.5%(+0.290)#358 | 1.9%(-0.109)#9,241 |
| 19. | 15208 | 1.8% | 1.5%(+0.269)#365 | 1.9%(-0.130)#9,364 |
| 20. | 15237 | 1.7% | 1.5%(+0.185)#397 | 1.9%(-0.214)#9,915 |
| 21. | 15228 | 1.7% | 1.5%(+0.180)#404 | 1.9%(-0.219)#9,957 |
| 22. | 15236 | 1.6% | 1.5%(+0.150)#413 | 1.9%(-0.249)#10,160 |
| 23. | 15239 | 1.5% | 1.5%(+0.051)#450 | 1.9%(-0.347)#10,829 |
| 24. | 15202 | 1.5% | 1.5%(+0.040)#456 | 1.9%(-0.359)#10,910 |
| 25. | 15223 | 1.5% | 1.5%(+0.037)#457 | 1.9%(-0.362)#10,938 |
| 26. | 15222 | 1.5% | 1.5%(+0.024)#461 | 1.9%(-0.375)#11,025 |
| 27. | 15217 | 1.4% | 1.5%(-0.091)#501 | 1.9%(-0.490)#11,963 |
| 28. | 15201 | 1.3% | 1.5%(-0.185)#542 | 1.9%(-0.584)#12,666 |
| 29. | 15204 | 1.3% | 1.5%(-0.221)#558 | 1.9%(-0.620)#12,939 |
| 30. | 15209 | 1.3% | 1.5%(-0.241)#564 | 1.9%(-0.640)#13,077 |
| 31. | 15212 | 1.2% | 1.5%(-0.267)#580 | 1.9%(-0.666)#13,277 |
| 32. | 15219 | 1.2% | 1.5%(-0.267)#581 | 1.9%(-0.666)#13,280 |
| 33. | 15234 | 1.2% | 1.5%(-0.275)#584 | 1.9%(-0.674)#13,352 |
| 34. | 15210 | 1.1% | 1.5%(-0.343)#620 | 1.9%(-0.742)#13,887 |
| 35. | 15232 | 0.90% | 1.5%(-0.589)#746 | 1.9%(-0.988)#15,932 |
| 36. | 15218 | 0.82% | 1.5%(-0.673)#787 | 1.9%(-1.07)#16,571 |
| 37. | 15207 | 0.62% | 1.5%(-0.871)#894 | 1.9%(-1.27)#18,099 |
| 38. | 15213 | 0.59% | 1.5%(-0.902)#916 | 1.9%(-1.30)#18,350 |
| 39. | 15229 | 0.57% | 1.5%(-0.921)#925 | 1.9%(-1.32)#18,502 |
| 40. | 15282 | 0.36% | 1.5%(-1.13)#1,030 | 1.9%(-1.53)#20,034 |
1
Common Questions
What are the Top 10 Zip Codes with the Highest Percentage of Population Employed in Real Estate, Rental & Leasing in Pittsburgh, PA?
Top 10 Zip Codes with the Highest Percentage of Population Employed in Real Estate, Rental & Leasing in Pittsburgh, PA are:
What zip code has the Highest Percentage of Population Employed in Real Estate, Rental & Leasing in Pittsburgh, PA?
15233 has the Highest Percentage of Population Employed in Real Estate, Rental & Leasing in Pittsburgh, PA with 7.1%.
What is the Percentage of Population Employed in Real Estate, Rental & Leasing in Pittsburgh, PA?
Percentage of Population Employed in Real Estate, Rental & Leasing in Pittsburgh is 1.7%.
What is the Percentage of Population Employed in Real Estate, Rental & Leasing in Pennsylvania?
Percentage of Population Employed in Real Estate, Rental & Leasing in Pennsylvania is 1.5%.
What is the Percentage of Population Employed in Real Estate, Rental & Leasing in the United States?
Percentage of Population Employed in Real Estate, Rental & Leasing in the United States is 1.9%.