Zip Codes with the Highest Percentage of Self-Employed / Not Incorporated in Pittsburgh, PA

RELATED REPORTS & OPTIONS

Self-Employed / Not Incorporated
Population
Families and Households
Female Fertility
Female Fertility (Unmarried)
Race (Community Size)
Race (Percentage)
Ancestry (Community Size)
AfghanAfricanAlbanianAlsatianAmericanApacheArabArgentineanArmenianAustralianAustrianBahamianBarbadianBasqueBelgianBhutaneseBlackfeetBolivianBrazilianBritishBritish West IndianBulgarianBurmeseCajunCambodianCanadianCape VerdeanCarpatho RusynCelticCentral AmericanCentral American IndianCherokeeChickasawChileanChippewaChoctawColombianComancheCosta RicanCreekCroatianCubanCypriotCzechCzechoslovakianDanishDelawareDominicanDutchEastern EuropeanEcuadorianEgyptianEnglishEthiopianEuropeanFilipinoFinnishFrenchFrench American IndianFrench CanadianGermanGhanaianGreekGuamanian / ChamorroGuatemalanGuyaneseHaitianHonduranHungarianIndian (Asian)IndonesianIranianIraqiIrishIroquoisIsraeliItalianJamaicanJapaneseJordanianKenyanKoreanLaotianLatvianLebaneseLiberianLithuanianLumbeeLuxembourgerMacedonianMalaysianMalteseMexicanMexican American IndianMongolianMoroccanNative HawaiianNavajoNew ZealanderNicaraguanNigerianNorthern EuropeanNorwegianPakistaniPalestinianPanamanianParaguayanPennsylvania GermanPeruvianPolishPortuguesePuerto RicanRomanianRussianSalvadoranSamoanScandinavianScotch-IrishScottishSeminoleSerbianSiouxSlavicSlovakSloveneSouth AfricanSouth AmericanSouth American IndianSoviet UnionSpaniardSpanishSri LankanSubsaharan AfricanSudaneseSwedishSwissSyrianThaiTrinidadian and TobagonianTurkishU.S. Virgin IslanderUgandanUkrainianUruguayanVenezuelanVietnameseWelshWest IndianYugoslavian
Ancestry (Percentage)
AfghanAfricanAlbanianAlsatianAmericanApacheArabArgentineanArmenianAustralianAustrianBahamianBarbadianBasqueBelgianBhutaneseBlackfeetBolivianBrazilianBritishBritish West IndianBulgarianBurmeseCajunCambodianCanadianCape VerdeanCarpatho RusynCelticCentral AmericanCentral American IndianCherokeeChickasawChileanChippewaChoctawColombianComancheCosta RicanCreekCroatianCubanCypriotCzechCzechoslovakianDanishDelawareDominicanDutchEastern EuropeanEcuadorianEgyptianEnglishEthiopianEuropeanFilipinoFinnishFrenchFrench American IndianFrench CanadianGermanGhanaianGreekGuamanian / ChamorroGuatemalanGuyaneseHaitianHonduranHungarianIndian (Asian)IndonesianIranianIraqiIrishIroquoisIsraeliItalianJamaicanJapaneseJordanianKenyanKoreanLaotianLatvianLebaneseLiberianLithuanianLumbeeLuxembourgerMacedonianMalaysianMalteseMexicanMexican American IndianMongolianMoroccanNative HawaiianNavajoNew ZealanderNicaraguanNigerianNorthern EuropeanNorwegianPakistaniPalestinianPanamanianParaguayanPennsylvania GermanPeruvianPolishPortuguesePuerto RicanRomanianRussianSalvadoranSamoanScandinavianScotch-IrishScottishSeminoleSerbianSiouxSlavicSlovakSloveneSouth AfricanSouth AmericanSouth American IndianSoviet UnionSpaniardSpanishSri LankanSubsaharan AfricanSudaneseSwedishSwissSyrianThaiTrinidadian and TobagonianTurkishU.S. Virgin IslanderUgandanUkrainianUruguayanVenezuelanVietnameseWelshWest IndianYugoslavian
Immigrant Origin (Total)
AfghanistanAfricaAlbaniaArgentinaAsiaAustraliaAustriaBahamasBangladeshBelarusBelgiumBoliviaBosnia and HerzegovinaBrazilBulgariaBurma / MyanmarCambodiaCameroonCanadaCaribbeanCentral AmericaChileChinaColombiaCongoCosta RicaCroatiaCubaCzechoslovakiaDenmarkDominican RepublicEastern AfricaEastern AsiaEastern EuropeEcuadorEgyptEl SalvadorEnglandEritreaEthiopiaEuropeFranceGermanyGhanaGreeceGuatemalaGuyanaHaitiHondurasHong KongHungaryIndiaIndonesiaIranIraqIrelandIsraelItalyJamaicaJapanJordanKazakhstanKenyaKoreaKuwaitLatin AmericaLatviaLebanonLiberiaLithuaniaMalaysiaMexicoMiddle AfricaMoldovaMoroccoNepalNetherlandsNigeriaNorthern AfricaNorthern EuropeNorwayOceaniaPakistanPanamaPeruPhilippinesPolandPortugalRomaniaRussiaSaudi ArabiaScotlandSerbiaSingaporeSouth AfricaSouth AmericaSouth Central AsiaSouth Eastern AsiaSouthern EuropeSpainSri LankaSudanSwedenSwitzerlandSyriaTaiwanThailandTrinidad and TobagoTurkeyUgandaUkraineUzbekistanVenezuelaVietnamWestern AfricaWestern AsiaWestern EuropeZaire
Immigrant Origin (Percentage)
AfghanistanAfricaAlbaniaArgentinaAsiaAustraliaAustriaBahamasBangladeshBelarusBelgiumBoliviaBosnia and HerzegovinaBrazilBulgariaBurma / MyanmarCambodiaCameroonCanadaCaribbeanCentral AmericaChileChinaColombiaCongoCosta RicaCroatiaCubaCzechoslovakiaDenmarkDominican RepublicEastern AfricaEastern AsiaEastern EuropeEcuadorEgyptEl SalvadorEnglandEritreaEthiopiaEuropeFranceGermanyGhanaGreeceGuatemalaGuyanaHaitiHondurasHong KongHungaryIndiaIndonesiaIranIraqIrelandIsraelItalyJamaicaJapanJordanKazakhstanKenyaKoreaKuwaitLatin AmericaLatviaLebanonLiberiaLithuaniaMalaysiaMexicoMiddle AfricaMoldovaMoroccoNepalNetherlandsNigeriaNorthern AfricaNorthern EuropeNorwayOceaniaPakistanPanamaPeruPhilippinesPolandPortugalRomaniaRussiaSaudi ArabiaScotlandSerbiaSingaporeSouth AfricaSouth AmericaSouth Central AsiaSouth Eastern AsiaSouthern EuropeSpainSri LankaSudanSwedenSwitzerlandSyriaTaiwanThailandTrinidad and TobagoTurkeyUgandaUkraineUzbekistanVenezuelaVietnamWestern AfricaWestern AsiaWestern EuropeZaire
Income
Income (Families)
Income (Households)
Poverty
Poverty (Families)
Unemployment
Employment Occupations
Employment Industries
Employer Class
Commute Time
Commute Means
School Enrollment
Education by Degree Field
Occupancy
Finances
Physical Characteristics
Pittsburgh
Compare Zip Codes
Comparison Subject

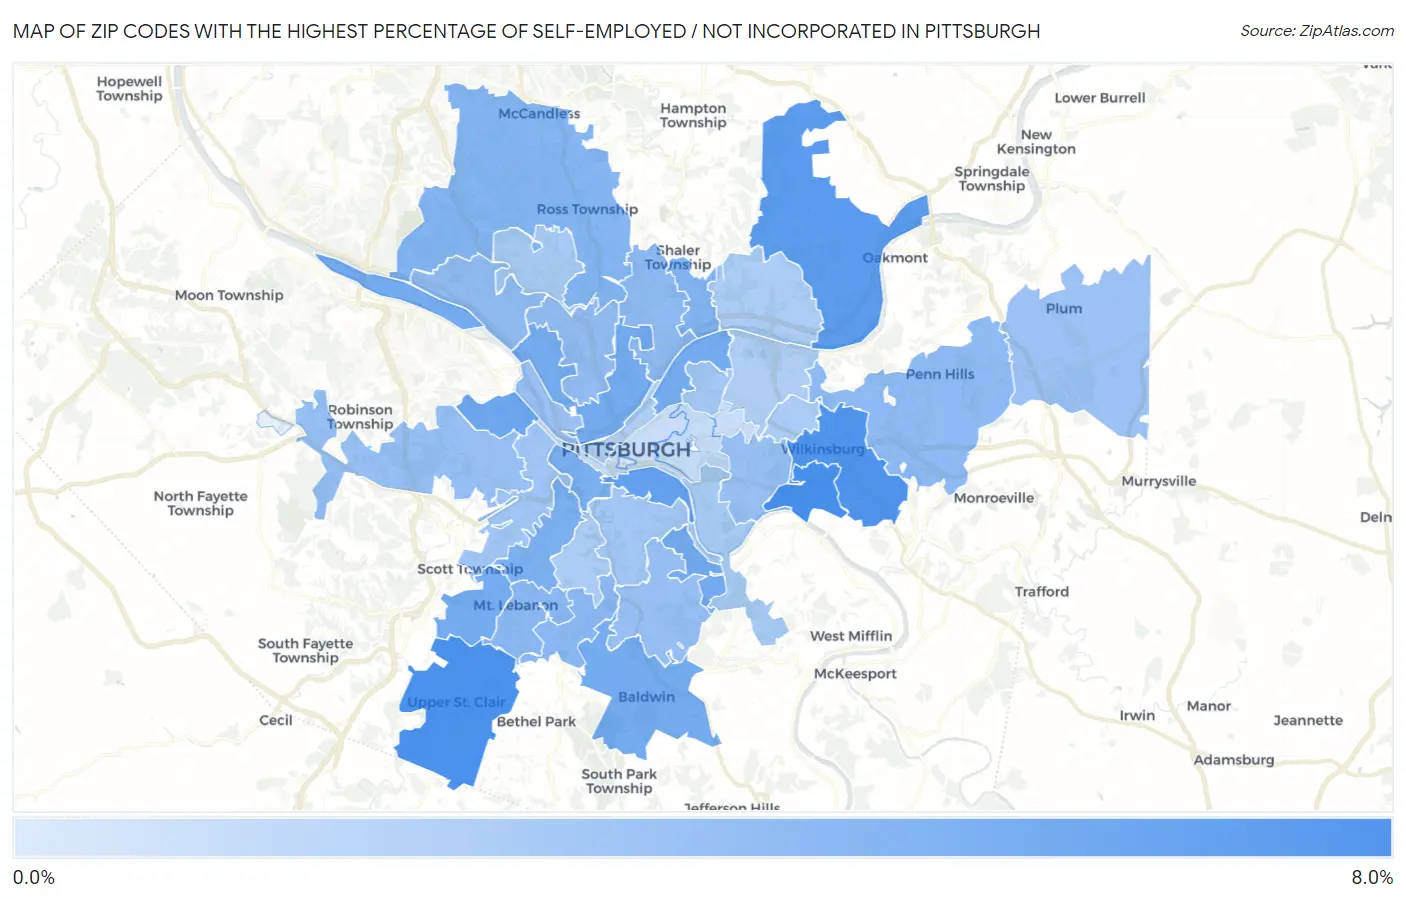
Map of Zip Codes with the Highest Percentage of Self-Employed / Not Incorporated in Pittsburgh

0.0%
8.0%
Zip Codes with the Highest Percentage of Self-Employed / Not Incorporated in Pittsburgh Map

Zip Codes with the Highest Percentage of Self-Employed / Not Incorporated in Pittsburgh, PA

Zip Code % Self-Employed / Not Incorporated vs State vs National
1.152186.6%4.9%(+1.70)#5085.8%(+0.780)#14,146
2.152416.4%4.9%(+1.49)#5445.8%(+0.568)#14,830
3.152216.2%4.9%(+1.30)#5765.8%(+0.377)#15,444
4.152385.8%4.9%(+0.880)#6345.8%(-0.041)#16,781
5.152035.5%4.9%(+0.572)#6955.8%(-0.349)#17,885
6.152045.1%4.9%(+0.166)#7815.8%(-0.755)#19,438
7.152434.8%4.9%(-0.080)#8365.8%(-1.00)#20,358
8.152124.8%4.9%(-0.083)#8375.8%(-1.00)#20,367
9.152014.8%4.9%(-0.097)#8395.8%(-1.02)#20,419
10.152254.8%4.9%(-0.103)#8435.8%(-1.02)#20,449
11.152364.8%4.9%(-0.107)#8455.8%(-1.03)#20,464
12.152164.5%4.9%(-0.348)#9025.8%(-1.27)#21,375
13.152114.5%4.9%(-0.395)#9215.8%(-1.32)#21,580
14.152234.3%4.9%(-0.588)#9745.8%(-1.51)#22,289
15.152374.2%4.9%(-0.691)#9975.8%(-1.61)#22,670
16.152284.0%4.9%(-0.848)#1,0345.8%(-1.77)#23,225
17.152344.0%4.9%(-0.905)#1,0525.8%(-1.83)#23,427
18.152353.9%4.9%(-1.02)#1,0845.8%(-1.94)#23,824
19.152093.8%4.9%(-1.10)#1,1105.8%(-2.02)#24,084
20.152023.8%4.9%(-1.14)#1,1195.8%(-2.06)#24,221
21.152143.6%4.9%(-1.28)#1,1455.8%(-2.20)#24,647
22.152053.5%4.9%(-1.37)#1,1625.8%(-2.29)#24,929
23.152173.5%4.9%(-1.38)#1,1645.8%(-2.30)#24,936
24.152273.4%4.9%(-1.45)#1,1895.8%(-2.37)#25,190
25.152333.4%4.9%(-1.49)#1,1985.8%(-2.41)#25,301
26.152393.4%4.9%(-1.53)#1,2135.8%(-2.45)#25,409
27.152203.1%4.9%(-1.80)#1,2545.8%(-2.72)#26,125
28.152243.0%4.9%(-1.87)#1,2695.8%(-2.79)#26,314
29.152103.0%4.9%(-1.88)#1,2715.8%(-2.80)#26,330
30.152072.9%4.9%(-2.02)#1,3075.8%(-2.94)#26,672
31.152292.8%4.9%(-2.06)#1,3135.8%(-2.98)#26,743
32.152082.8%4.9%(-2.08)#1,3195.8%(-3.00)#26,797
33.152262.7%4.9%(-2.16)#1,3305.8%(-3.08)#26,962
34.152152.7%4.9%(-2.16)#1,3315.8%(-3.08)#26,970
35.152062.6%4.9%(-2.25)#1,3445.8%(-3.17)#27,138
36.152222.6%4.9%(-2.30)#1,3545.8%(-3.22)#27,244
37.152131.7%4.9%(-3.16)#1,4475.8%(-4.08)#28,512
38.152321.6%4.9%(-3.30)#1,4575.8%(-4.22)#28,641
39.152191.5%4.9%(-3.35)#1,4615.8%(-4.27)#28,696
40.152820.88%4.9%(-4.01)#1,5015.8%(-4.93)#29,193

Common Questions

What are the Top 10 Zip Codes with the Highest Percentage of Self-Employed / Not Incorporated in Pittsburgh, PA?
Top 10 Zip Codes with the Highest Percentage of Self-Employed / Not Incorporated in Pittsburgh, PA are:
#1
6.6%
#2
6.4%
#3
6.2%
#4
5.8%
#5
5.5%
#6
5.1%
#7
4.8%
#8
4.8%
#9
4.8%
#10
4.8%
What zip code has the Highest Percentage of Self-Employed / Not Incorporated in Pittsburgh, PA?
15218 has the Highest Percentage of Self-Employed / Not Incorporated in Pittsburgh, PA with 6.6%.
What is the Percentage of Self-Employed / Not Incorporated in Pittsburgh, PA?
Percentage of Self-Employed / Not Incorporated in Pittsburgh is 3.4%.
What is the Percentage of Self-Employed / Not Incorporated in Pennsylvania?
Percentage of Self-Employed / Not Incorporated in Pennsylvania is 4.9%.
What is the Percentage of Self-Employed / Not Incorporated in the United States?
Percentage of Self-Employed / Not Incorporated in the United States is 5.8%.