Zip Codes with the Highest Percentage of Population Employed in Installation, Maintenance & Repair in Pittsburgh, PA
RELATED REPORTS & OPTIONS
Installation, Maintenance & Repair
Pittsburgh
Compare Zip Codes
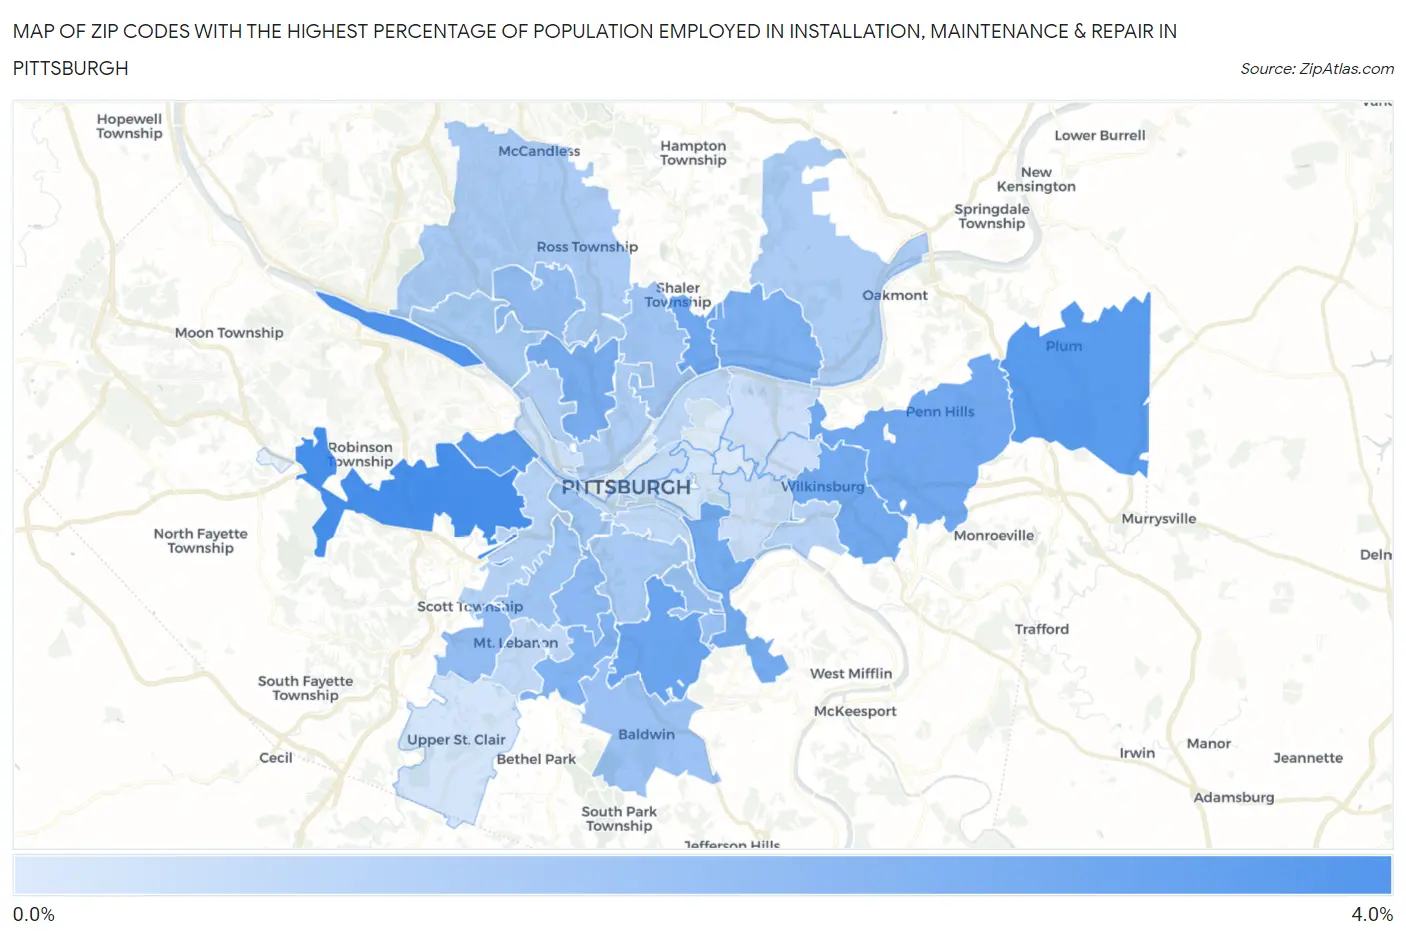
Map of Zip Codes with the Highest Percentage of Population Employed in Installation, Maintenance & Repair in Pittsburgh
0.38%
3.8%
Zip Codes with the Highest Percentage of Population Employed in Installation, Maintenance & Repair in Pittsburgh, PA
| Zip Code | % Employed | vs State | vs National | |
| 1. | 15205 | 3.8% | 3.1%(+0.701)#784 | 3.1%(+0.725)#13,261 |
| 2. | 15225 | 3.6% | 3.1%(+0.508)#849 | 3.1%(+0.532)#14,156 |
| 3. | 15239 | 3.4% | 3.1%(+0.330)#902 | 3.1%(+0.354)#14,988 |
| 4. | 15204 | 3.3% | 3.1%(+0.215)#930 | 3.1%(+0.239)#15,523 |
| 5. | 15227 | 3.0% | 3.1%(-0.128)#998 | 3.1%(-0.104)#17,173 |
| 6. | 15223 | 2.8% | 3.1%(-0.255)#1,031 | 3.1%(-0.230)#17,810 |
| 7. | 15235 | 2.8% | 3.1%(-0.260)#1,034 | 3.1%(-0.235)#17,833 |
| 8. | 15221 | 2.8% | 3.1%(-0.331)#1,048 | 3.1%(-0.307)#18,204 |
| 9. | 15207 | 2.7% | 3.1%(-0.384)#1,067 | 3.1%(-0.359)#18,499 |
| 10. | 15214 | 2.6% | 3.1%(-0.491)#1,091 | 3.1%(-0.466)#19,070 |
| 11. | 15215 | 2.6% | 3.1%(-0.513)#1,095 | 3.1%(-0.488)#19,177 |
| 12. | 15234 | 2.4% | 3.1%(-0.644)#1,124 | 3.1%(-0.619)#19,797 |
| 13. | 15226 | 2.2% | 3.1%(-0.865)#1,180 | 3.1%(-0.840)#20,944 |
| 14. | 15243 | 2.1% | 3.1%(-1.04)#1,214 | 3.1%(-1.01)#21,750 |
| 15. | 15229 | 2.0% | 3.1%(-1.06)#1,218 | 3.1%(-1.03)#21,841 |
| 16. | 15236 | 1.9% | 3.1%(-1.24)#1,255 | 3.1%(-1.21)#22,633 |
| 17. | 15216 | 1.8% | 3.1%(-1.31)#1,270 | 3.1%(-1.28)#22,959 |
| 18. | 15211 | 1.8% | 3.1%(-1.33)#1,275 | 3.1%(-1.30)#23,062 |
| 19. | 15209 | 1.7% | 3.1%(-1.37)#1,281 | 3.1%(-1.34)#23,225 |
| 20. | 15202 | 1.6% | 3.1%(-1.52)#1,305 | 3.1%(-1.49)#23,865 |
| 21. | 15210 | 1.6% | 3.1%(-1.52)#1,306 | 3.1%(-1.49)#23,874 |
| 22. | 15237 | 1.5% | 3.1%(-1.59)#1,318 | 3.1%(-1.56)#24,129 |
| 23. | 15238 | 1.5% | 3.1%(-1.62)#1,327 | 3.1%(-1.59)#24,254 |
| 24. | 15212 | 1.4% | 3.1%(-1.66)#1,339 | 3.1%(-1.63)#24,418 |
| 25. | 15220 | 1.3% | 3.1%(-1.83)#1,376 | 3.1%(-1.81)#25,035 |
| 26. | 15218 | 1.3% | 3.1%(-1.84)#1,378 | 3.1%(-1.81)#25,063 |
| 27. | 15201 | 1.1% | 3.1%(-1.98)#1,400 | 3.1%(-1.96)#25,556 |
| 28. | 15203 | 1.1% | 3.1%(-2.03)#1,406 | 3.1%(-2.00)#25,722 |
| 29. | 15228 | 1.0% | 3.1%(-2.08)#1,413 | 3.1%(-2.05)#25,897 |
| 30. | 15282 | 0.97% | 3.1%(-2.12)#1,424 | 3.1%(-2.10)#26,008 |
| 31. | 15219 | 0.89% | 3.1%(-2.20)#1,433 | 3.1%(-2.18)#26,223 |
| 32. | 15217 | 0.80% | 3.1%(-2.29)#1,440 | 3.1%(-2.26)#26,479 |
| 33. | 15206 | 0.78% | 3.1%(-2.31)#1,441 | 3.1%(-2.28)#26,549 |
| 34. | 15208 | 0.78% | 3.1%(-2.31)#1,442 | 3.1%(-2.29)#26,573 |
| 35. | 15233 | 0.68% | 3.1%(-2.41)#1,459 | 3.1%(-2.39)#26,833 |
| 36. | 15241 | 0.58% | 3.1%(-2.51)#1,471 | 3.1%(-2.49)#27,048 |
| 37. | 15213 | 0.57% | 3.1%(-2.53)#1,472 | 3.1%(-2.50)#27,077 |
| 38. | 15232 | 0.39% | 3.1%(-2.71)#1,489 | 3.1%(-2.68)#27,426 |
| 39. | 15224 | 0.38% | 3.1%(-2.71)#1,490 | 3.1%(-2.69)#27,439 |
1
Common Questions
What are the Top 10 Zip Codes with the Highest Percentage of Population Employed in Installation, Maintenance & Repair in Pittsburgh, PA?
Top 10 Zip Codes with the Highest Percentage of Population Employed in Installation, Maintenance & Repair in Pittsburgh, PA are:
What zip code has the Highest Percentage of Population Employed in Installation, Maintenance & Repair in Pittsburgh, PA?
15205 has the Highest Percentage of Population Employed in Installation, Maintenance & Repair in Pittsburgh, PA with 3.8%.
What is the Percentage of Population Employed in Installation, Maintenance & Repair in Pittsburgh, PA?
Percentage of Population Employed in Installation, Maintenance & Repair in Pittsburgh is 1.3%.
What is the Percentage of Population Employed in Installation, Maintenance & Repair in Pennsylvania?
Percentage of Population Employed in Installation, Maintenance & Repair in Pennsylvania is 3.1%.
What is the Percentage of Population Employed in Installation, Maintenance & Repair in the United States?
Percentage of Population Employed in Installation, Maintenance & Repair in the United States is 3.1%.