Zip Codes with the Most Immigrants from Oceania in Pittsburgh, PA
RELATED REPORTS & OPTIONS
Oceania
Pittsburgh
Compare Zip Codes
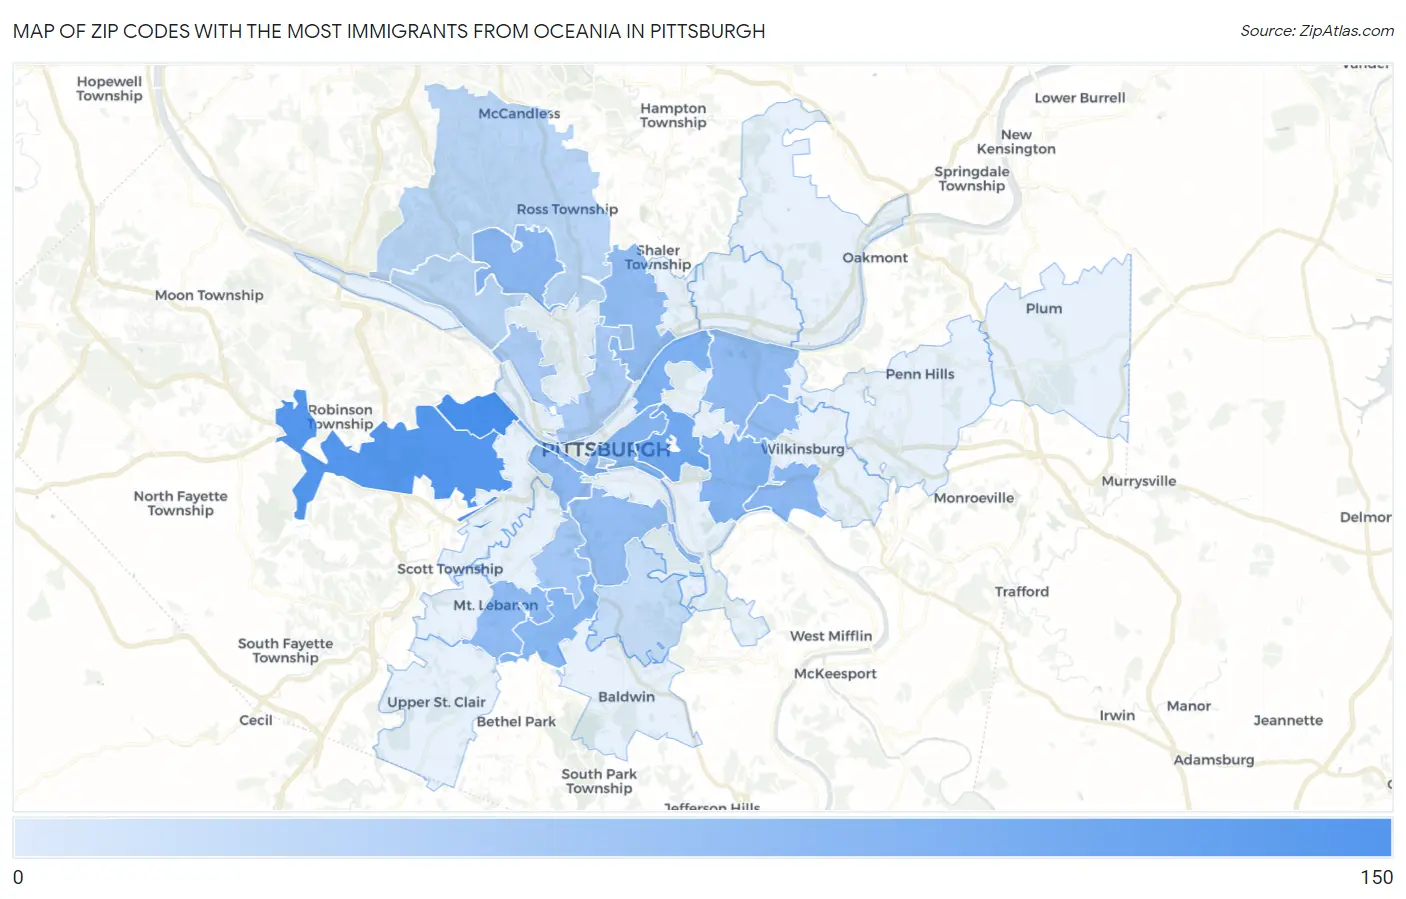
Map of Zip Codes with the Most Immigrants from Oceania in Pittsburgh
1
112
Zip Codes with the Most Immigrants from Oceania in Pittsburgh, PA
| Zip Code | Oceania | vs State | vs National | |
| 1. | 15204 | 112 | 3,690(3.04%)#3 | 293,459(0.04%)#585 |
| 2. | 15205 | 71 | 3,690(1.92%)#9 | 293,459(0.02%)#966 |
| 3. | 15213 | 29 | 3,690(0.79%)#40 | 293,459(0.01%)#2,163 |
| 4. | 15201 | 19 | 3,690(0.51%)#58 | 293,459(0.01%)#2,874 |
| 5. | 15217 | 15 | 3,690(0.41%)#74 | 293,459(0.01%)#3,261 |
| 6. | 15219 | 15 | 3,690(0.41%)#77 | 293,459(0.01%)#3,307 |
| 7. | 15234 | 14 | 3,690(0.38%)#80 | 293,459(0.00%)#3,420 |
| 8. | 15229 | 13 | 3,690(0.35%)#83 | 293,459(0.00%)#3,546 |
| 9. | 15218 | 13 | 3,690(0.35%)#86 | 293,459(0.00%)#3,556 |
| 10. | 15211 | 12 | 3,690(0.33%)#94 | 293,459(0.00%)#3,717 |
| 11. | 15228 | 11 | 3,690(0.30%)#96 | 293,459(0.00%)#3,846 |
| 12. | 15206 | 10 | 3,690(0.27%)#104 | 293,459(0.00%)#3,981 |
| 13. | 15209 | 10 | 3,690(0.27%)#109 | 293,459(0.00%)#4,030 |
| 14. | 15208 | 10 | 3,690(0.27%)#110 | 293,459(0.00%)#4,048 |
| 15. | 15210 | 9 | 3,690(0.24%)#114 | 293,459(0.00%)#4,146 |
| 16. | 15226 | 5 | 3,690(0.14%)#151 | 293,459(0.00%)#4,929 |
| 17. | 15212 | 4 | 3,690(0.11%)#158 | 293,459(0.00%)#5,054 |
| 18. | 15237 | 2 | 3,690(0.05%)#170 | 293,459(0.00%)#5,343 |
| 19. | 15202 | 2 | 3,690(0.05%)#171 | 293,459(0.00%)#5,363 |
| 20. | 15282 | 2 | 3,690(0.05%)#172 | 293,459(0.00%)#5,396 |
| 21. | 15227 | 1 | 3,690(0.03%)#181 | 293,459(0.00%)#5,512 |
1
Common Questions
What are the Top 10 Zip Codes with the Most Immigrants from Oceania in Pittsburgh, PA?
Top 10 Zip Codes with the Most Immigrants from Oceania in Pittsburgh, PA are:
What zip code has the Most Immigrants from Oceania in Pittsburgh, PA?
15204 has the Most Immigrants from Oceania in Pittsburgh, PA with 112.
What is the Total Immigrants from Oceania in Pittsburgh, PA?
Total Immigrants from Oceania in Pittsburgh is 242.
What is the Total Immigrants from Oceania in Pennsylvania?
Total Immigrants from Oceania in Pennsylvania is 3,690.
What is the Total Immigrants from Oceania in the United States?
Total Immigrants from Oceania in the United States is 293,459.