Zip Codes with the Highest Percentage of Population with a Degree in Liberal Arts and History in Pittsburgh, PA
RELATED REPORTS & OPTIONS
Liberal Arts and History
Pittsburgh
Compare Zip Codes
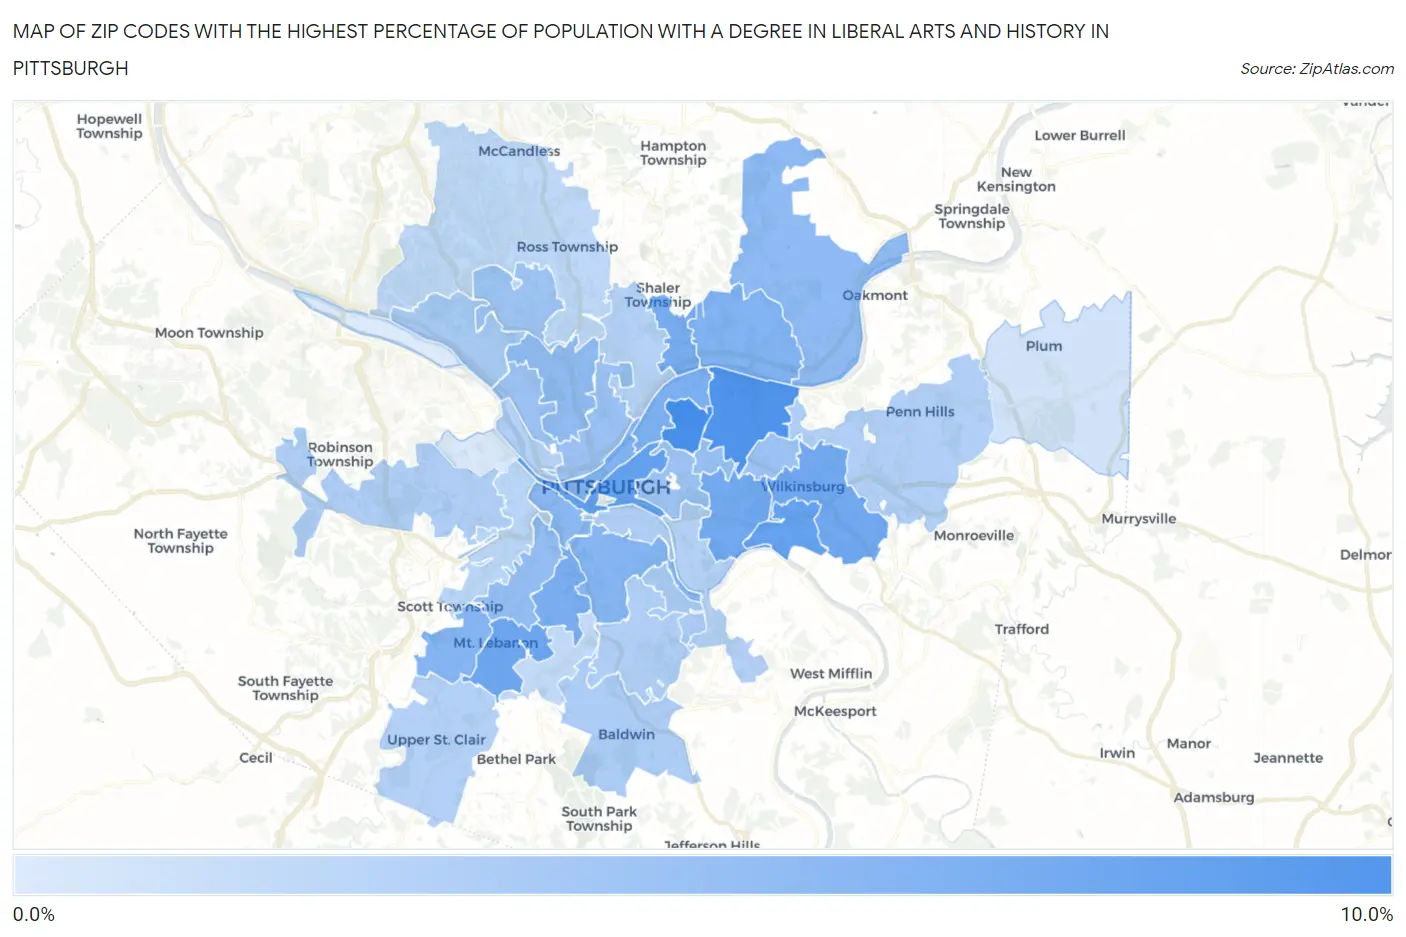
Map of Zip Codes with the Highest Percentage of Population with a Degree in Liberal Arts and History in Pittsburgh
1.6%
9.1%
Zip Codes with the Highest Percentage of Population with a Degree in Liberal Arts and History in Pittsburgh, PA
| Zip Code | % Graduates | vs State | vs National | |
| 1. | 15224 | 9.1% | 4.6%(+4.53)#186 | 4.9%(+4.26)#3,721 |
| 2. | 15206 | 8.7% | 4.6%(+4.08)#205 | 4.9%(+3.81)#4,143 |
| 3. | 15218 | 7.6% | 4.6%(+2.96)#265 | 4.9%(+2.70)#5,487 |
| 4. | 15219 | 7.5% | 4.6%(+2.94)#267 | 4.9%(+2.68)#5,512 |
| 5. | 15228 | 7.1% | 4.6%(+2.54)#297 | 4.9%(+2.28)#6,134 |
| 6. | 15221 | 7.0% | 4.6%(+2.43)#303 | 4.9%(+2.17)#6,315 |
| 7. | 15217 | 6.9% | 4.6%(+2.33)#312 | 4.9%(+2.06)#6,502 |
| 8. | 15223 | 6.7% | 4.6%(+2.07)#335 | 4.9%(+1.81)#6,986 |
| 9. | 15226 | 6.6% | 4.6%(+1.97)#348 | 4.9%(+1.71)#7,189 |
| 10. | 15201 | 6.4% | 4.6%(+1.79)#371 | 4.9%(+1.53)#7,555 |
| 11. | 15222 | 6.2% | 4.6%(+1.59)#395 | 4.9%(+1.33)#8,020 |
| 12. | 15215 | 6.2% | 4.6%(+1.55)#401 | 4.9%(+1.29)#8,121 |
| 13. | 15243 | 6.0% | 4.6%(+1.40)#422 | 4.9%(+1.14)#8,492 |
| 14. | 15210 | 5.9% | 4.6%(+1.30)#434 | 4.9%(+1.04)#8,750 |
| 15. | 15211 | 5.7% | 4.6%(+1.12)#460 | 4.9%(+0.859)#9,213 |
| 16. | 15238 | 5.5% | 4.6%(+0.877)#494 | 4.9%(+0.614)#9,902 |
| 17. | 15214 | 5.4% | 4.6%(+0.778)#505 | 4.9%(+0.515)#10,166 |
| 18. | 15216 | 5.2% | 4.6%(+0.603)#526 | 4.9%(+0.341)#10,688 |
| 19. | 15232 | 5.2% | 4.6%(+0.579)#532 | 4.9%(+0.317)#10,753 |
| 20. | 15208 | 4.9% | 4.6%(+0.257)#591 | 4.9%(-0.006)#11,766 |
| 21. | 15213 | 4.8% | 4.6%(+0.191)#600 | 4.9%(-0.071)#11,963 |
| 22. | 15212 | 4.8% | 4.6%(+0.162)#605 | 4.9%(-0.100)#12,057 |
| 23. | 15229 | 4.6% | 4.6%(+0.026)#626 | 4.9%(-0.236)#12,530 |
| 24. | 15202 | 4.2% | 4.6%(-0.432)#711 | 4.9%(-0.694)#14,107 |
| 25. | 15236 | 4.0% | 4.6%(-0.615)#745 | 4.9%(-0.878)#14,808 |
| 26. | 15205 | 3.9% | 4.6%(-0.701)#759 | 4.9%(-0.964)#15,144 |
| 27. | 15203 | 3.8% | 4.6%(-0.776)#773 | 4.9%(-1.04)#15,400 |
| 28. | 15227 | 3.8% | 4.6%(-0.828)#783 | 4.9%(-1.09)#15,594 |
| 29. | 15235 | 3.8% | 4.6%(-0.841)#787 | 4.9%(-1.10)#15,643 |
| 30. | 15241 | 3.7% | 4.6%(-0.925)#797 | 4.9%(-1.19)#15,966 |
| 31. | 15207 | 3.7% | 4.6%(-0.931)#798 | 4.9%(-1.19)#15,975 |
| 32. | 15209 | 3.6% | 4.6%(-1.04)#815 | 4.9%(-1.30)#16,358 |
| 33. | 15233 | 3.5% | 4.6%(-1.06)#817 | 4.9%(-1.32)#16,412 |
| 34. | 15220 | 3.3% | 4.6%(-1.27)#860 | 4.9%(-1.54)#17,177 |
| 35. | 15237 | 3.1% | 4.6%(-1.53)#906 | 4.9%(-1.79)#18,049 |
| 36. | 15234 | 3.0% | 4.6%(-1.58)#919 | 4.9%(-1.85)#18,265 |
| 37. | 15239 | 2.2% | 4.6%(-2.37)#1,052 | 4.9%(-2.63)#20,716 |
| 38. | 15204 | 1.9% | 4.6%(-2.71)#1,106 | 4.9%(-2.97)#21,622 |
| 39. | 15225 | 1.6% | 4.6%(-2.97)#1,150 | 4.9%(-3.23)#22,213 |
1
Common Questions
What are the Top 10 Zip Codes with the Highest Percentage of Population with a Degree in Liberal Arts and History in Pittsburgh, PA?
Top 10 Zip Codes with the Highest Percentage of Population with a Degree in Liberal Arts and History in Pittsburgh, PA are:
What zip code has the Highest Percentage of Population with a Degree in Liberal Arts and History in Pittsburgh, PA?
15224 has the Highest Percentage of Population with a Degree in Liberal Arts and History in Pittsburgh, PA with 9.1%.
What is the Percentage of Population with a Degree in Liberal Arts and History in Pittsburgh, PA?
Percentage of Population with a Degree in Liberal Arts and History in Pittsburgh is 6.2%.
What is the Percentage of Population with a Degree in Liberal Arts and History in Pennsylvania?
Percentage of Population with a Degree in Liberal Arts and History in Pennsylvania is 4.6%.
What is the Percentage of Population with a Degree in Liberal Arts and History in the United States?
Percentage of Population with a Degree in Liberal Arts and History in the United States is 4.9%.