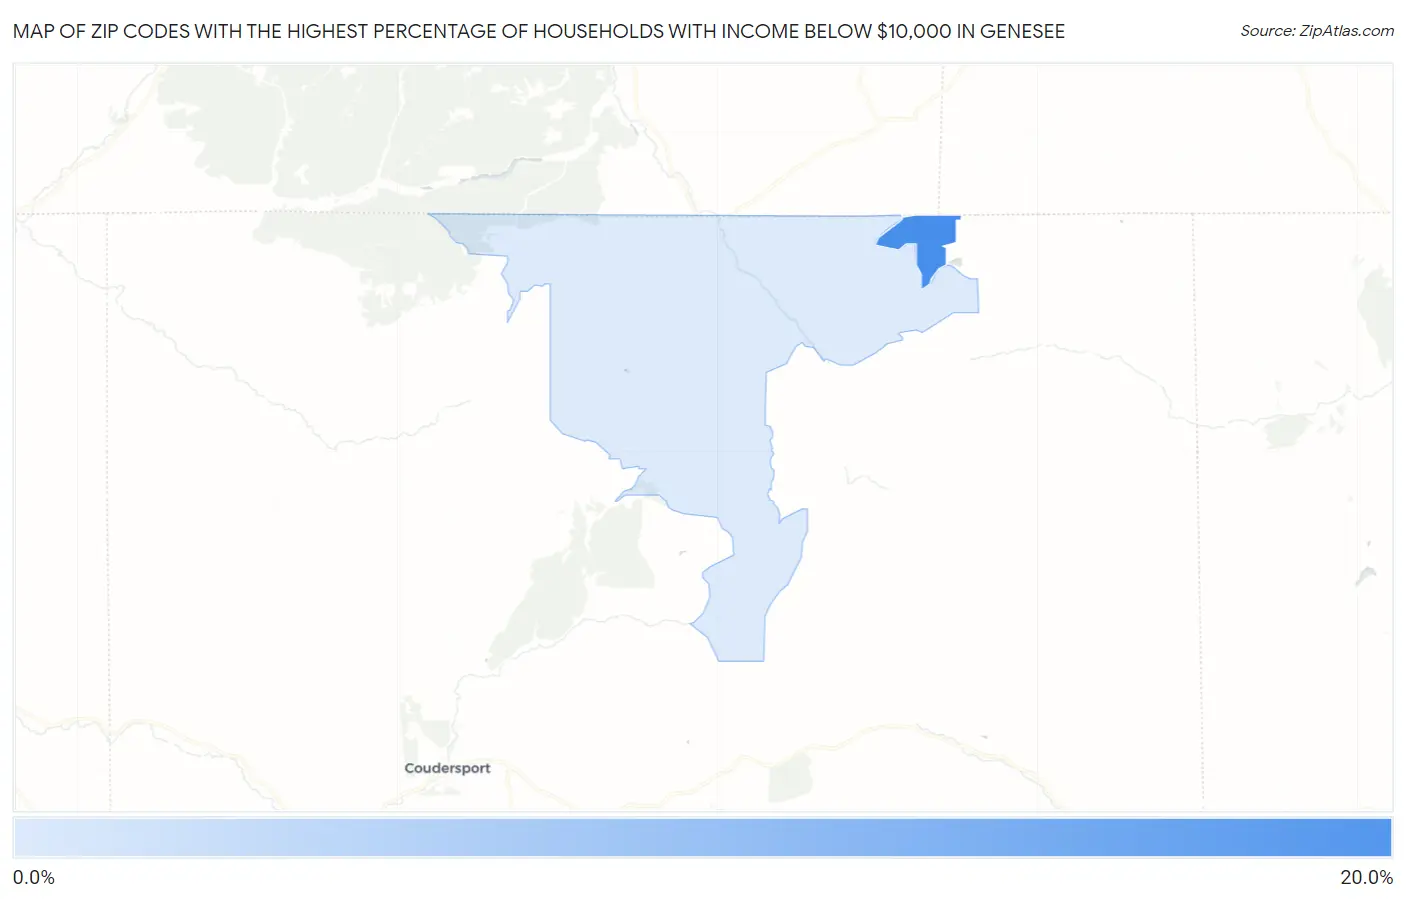
Zip Codes with the Highest Percentage of Households with Income Below $10,000 in Genesee, PA
RELATED REPORTS & OPTIONS
Household Income | $0-10k
Genesee
Compare Zip Codes
Map of Zip Codes with the Highest Percentage of Households with Income Below $10,000 in Genesee
4.4%
16.0%
Zip Codes with the Highest Percentage of Households with Income Below $10,000 in Genesee, PA
| Zip Code | Households with Income < $10k | vs State | vs National | |
| 1. | 16941 | 16.0% | 4.8%(+11.2)#45 | 4.9%(+11.1)#1,353 |
| 2. | 16923 | 4.4% | 4.8%(-0.400)#610 | 4.9%(-0.500)#13,940 |
1
Common Questions
What are the Top Zip Codes with the Highest Percentage of Households with Income Below $10,000 in Genesee, PA?
Top Zip Codes with the Highest Percentage of Households with Income Below $10,000 in Genesee, PA are:
What zip code has the Highest Percentage of Households with Income Below $10,000 in Genesee, PA?
16941 has the Highest Percentage of Households with Income Below $10,000 in Genesee, PA with 16.0%.
What is the Percentage of Households with Income Below $10,000 in Pennsylvania?
Percentage of Households with Income Below $10,000 in Pennsylvania is 4.8%.
What is the Percentage of Households with Income Below $10,000 in the United States?
Percentage of Households with Income Below $10,000 in the United States is 4.9%.