Zip Codes with the Highest Percentage of Households with Income Above $200,000 in Pittsburgh, PA
RELATED REPORTS & OPTIONS
Household Income | $200k+
Pittsburgh
Compare Zip Codes
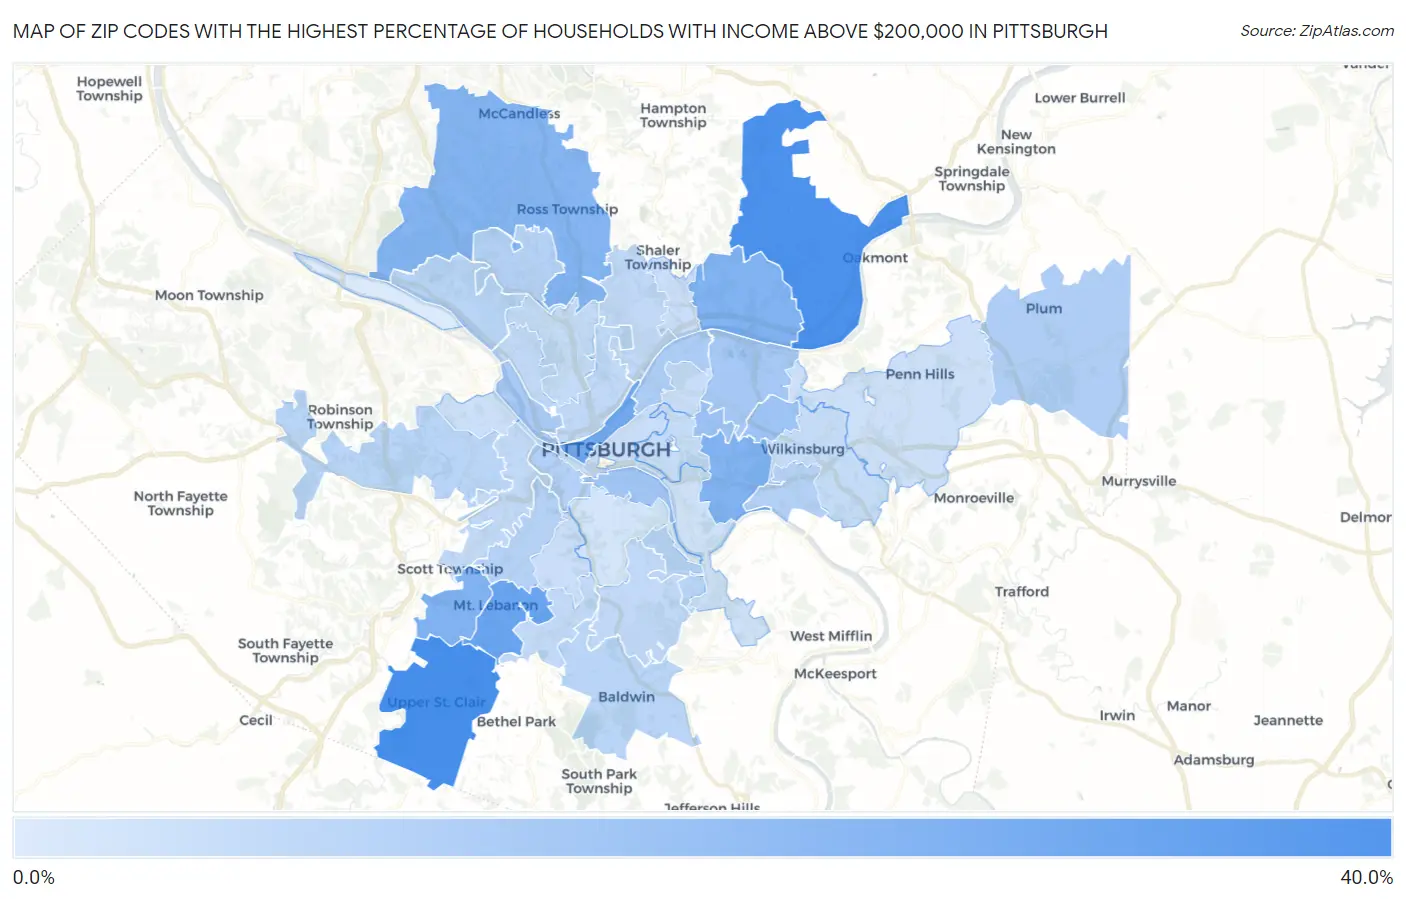
Map of Zip Codes with the Highest Percentage of Households with Income Above $200,000 in Pittsburgh
0.60%
32.8%
Zip Codes with the Highest Percentage of Households with Income Above $200,000 in Pittsburgh, PA
| Zip Code | Households with Income > $200k | vs State | vs National | |
| 1. | 15241 | 32.8% | 10.2%(+22.6)#59 | 11.4%(+21.4)#1,167 |
| 2. | 15238 | 31.9% | 10.2%(+21.7)#62 | 11.4%(+20.5)#1,251 |
| 3. | 15228 | 24.6% | 10.2%(+14.4)#100 | 11.4%(+13.2)#2,264 |
| 4. | 15222 | 22.5% | 10.2%(+12.3)#119 | 11.4%(+11.1)#2,682 |
| 5. | 15217 | 19.5% | 10.2%(+9.30)#146 | 11.4%(+8.10)#3,425 |
| 6. | 15215 | 19.5% | 10.2%(+9.30)#147 | 11.4%(+8.10)#3,435 |
| 7. | 15243 | 19.4% | 10.2%(+9.20)#151 | 11.4%(+8.00)#3,469 |
| 8. | 15237 | 18.2% | 10.2%(+8.00)#163 | 11.4%(+6.80)#3,774 |
| 9. | 15232 | 13.5% | 10.2%(+3.30)#239 | 11.4%(+2.10)#5,750 |
| 10. | 15208 | 12.9% | 10.2%(+2.70)#257 | 11.4%(+1.50)#6,089 |
| 11. | 15203 | 12.3% | 10.2%(+2.10)#278 | 11.4%(+0.900)#6,477 |
| 12. | 15206 | 11.4% | 10.2%(+1.20)#305 | 11.4%(=0.000)#7,079 |
| 13. | 15233 | 10.6% | 10.2%(+0.400)#350 | 11.4%(-0.800)#7,741 |
| 14. | 15201 | 10.1% | 10.2%(-0.100)#369 | 11.4%(-1.30)#8,159 |
| 15. | 15239 | 9.4% | 10.2%(-0.800)#392 | 11.4%(-2.00)#8,852 |
| 16. | 15218 | 8.7% | 10.2%(-1.50)#446 | 11.4%(-2.70)#9,551 |
| 17. | 15211 | 8.6% | 10.2%(-1.60)#452 | 11.4%(-2.80)#9,665 |
| 18. | 15216 | 8.4% | 10.2%(-1.80)#466 | 11.4%(-3.00)#9,878 |
| 19. | 15229 | 8.4% | 10.2%(-1.80)#468 | 11.4%(-3.00)#9,888 |
| 20. | 15202 | 7.3% | 10.2%(-2.90)#545 | 11.4%(-4.10)#11,355 |
| 21. | 15205 | 7.2% | 10.2%(-3.00)#555 | 11.4%(-4.20)#11,503 |
| 22. | 15236 | 7.1% | 10.2%(-3.10)#562 | 11.4%(-4.30)#11,633 |
| 23. | 15220 | 6.1% | 10.2%(-4.10)#636 | 11.4%(-5.30)#13,281 |
| 24. | 15209 | 6.1% | 10.2%(-4.10)#638 | 11.4%(-5.30)#13,289 |
| 25. | 15227 | 6.0% | 10.2%(-4.20)#645 | 11.4%(-5.40)#13,446 |
| 26. | 15234 | 6.0% | 10.2%(-4.20)#647 | 11.4%(-5.40)#13,478 |
| 27. | 15212 | 5.7% | 10.2%(-4.50)#684 | 11.4%(-5.70)#14,074 |
| 28. | 15213 | 5.1% | 10.2%(-5.10)#745 | 11.4%(-6.30)#15,318 |
| 29. | 15214 | 5.1% | 10.2%(-5.10)#746 | 11.4%(-6.30)#15,351 |
| 30. | 15221 | 5.0% | 10.2%(-5.20)#762 | 11.4%(-6.40)#15,578 |
| 31. | 15224 | 4.5% | 10.2%(-5.70)#823 | 11.4%(-6.90)#16,816 |
| 32. | 15226 | 4.1% | 10.2%(-6.10)#884 | 11.4%(-7.30)#17,870 |
| 33. | 15223 | 4.0% | 10.2%(-6.20)#904 | 11.4%(-7.40)#18,175 |
| 34. | 15219 | 3.9% | 10.2%(-6.30)#921 | 11.4%(-7.50)#18,396 |
| 35. | 15235 | 3.8% | 10.2%(-6.40)#936 | 11.4%(-7.60)#18,595 |
| 36. | 15204 | 3.7% | 10.2%(-6.50)#959 | 11.4%(-7.70)#18,940 |
| 37. | 15207 | 3.4% | 10.2%(-6.80)#999 | 11.4%(-8.00)#19,749 |
| 38. | 15210 | 2.2% | 10.2%(-8.00)#1,203 | 11.4%(-9.20)#23,180 |
| 39. | 15225 | 0.60% | 10.2%(-9.60)#1,426 | 11.4%(-10.8)#27,034 |
1
Common Questions
What are the Top 10 Zip Codes with the Highest Percentage of Households with Income Above $200,000 in Pittsburgh, PA?
Top 10 Zip Codes with the Highest Percentage of Households with Income Above $200,000 in Pittsburgh, PA are:
What zip code has the Highest Percentage of Households with Income Above $200,000 in Pittsburgh, PA?
15241 has the Highest Percentage of Households with Income Above $200,000 in Pittsburgh, PA with 32.8%.
What is the Percentage of Households with Income Above $200,000 in Pittsburgh, PA?
Percentage of Households with Income Above $200,000 in Pittsburgh is 8.4%.
What is the Percentage of Households with Income Above $200,000 in Pennsylvania?
Percentage of Households with Income Above $200,000 in Pennsylvania is 10.2%.
What is the Percentage of Households with Income Above $200,000 in the United States?
Percentage of Households with Income Above $200,000 in the United States is 11.4%.