Zip Codes with the Highest Percentage of Population Employed in Food Preparation & Serving in Pittsburgh, PA
RELATED REPORTS & OPTIONS
Food Preparation & Serving
Pittsburgh
Compare Zip Codes
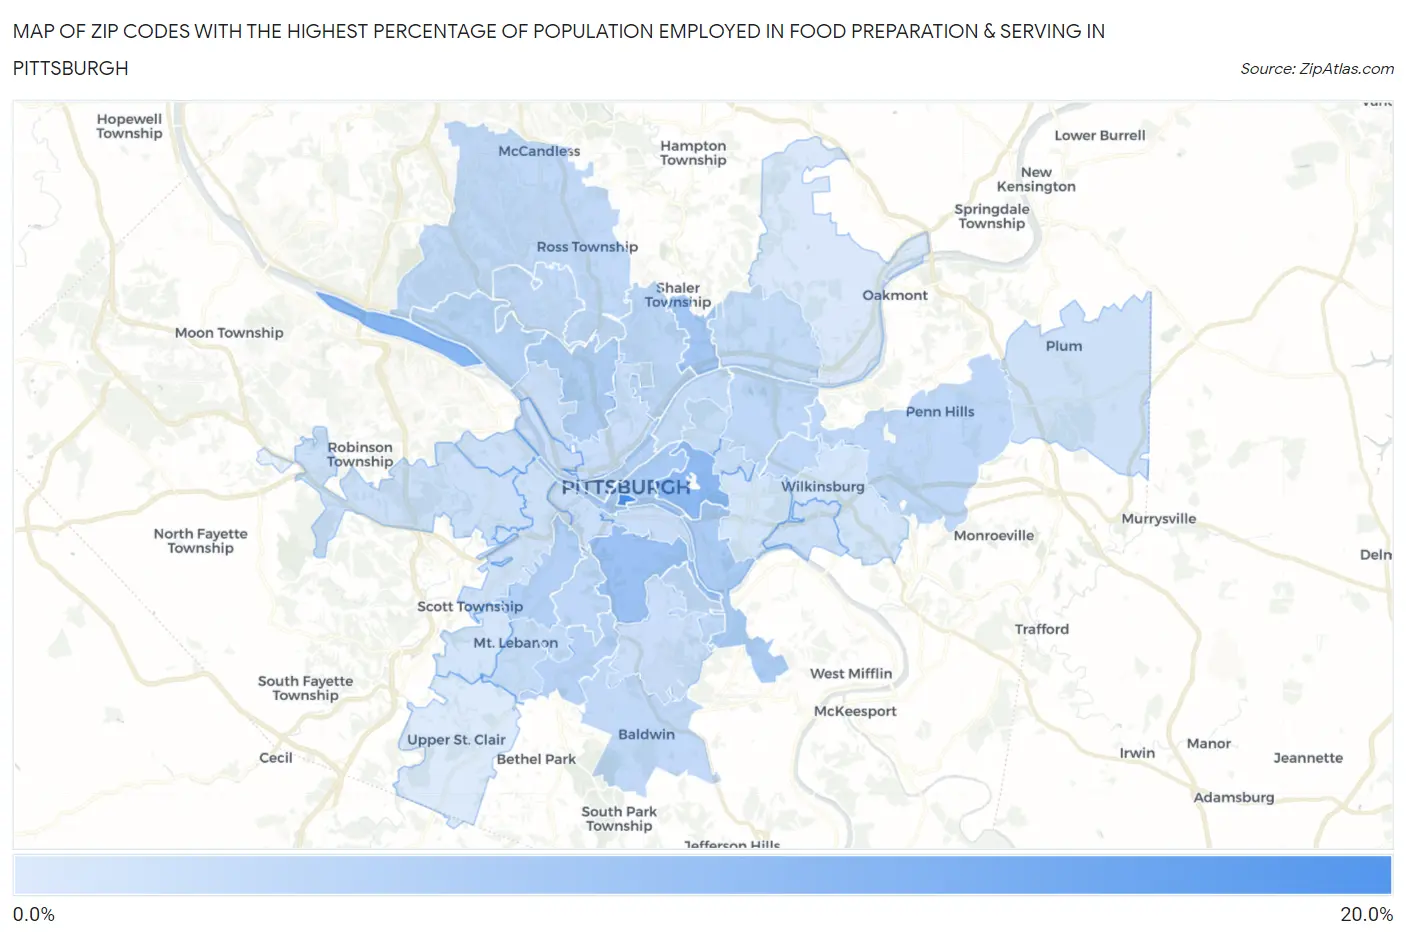
Map of Zip Codes with the Highest Percentage of Population Employed in Food Preparation & Serving in Pittsburgh
2.3%
19.9%
Zip Codes with the Highest Percentage of Population Employed in Food Preparation & Serving in Pittsburgh, PA
| Zip Code | % Employed | vs State | vs National | |
| 1. | 15282 | 19.9% | 5.0%(+14.8)#40 | 5.3%(+14.6)#513 |
| 2. | 15225 | 12.0% | 5.0%(+6.96)#102 | 5.3%(+6.71)#1,663 |
| 3. | 15213 | 11.2% | 5.0%(+6.12)#121 | 5.3%(+5.88)#1,975 |
| 4. | 15210 | 9.7% | 5.0%(+4.69)#153 | 5.3%(+4.45)#2,851 |
| 5. | 15223 | 8.5% | 5.0%(+3.44)#208 | 5.3%(+3.20)#4,089 |
| 6. | 15219 | 7.9% | 5.0%(+2.85)#256 | 5.3%(+2.61)#4,899 |
| 7. | 15207 | 7.6% | 5.0%(+2.55)#282 | 5.3%(+2.31)#5,390 |
| 8. | 15214 | 7.2% | 5.0%(+2.17)#322 | 5.3%(+1.93)#6,118 |
| 9. | 15216 | 6.9% | 5.0%(+1.82)#360 | 5.3%(+1.58)#6,900 |
| 10. | 15222 | 6.6% | 5.0%(+1.53)#395 | 5.3%(+1.29)#7,666 |
| 11. | 15234 | 6.3% | 5.0%(+1.28)#442 | 5.3%(+1.04)#8,361 |
| 12. | 15202 | 6.0% | 5.0%(+0.967)#503 | 5.3%(+0.725)#9,312 |
| 13. | 15209 | 5.9% | 5.0%(+0.841)#524 | 5.3%(+0.599)#9,733 |
| 14. | 15235 | 5.7% | 5.0%(+0.644)#565 | 5.3%(+0.402)#10,395 |
| 15. | 15226 | 5.6% | 5.0%(+0.533)#592 | 5.3%(+0.290)#10,782 |
| 16. | 15208 | 5.5% | 5.0%(+0.502)#602 | 5.3%(+0.259)#10,910 |
| 17. | 15206 | 5.5% | 5.0%(+0.491)#606 | 5.3%(+0.248)#10,948 |
| 18. | 15236 | 5.4% | 5.0%(+0.323)#644 | 5.3%(+0.080)#11,520 |
| 19. | 15229 | 5.3% | 5.0%(+0.305)#647 | 5.3%(+0.062)#11,586 |
| 20. | 15237 | 5.3% | 5.0%(+0.240)#662 | 5.3%(-0.002)#11,829 |
| 21. | 15215 | 5.0% | 5.0%(-0.004)#723 | 5.3%(-0.246)#12,784 |
| 22. | 15201 | 5.0% | 5.0%(-0.043)#732 | 5.3%(-0.285)#12,938 |
| 23. | 15232 | 4.9% | 5.0%(-0.113)#751 | 5.3%(-0.356)#13,225 |
| 24. | 15228 | 4.8% | 5.0%(-0.203)#776 | 5.3%(-0.446)#13,603 |
| 25. | 15224 | 4.8% | 5.0%(-0.282)#801 | 5.3%(-0.524)#13,905 |
| 26. | 15227 | 4.4% | 5.0%(-0.594)#888 | 5.3%(-0.837)#15,205 |
| 27. | 15233 | 4.4% | 5.0%(-0.653)#909 | 5.3%(-0.895)#15,456 |
| 28. | 15203 | 4.4% | 5.0%(-0.690)#920 | 5.3%(-0.932)#15,624 |
| 29. | 15212 | 4.2% | 5.0%(-0.809)#950 | 5.3%(-1.05)#16,175 |
| 30. | 15211 | 4.2% | 5.0%(-0.820)#952 | 5.3%(-1.06)#16,227 |
| 31. | 15218 | 4.2% | 5.0%(-0.885)#965 | 5.3%(-1.13)#16,478 |
| 32. | 15204 | 4.1% | 5.0%(-0.973)#983 | 5.3%(-1.22)#16,836 |
| 33. | 15205 | 4.1% | 5.0%(-0.989)#988 | 5.3%(-1.23)#16,914 |
| 34. | 15239 | 3.9% | 5.0%(-1.11)#1,009 | 5.3%(-1.36)#17,405 |
| 35. | 15220 | 3.7% | 5.0%(-1.33)#1,064 | 5.3%(-1.57)#18,282 |
| 36. | 15217 | 3.3% | 5.0%(-1.73)#1,146 | 5.3%(-1.97)#19,995 |
| 37. | 15243 | 3.3% | 5.0%(-1.79)#1,160 | 5.3%(-2.03)#20,257 |
| 38. | 15221 | 3.2% | 5.0%(-1.80)#1,166 | 5.3%(-2.04)#20,309 |
| 39. | 15238 | 2.6% | 5.0%(-2.48)#1,303 | 5.3%(-2.73)#22,944 |
| 40. | 15241 | 2.3% | 5.0%(-2.73)#1,343 | 5.3%(-2.98)#23,742 |
1
Common Questions
What are the Top 10 Zip Codes with the Highest Percentage of Population Employed in Food Preparation & Serving in Pittsburgh, PA?
Top 10 Zip Codes with the Highest Percentage of Population Employed in Food Preparation & Serving in Pittsburgh, PA are:
What zip code has the Highest Percentage of Population Employed in Food Preparation & Serving in Pittsburgh, PA?
15282 has the Highest Percentage of Population Employed in Food Preparation & Serving in Pittsburgh, PA with 19.9%.
What is the Percentage of Population Employed in Food Preparation & Serving in Pittsburgh, PA?
Percentage of Population Employed in Food Preparation & Serving in Pittsburgh is 6.0%.
What is the Percentage of Population Employed in Food Preparation & Serving in Pennsylvania?
Percentage of Population Employed in Food Preparation & Serving in Pennsylvania is 5.0%.
What is the Percentage of Population Employed in Food Preparation & Serving in the United States?
Percentage of Population Employed in Food Preparation & Serving in the United States is 5.3%.