Zip Codes with the Highest Percentage of Population with a Degree in Computers and Mathematics in Pittsburgh, PA
RELATED REPORTS & OPTIONS
Computers and Mathematics
Pittsburgh
Compare Zip Codes
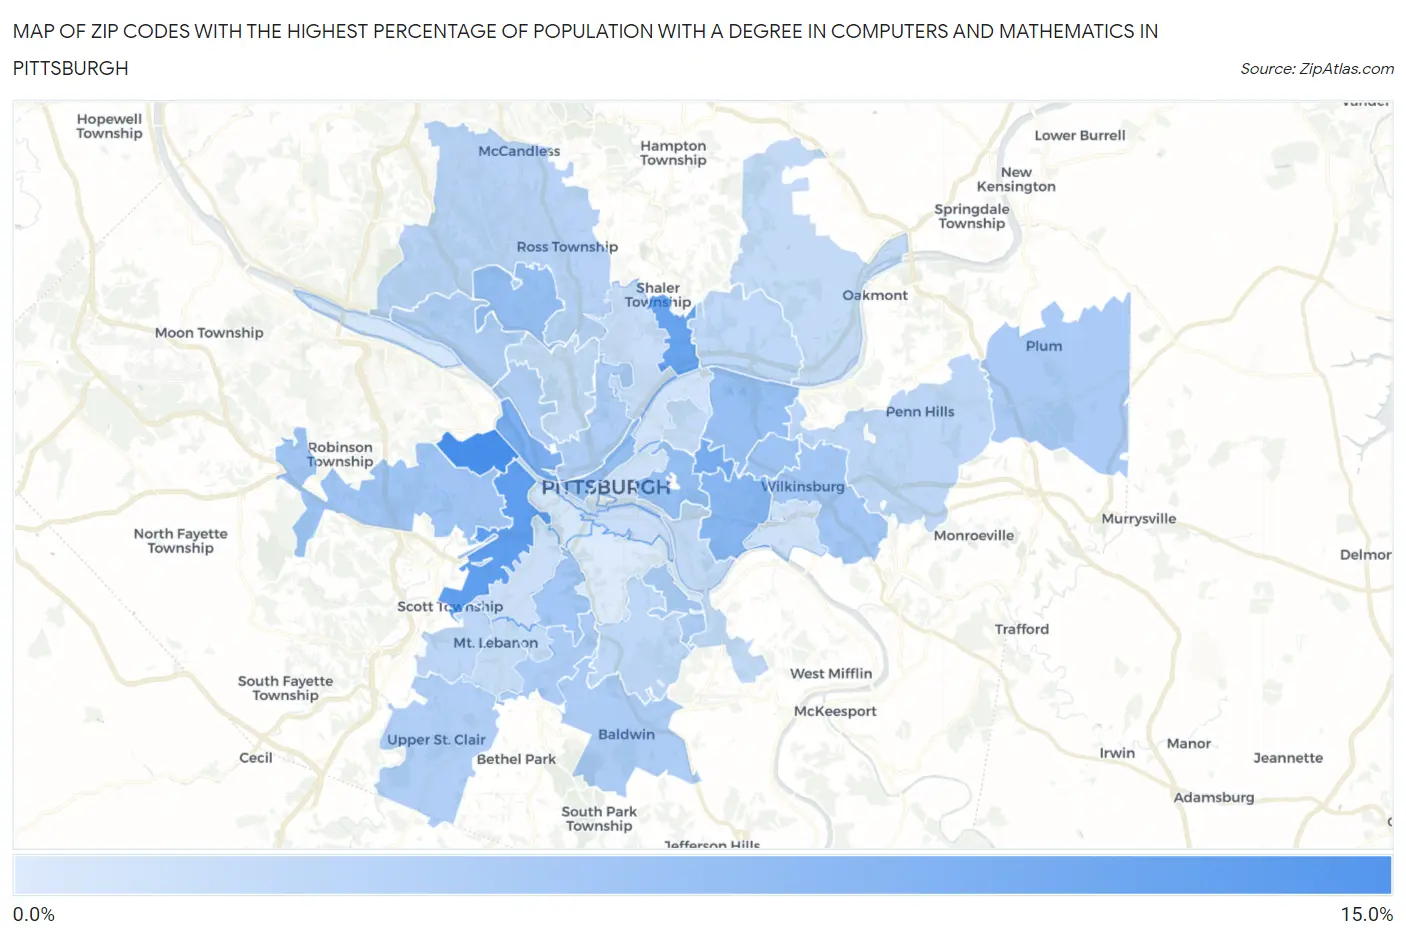
Map of Zip Codes with the Highest Percentage of Population with a Degree in Computers and Mathematics in Pittsburgh
2.8%
13.2%
Zip Codes with the Highest Percentage of Population with a Degree in Computers and Mathematics in Pittsburgh, PA
| Zip Code | % Graduates | vs State | vs National | |
| 1. | 15204 | 13.2% | 4.6%(+8.62)#73 | 4.9%(+8.28)#1,025 |
| 2. | 15220 | 11.4% | 4.6%(+6.86)#83 | 4.9%(+6.52)#1,344 |
| 3. | 15223 | 10.7% | 4.6%(+6.10)#92 | 4.9%(+5.76)#1,536 |
| 4. | 15232 | 9.7% | 4.6%(+5.14)#116 | 4.9%(+4.80)#1,886 |
| 5. | 15233 | 9.2% | 4.6%(+4.64)#123 | 4.9%(+4.30)#2,121 |
| 6. | 15217 | 8.6% | 4.6%(+4.01)#149 | 4.9%(+3.67)#2,498 |
| 7. | 15213 | 7.6% | 4.6%(+3.05)#184 | 4.9%(+2.71)#3,240 |
| 8. | 15229 | 7.6% | 4.6%(+3.01)#185 | 4.9%(+2.67)#3,277 |
| 9. | 15222 | 7.6% | 4.6%(+3.01)#186 | 4.9%(+2.67)#3,286 |
| 10. | 15206 | 7.4% | 4.6%(+2.84)#196 | 4.9%(+2.50)#3,440 |
| 11. | 15208 | 6.9% | 4.6%(+2.34)#221 | 4.9%(+2.00)#3,961 |
| 12. | 15205 | 6.8% | 4.6%(+2.23)#228 | 4.9%(+1.89)#4,093 |
| 13. | 15226 | 6.6% | 4.6%(+2.08)#241 | 4.9%(+1.74)#4,296 |
| 14. | 15221 | 6.6% | 4.6%(+2.02)#246 | 4.9%(+1.68)#4,360 |
| 15. | 15239 | 6.2% | 4.6%(+1.67)#276 | 4.9%(+1.33)#4,904 |
| 16. | 15236 | 5.9% | 4.6%(+1.40)#300 | 4.9%(+1.06)#5,381 |
| 17. | 15234 | 5.9% | 4.6%(+1.38)#302 | 4.9%(+1.04)#5,406 |
| 18. | 15212 | 5.8% | 4.6%(+1.23)#320 | 4.9%(+0.885)#5,709 |
| 19. | 15241 | 5.7% | 4.6%(+1.15)#328 | 4.9%(+0.807)#5,870 |
| 20. | 15202 | 5.7% | 4.6%(+1.12)#330 | 4.9%(+0.780)#5,924 |
| 21. | 15237 | 5.3% | 4.6%(+0.699)#381 | 4.9%(+0.357)#6,880 |
| 22. | 15235 | 5.0% | 4.6%(+0.433)#412 | 4.9%(+0.092)#7,487 |
| 23. | 15243 | 4.9% | 4.6%(+0.342)#424 | 4.9%(+0.001)#7,712 |
| 24. | 15215 | 4.8% | 4.6%(+0.268)#438 | 4.9%(-0.073)#7,929 |
| 25. | 15227 | 4.8% | 4.6%(+0.234)#444 | 4.9%(-0.108)#8,028 |
| 26. | 15207 | 4.7% | 4.6%(+0.112)#462 | 4.9%(-0.230)#8,377 |
| 27. | 15224 | 4.5% | 4.6%(-0.085)#493 | 4.9%(-0.426)#8,970 |
| 28. | 15214 | 4.4% | 4.6%(-0.134)#507 | 4.9%(-0.475)#9,126 |
| 29. | 15238 | 4.4% | 4.6%(-0.147)#510 | 4.9%(-0.489)#9,185 |
| 30. | 15228 | 4.3% | 4.6%(-0.261)#533 | 4.9%(-0.603)#9,560 |
| 31. | 15209 | 4.1% | 4.6%(-0.403)#559 | 4.9%(-0.745)#9,993 |
| 32. | 15203 | 4.0% | 4.6%(-0.577)#582 | 4.9%(-0.918)#10,538 |
| 33. | 15216 | 3.8% | 4.6%(-0.716)#620 | 4.9%(-1.06)#11,055 |
| 34. | 15218 | 3.7% | 4.6%(-0.899)#653 | 4.9%(-1.24)#11,692 |
| 35. | 15219 | 3.6% | 4.6%(-0.934)#664 | 4.9%(-1.28)#11,824 |
| 36. | 15201 | 3.5% | 4.6%(-1.01)#683 | 4.9%(-1.35)#12,127 |
| 37. | 15225 | 3.3% | 4.6%(-1.27)#739 | 4.9%(-1.62)#13,092 |
| 38. | 15211 | 3.2% | 4.6%(-1.34)#752 | 4.9%(-1.68)#13,334 |
| 39. | 15210 | 2.8% | 4.6%(-1.80)#845 | 4.9%(-2.14)#14,984 |
1
Common Questions
What are the Top 10 Zip Codes with the Highest Percentage of Population with a Degree in Computers and Mathematics in Pittsburgh, PA?
Top 10 Zip Codes with the Highest Percentage of Population with a Degree in Computers and Mathematics in Pittsburgh, PA are:
What zip code has the Highest Percentage of Population with a Degree in Computers and Mathematics in Pittsburgh, PA?
15204 has the Highest Percentage of Population with a Degree in Computers and Mathematics in Pittsburgh, PA with 13.2%.
What is the Percentage of Population with a Degree in Computers and Mathematics in Pittsburgh, PA?
Percentage of Population with a Degree in Computers and Mathematics in Pittsburgh is 6.4%.
What is the Percentage of Population with a Degree in Computers and Mathematics in Pennsylvania?
Percentage of Population with a Degree in Computers and Mathematics in Pennsylvania is 4.6%.
What is the Percentage of Population with a Degree in Computers and Mathematics in the United States?
Percentage of Population with a Degree in Computers and Mathematics in the United States is 4.9%.