Zip Codes with the Highest Percentage of Population Employed in Computer, Engineering & Science in Pittsburgh, PA

RELATED REPORTS & OPTIONS

Computer, Engineering & Science
Population
Families and Households
Female Fertility
Female Fertility (Unmarried)
Race (Community Size)
Race (Percentage)
Ancestry (Community Size)
AfghanAfricanAlbanianAlsatianAmericanApacheArabArgentineanArmenianAustralianAustrianBahamianBarbadianBasqueBelgianBhutaneseBlackfeetBolivianBrazilianBritishBritish West IndianBulgarianBurmeseCajunCambodianCanadianCape VerdeanCarpatho RusynCelticCentral AmericanCentral American IndianCherokeeChickasawChileanChippewaChoctawColombianComancheCosta RicanCreekCroatianCubanCypriotCzechCzechoslovakianDanishDelawareDominicanDutchEastern EuropeanEcuadorianEgyptianEnglishEthiopianEuropeanFilipinoFinnishFrenchFrench American IndianFrench CanadianGermanGhanaianGreekGuamanian / ChamorroGuatemalanGuyaneseHaitianHonduranHungarianIndian (Asian)IndonesianIranianIraqiIrishIroquoisIsraeliItalianJamaicanJapaneseJordanianKenyanKoreanLaotianLatvianLebaneseLiberianLithuanianLumbeeLuxembourgerMacedonianMalaysianMalteseMexicanMexican American IndianMongolianMoroccanNative HawaiianNavajoNew ZealanderNicaraguanNigerianNorthern EuropeanNorwegianPakistaniPalestinianPanamanianParaguayanPennsylvania GermanPeruvianPolishPortuguesePuerto RicanRomanianRussianSalvadoranSamoanScandinavianScotch-IrishScottishSeminoleSerbianSiouxSlavicSlovakSloveneSouth AfricanSouth AmericanSouth American IndianSoviet UnionSpaniardSpanishSri LankanSubsaharan AfricanSudaneseSwedishSwissSyrianThaiTrinidadian and TobagonianTurkishU.S. Virgin IslanderUgandanUkrainianUruguayanVenezuelanVietnameseWelshWest IndianYugoslavian
Ancestry (Percentage)
AfghanAfricanAlbanianAlsatianAmericanApacheArabArgentineanArmenianAustralianAustrianBahamianBarbadianBasqueBelgianBhutaneseBlackfeetBolivianBrazilianBritishBritish West IndianBulgarianBurmeseCajunCambodianCanadianCape VerdeanCarpatho RusynCelticCentral AmericanCentral American IndianCherokeeChickasawChileanChippewaChoctawColombianComancheCosta RicanCreekCroatianCubanCypriotCzechCzechoslovakianDanishDelawareDominicanDutchEastern EuropeanEcuadorianEgyptianEnglishEthiopianEuropeanFilipinoFinnishFrenchFrench American IndianFrench CanadianGermanGhanaianGreekGuamanian / ChamorroGuatemalanGuyaneseHaitianHonduranHungarianIndian (Asian)IndonesianIranianIraqiIrishIroquoisIsraeliItalianJamaicanJapaneseJordanianKenyanKoreanLaotianLatvianLebaneseLiberianLithuanianLumbeeLuxembourgerMacedonianMalaysianMalteseMexicanMexican American IndianMongolianMoroccanNative HawaiianNavajoNew ZealanderNicaraguanNigerianNorthern EuropeanNorwegianPakistaniPalestinianPanamanianParaguayanPennsylvania GermanPeruvianPolishPortuguesePuerto RicanRomanianRussianSalvadoranSamoanScandinavianScotch-IrishScottishSeminoleSerbianSiouxSlavicSlovakSloveneSouth AfricanSouth AmericanSouth American IndianSoviet UnionSpaniardSpanishSri LankanSubsaharan AfricanSudaneseSwedishSwissSyrianThaiTrinidadian and TobagonianTurkishU.S. Virgin IslanderUgandanUkrainianUruguayanVenezuelanVietnameseWelshWest IndianYugoslavian
Immigrant Origin (Total)
AfghanistanAfricaAlbaniaArgentinaAsiaAustraliaAustriaBahamasBangladeshBelarusBelgiumBoliviaBosnia and HerzegovinaBrazilBulgariaBurma / MyanmarCambodiaCameroonCanadaCaribbeanCentral AmericaChileChinaColombiaCongoCosta RicaCroatiaCubaCzechoslovakiaDenmarkDominican RepublicEastern AfricaEastern AsiaEastern EuropeEcuadorEgyptEl SalvadorEnglandEritreaEthiopiaEuropeFranceGermanyGhanaGreeceGuatemalaGuyanaHaitiHondurasHong KongHungaryIndiaIndonesiaIranIraqIrelandIsraelItalyJamaicaJapanJordanKazakhstanKenyaKoreaKuwaitLatin AmericaLatviaLebanonLiberiaLithuaniaMalaysiaMexicoMiddle AfricaMoldovaMoroccoNepalNetherlandsNigeriaNorthern AfricaNorthern EuropeNorwayOceaniaPakistanPanamaPeruPhilippinesPolandPortugalRomaniaRussiaSaudi ArabiaScotlandSerbiaSingaporeSouth AfricaSouth AmericaSouth Central AsiaSouth Eastern AsiaSouthern EuropeSpainSri LankaSudanSwedenSwitzerlandSyriaTaiwanThailandTrinidad and TobagoTurkeyUgandaUkraineUzbekistanVenezuelaVietnamWestern AfricaWestern AsiaWestern EuropeZaire
Immigrant Origin (Percentage)
AfghanistanAfricaAlbaniaArgentinaAsiaAustraliaAustriaBahamasBangladeshBelarusBelgiumBoliviaBosnia and HerzegovinaBrazilBulgariaBurma / MyanmarCambodiaCameroonCanadaCaribbeanCentral AmericaChileChinaColombiaCongoCosta RicaCroatiaCubaCzechoslovakiaDenmarkDominican RepublicEastern AfricaEastern AsiaEastern EuropeEcuadorEgyptEl SalvadorEnglandEritreaEthiopiaEuropeFranceGermanyGhanaGreeceGuatemalaGuyanaHaitiHondurasHong KongHungaryIndiaIndonesiaIranIraqIrelandIsraelItalyJamaicaJapanJordanKazakhstanKenyaKoreaKuwaitLatin AmericaLatviaLebanonLiberiaLithuaniaMalaysiaMexicoMiddle AfricaMoldovaMoroccoNepalNetherlandsNigeriaNorthern AfricaNorthern EuropeNorwayOceaniaPakistanPanamaPeruPhilippinesPolandPortugalRomaniaRussiaSaudi ArabiaScotlandSerbiaSingaporeSouth AfricaSouth AmericaSouth Central AsiaSouth Eastern AsiaSouthern EuropeSpainSri LankaSudanSwedenSwitzerlandSyriaTaiwanThailandTrinidad and TobagoTurkeyUgandaUkraineUzbekistanVenezuelaVietnamWestern AfricaWestern AsiaWestern EuropeZaire
Income
Income (Families)
Income (Households)
Poverty
Poverty (Families)
Unemployment
Employment Occupations
Employment Industries
Employer Class
Commute Time
Commute Means
School Enrollment
Education by Degree Field
Occupancy
Finances
Physical Characteristics
Pittsburgh
Compare Zip Codes
Comparison Subject

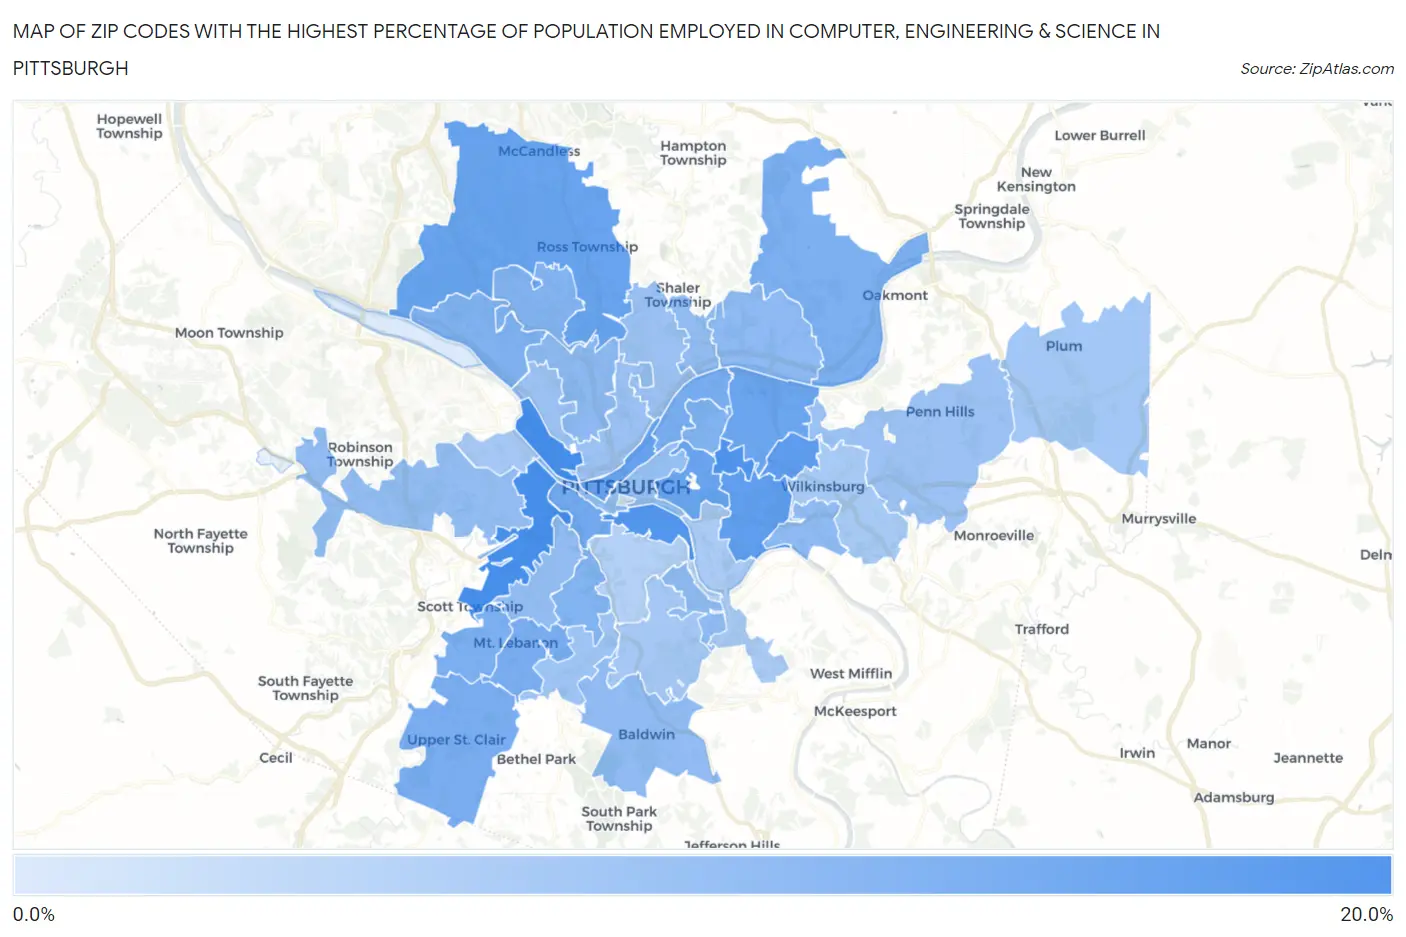
Map of Zip Codes with the Highest Percentage of Population Employed in Computer, Engineering & Science in Pittsburgh

0.0%
20.0%
Zip Codes with the Highest Percentage of Population Employed in Computer, Engineering & Science in Pittsburgh Map

Zip Codes with the Highest Percentage of Population Employed in Computer, Engineering & Science in Pittsburgh, PA

Zip Code % Employed vs State vs National
1.1522017.1%6.5%(+10.5)#356.8%(+10.3)#807
2.1523317.0%6.5%(+10.5)#366.8%(+10.2)#812
3.1523215.9%6.5%(+9.39)#416.8%(+9.16)#973
4.1520315.7%6.5%(+9.20)#426.8%(+8.97)#1,002
5.1520814.6%6.5%(+8.02)#516.8%(+7.80)#1,205
6.1521714.2%6.5%(+7.69)#536.8%(+7.47)#1,286
7.1522213.6%6.5%(+7.06)#596.8%(+6.83)#1,453
8.1523713.3%6.5%(+6.74)#636.8%(+6.51)#1,547
9.1521313.2%6.5%(+6.65)#656.8%(+6.43)#1,572
10.1520613.0%6.5%(+6.44)#696.8%(+6.21)#1,652
11.1521112.3%6.5%(+5.76)#846.8%(+5.54)#1,900
12.1520111.7%6.5%(+5.17)#1046.8%(+4.95)#2,168
13.1522811.4%6.5%(+4.89)#1156.8%(+4.66)#2,341
14.1524111.4%6.5%(+4.88)#1166.8%(+4.66)#2,343
15.1523811.3%6.5%(+4.73)#1226.8%(+4.51)#2,424
16.1524311.2%6.5%(+4.67)#1256.8%(+4.44)#2,455
17.1522410.9%6.5%(+4.33)#1416.8%(+4.10)#2,644
18.1520210.8%6.5%(+4.30)#1426.8%(+4.08)#2,653
19.1522910.6%6.5%(+4.04)#1506.8%(+3.81)#2,812
20.1522610.5%6.5%(+3.99)#1516.8%(+3.77)#2,846
21.152189.4%6.5%(+2.85)#1846.8%(+2.63)#3,693
22.152159.4%6.5%(+2.83)#1866.8%(+2.60)#3,719
23.152149.3%6.5%(+2.80)#1876.8%(+2.58)#3,745
24.152369.1%6.5%(+2.59)#1986.8%(+2.37)#3,929
25.152058.9%6.5%(+2.39)#2096.8%(+2.17)#4,136
26.152238.8%6.5%(+2.22)#2166.8%(+2.00)#4,302
27.152168.8%6.5%(+2.21)#2176.8%(+1.99)#4,308
28.152198.6%6.5%(+2.09)#2306.8%(+1.86)#4,449
29.152128.1%6.5%(+1.58)#2646.8%(+1.35)#5,103
30.152098.0%6.5%(+1.50)#2706.8%(+1.28)#5,215
31.152358.0%6.5%(+1.45)#2736.8%(+1.22)#5,280
32.152347.6%6.5%(+1.08)#3036.8%(+0.851)#5,812
33.152397.1%6.5%(+0.576)#3516.8%(+0.351)#6,604
34.152276.9%6.5%(+0.335)#3766.8%(+0.110)#7,018
35.152046.9%6.5%(+0.328)#3776.8%(+0.104)#7,029
36.152216.7%6.5%(+0.193)#4026.8%(-0.032)#7,287
37.152076.5%6.5%(-0.013)#4266.8%(-0.237)#7,685
38.152105.5%6.5%(-1.08)#5726.8%(-1.31)#10,165
39.152822.9%6.5%(-3.63)#1,0416.8%(-3.85)#18,447
40.152251.4%6.5%(-5.14)#1,3156.8%(-5.36)#23,906

Common Questions

What are the Top 10 Zip Codes with the Highest Percentage of Population Employed in Computer, Engineering & Science in Pittsburgh, PA?
Top 10 Zip Codes with the Highest Percentage of Population Employed in Computer, Engineering & Science in Pittsburgh, PA are:
#1
17.1%
#2
17.0%
#3
15.9%
#4
15.7%
#5
14.6%
#6
14.2%
#7
13.6%
#8
13.3%
#9
13.2%
#10
13.0%
What zip code has the Highest Percentage of Population Employed in Computer, Engineering & Science in Pittsburgh, PA?
15220 has the Highest Percentage of Population Employed in Computer, Engineering & Science in Pittsburgh, PA with 17.1%.
What is the Percentage of Population Employed in Computer, Engineering & Science in Pittsburgh, PA?
Percentage of Population Employed in Computer, Engineering & Science in Pittsburgh is 10.7%.
What is the Percentage of Population Employed in Computer, Engineering & Science in Pennsylvania?
Percentage of Population Employed in Computer, Engineering & Science in Pennsylvania is 6.5%.
What is the Percentage of Population Employed in Computer, Engineering & Science in the United States?
Percentage of Population Employed in Computer, Engineering & Science in the United States is 6.8%.