Zip Codes with the Highest Percentage of Population Employed in Agriculture, Fishing & Hunting in Pittsburgh, PA
RELATED REPORTS & OPTIONS
Agriculture, Fishing & Hunting
Pittsburgh
Compare Zip Codes
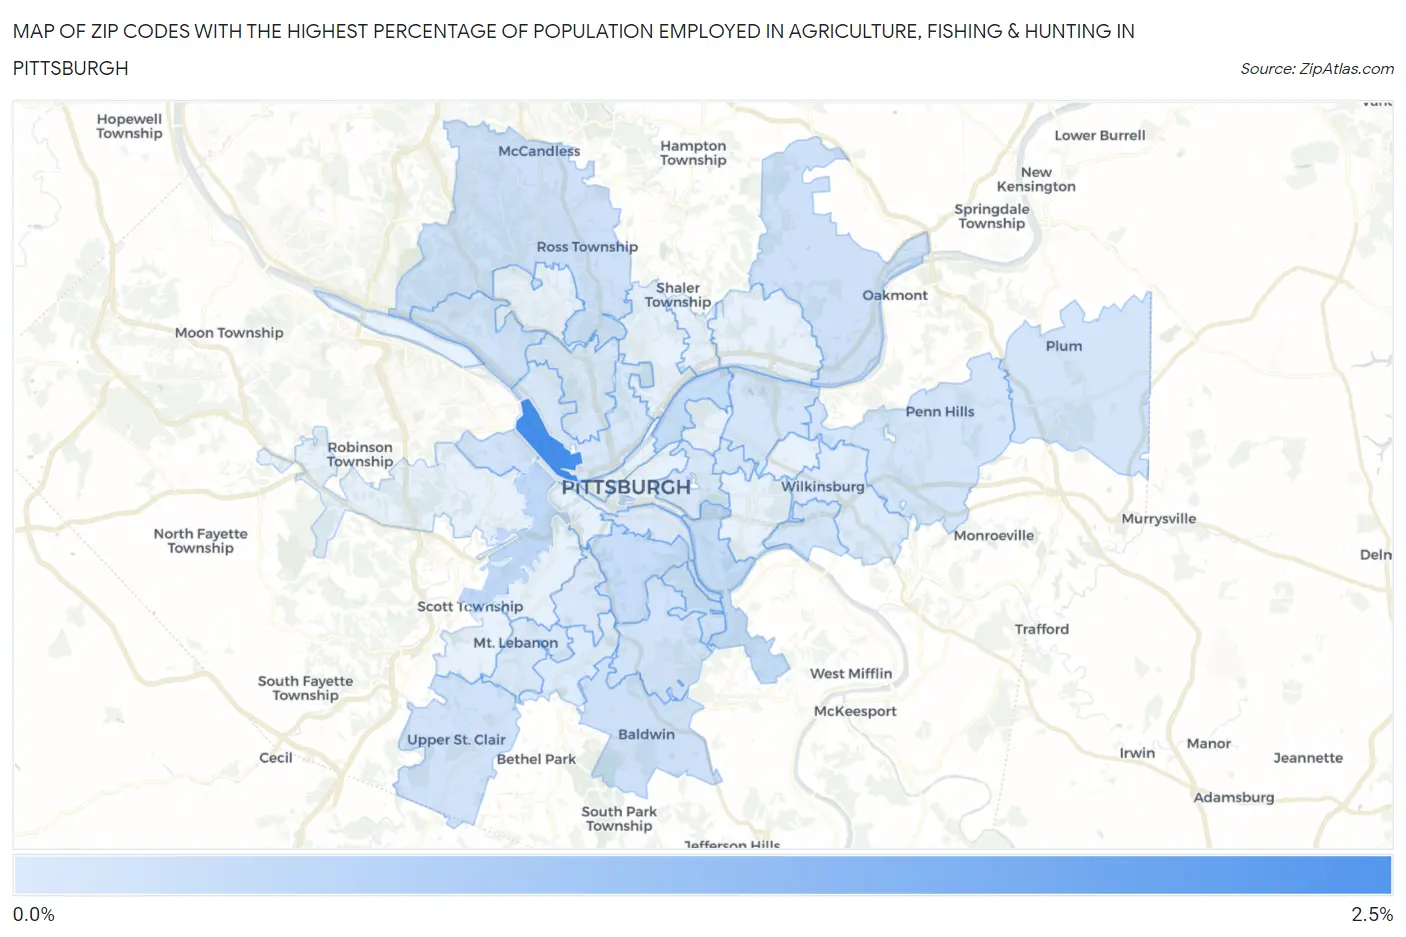
Map of Zip Codes with the Highest Percentage of Population Employed in Agriculture, Fishing & Hunting in Pittsburgh
0.037%
2.1%
Zip Codes with the Highest Percentage of Population Employed in Agriculture, Fishing & Hunting in Pittsburgh, PA
| Zip Code | % Employed | vs State | vs National | |
| 1. | 15233 | 2.1% | 0.87%(+1.24)#402 | 1.2%(+0.903)#12,493 |
| 2. | 15282 | 0.49% | 0.87%(-0.382)#806 | 1.2%(-0.714)#19,404 |
| 3. | 15220 | 0.44% | 0.87%(-0.431)#827 | 1.2%(-0.764)#19,839 |
| 4. | 15201 | 0.36% | 0.87%(-0.508)#869 | 1.2%(-0.841)#20,562 |
| 5. | 15207 | 0.36% | 0.87%(-0.512)#870 | 1.2%(-0.844)#20,598 |
| 6. | 15210 | 0.33% | 0.87%(-0.536)#889 | 1.2%(-0.869)#20,843 |
| 7. | 15236 | 0.22% | 0.87%(-0.642)#951 | 1.2%(-0.974)#22,043 |
| 8. | 15237 | 0.21% | 0.87%(-0.656)#962 | 1.2%(-0.988)#22,218 |
| 9. | 15238 | 0.21% | 0.87%(-0.656)#965 | 1.2%(-0.989)#22,234 |
| 10. | 15202 | 0.21% | 0.87%(-0.659)#967 | 1.2%(-0.991)#22,263 |
| 11. | 15204 | 0.20% | 0.87%(-0.664)#972 | 1.2%(-0.996)#22,319 |
| 12. | 15227 | 0.20% | 0.87%(-0.666)#976 | 1.2%(-0.998)#22,349 |
| 13. | 15241 | 0.19% | 0.87%(-0.680)#983 | 1.2%(-1.01)#22,506 |
| 14. | 15235 | 0.17% | 0.87%(-0.699)#993 | 1.2%(-1.03)#22,753 |
| 15. | 15218 | 0.16% | 0.87%(-0.710)#1,000 | 1.2%(-1.04)#22,917 |
| 16. | 15206 | 0.15% | 0.87%(-0.717)#1,004 | 1.2%(-1.05)#23,021 |
| 17. | 15239 | 0.15% | 0.87%(-0.718)#1,005 | 1.2%(-1.05)#23,022 |
| 18. | 15232 | 0.13% | 0.87%(-0.738)#1,017 | 1.2%(-1.07)#23,301 |
| 19. | 15228 | 0.11% | 0.87%(-0.752)#1,025 | 1.2%(-1.08)#23,479 |
| 20. | 15212 | 0.095% | 0.87%(-0.772)#1,035 | 1.2%(-1.10)#23,746 |
| 21. | 15213 | 0.094% | 0.87%(-0.773)#1,036 | 1.2%(-1.10)#23,747 |
| 22. | 15214 | 0.091% | 0.87%(-0.776)#1,038 | 1.2%(-1.11)#23,805 |
| 23. | 15226 | 0.072% | 0.87%(-0.795)#1,053 | 1.2%(-1.13)#24,074 |
| 24. | 15203 | 0.056% | 0.87%(-0.811)#1,063 | 1.2%(-1.14)#24,273 |
| 25. | 15221 | 0.048% | 0.87%(-0.819)#1,071 | 1.2%(-1.15)#24,364 |
| 26. | 15234 | 0.037% | 0.87%(-0.830)#1,075 | 1.2%(-1.16)#24,480 |
1
Common Questions
What are the Top 10 Zip Codes with the Highest Percentage of Population Employed in Agriculture, Fishing & Hunting in Pittsburgh, PA?
Top 10 Zip Codes with the Highest Percentage of Population Employed in Agriculture, Fishing & Hunting in Pittsburgh, PA are:
What zip code has the Highest Percentage of Population Employed in Agriculture, Fishing & Hunting in Pittsburgh, PA?
15233 has the Highest Percentage of Population Employed in Agriculture, Fishing & Hunting in Pittsburgh, PA with 2.1%.
What is the Percentage of Population Employed in Agriculture, Fishing & Hunting in Pittsburgh, PA?
Percentage of Population Employed in Agriculture, Fishing & Hunting in Pittsburgh is 0.12%.
What is the Percentage of Population Employed in Agriculture, Fishing & Hunting in Pennsylvania?
Percentage of Population Employed in Agriculture, Fishing & Hunting in Pennsylvania is 0.87%.
What is the Percentage of Population Employed in Agriculture, Fishing & Hunting in the United States?
Percentage of Population Employed in Agriculture, Fishing & Hunting in the United States is 1.2%.