Zip Codes with the Highest Percentage of Population Employed in Professional & Scientific Services in Pittsburgh, PA
RELATED REPORTS & OPTIONS
Professional & Scientific Services
Pittsburgh
Compare Zip Codes
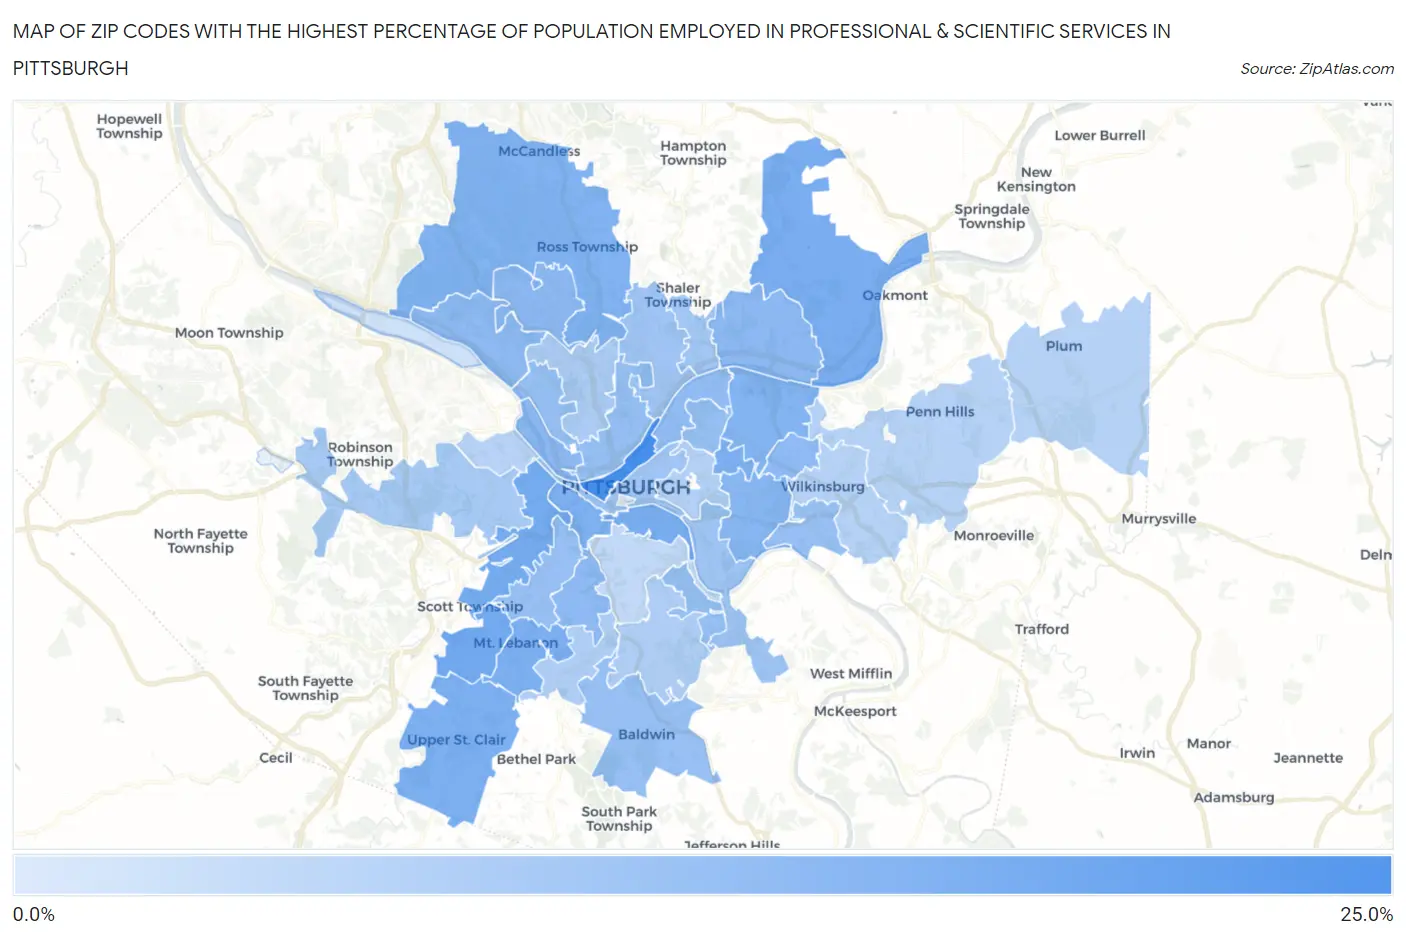
Map of Zip Codes with the Highest Percentage of Population Employed in Professional & Scientific Services in Pittsburgh
0.67%
23.0%
Zip Codes with the Highest Percentage of Population Employed in Professional & Scientific Services in Pittsburgh, PA
| Zip Code | % Employed | vs State | vs National | |
| 1. | 15222 | 23.0% | 7.1%(+15.9)#26 | 7.8%(+15.2)#576 |
| 2. | 15243 | 16.1% | 7.1%(+8.99)#69 | 7.8%(+8.28)#1,581 |
| 3. | 15220 | 15.5% | 7.1%(+8.41)#76 | 7.8%(+7.70)#1,731 |
| 4. | 15203 | 15.4% | 7.1%(+8.27)#79 | 7.8%(+7.55)#1,777 |
| 5. | 15238 | 15.1% | 7.1%(+7.93)#82 | 7.8%(+7.22)#1,878 |
| 6. | 15232 | 14.7% | 7.1%(+7.55)#88 | 7.8%(+6.84)#2,014 |
| 7. | 15241 | 14.6% | 7.1%(+7.50)#90 | 7.8%(+6.78)#2,039 |
| 8. | 15228 | 14.6% | 7.1%(+7.47)#91 | 7.8%(+6.76)#2,052 |
| 9. | 15211 | 14.2% | 7.1%(+7.06)#102 | 7.8%(+6.34)#2,197 |
| 10. | 15237 | 13.8% | 7.1%(+6.69)#111 | 7.8%(+5.98)#2,343 |
| 11. | 15206 | 13.4% | 7.1%(+6.30)#121 | 7.8%(+5.59)#2,522 |
| 12. | 15217 | 13.0% | 7.1%(+5.85)#134 | 7.8%(+5.14)#2,724 |
| 13. | 15229 | 12.3% | 7.1%(+5.16)#144 | 7.8%(+4.45)#3,038 |
| 14. | 15215 | 12.3% | 7.1%(+5.12)#145 | 7.8%(+4.40)#3,060 |
| 15. | 15233 | 12.0% | 7.1%(+4.86)#153 | 7.8%(+4.15)#3,213 |
| 16. | 15208 | 11.7% | 7.1%(+4.55)#158 | 7.8%(+3.84)#3,391 |
| 17. | 15202 | 11.7% | 7.1%(+4.55)#159 | 7.8%(+3.84)#3,394 |
| 18. | 15226 | 11.6% | 7.1%(+4.51)#160 | 7.8%(+3.79)#3,416 |
| 19. | 15201 | 11.5% | 7.1%(+4.41)#164 | 7.8%(+3.69)#3,482 |
| 20. | 15224 | 10.8% | 7.1%(+3.68)#190 | 7.8%(+2.96)#3,978 |
| 21. | 15212 | 10.7% | 7.1%(+3.54)#197 | 7.8%(+2.82)#4,053 |
| 22. | 15216 | 10.3% | 7.1%(+3.20)#210 | 7.8%(+2.49)#4,333 |
| 23. | 15236 | 10.3% | 7.1%(+3.17)#213 | 7.8%(+2.45)#4,350 |
| 24. | 15218 | 10.3% | 7.1%(+3.16)#214 | 7.8%(+2.45)#4,354 |
| 25. | 15207 | 9.4% | 7.1%(+2.28)#248 | 7.8%(+1.57)#5,079 |
| 26. | 15219 | 9.0% | 7.1%(+1.83)#270 | 7.8%(+1.11)#5,570 |
| 27. | 15209 | 8.9% | 7.1%(+1.77)#273 | 7.8%(+1.06)#5,612 |
| 28. | 15223 | 8.7% | 7.1%(+1.60)#282 | 7.8%(+0.887)#5,778 |
| 29. | 15205 | 8.0% | 7.1%(+0.849)#329 | 7.8%(+0.135)#6,689 |
| 30. | 15214 | 7.3% | 7.1%(+0.139)#383 | 7.8%(-0.575)#7,706 |
| 31. | 15234 | 7.2% | 7.1%(+0.040)#390 | 7.8%(-0.675)#7,858 |
| 32. | 15227 | 7.1% | 7.1%(-0.083)#405 | 7.8%(-0.797)#8,086 |
| 33. | 15213 | 6.4% | 7.1%(-0.707)#476 | 7.8%(-1.42)#9,162 |
| 34. | 15235 | 6.2% | 7.1%(-0.946)#498 | 7.8%(-1.66)#9,604 |
| 35. | 15239 | 6.1% | 7.1%(-1.04)#505 | 7.8%(-1.76)#9,800 |
| 36. | 15221 | 6.0% | 7.1%(-1.13)#521 | 7.8%(-1.84)#9,961 |
| 37. | 15204 | 5.7% | 7.1%(-1.38)#549 | 7.8%(-2.10)#10,463 |
| 38. | 15210 | 4.4% | 7.1%(-2.77)#746 | 7.8%(-3.49)#14,062 |
| 39. | 15225 | 2.4% | 7.1%(-4.73)#1,155 | 7.8%(-5.45)#20,544 |
| 40. | 15282 | 0.67% | 7.1%(-6.47)#1,434 | 7.8%(-7.18)#25,864 |
1
Common Questions
What are the Top 10 Zip Codes with the Highest Percentage of Population Employed in Professional & Scientific Services in Pittsburgh, PA?
Top 10 Zip Codes with the Highest Percentage of Population Employed in Professional & Scientific Services in Pittsburgh, PA are:
What zip code has the Highest Percentage of Population Employed in Professional & Scientific Services in Pittsburgh, PA?
15222 has the Highest Percentage of Population Employed in Professional & Scientific Services in Pittsburgh, PA with 23.0%.
What is the Percentage of Population Employed in Professional & Scientific Services in Pittsburgh, PA?
Percentage of Population Employed in Professional & Scientific Services in Pittsburgh is 10.5%.
What is the Percentage of Population Employed in Professional & Scientific Services in Pennsylvania?
Percentage of Population Employed in Professional & Scientific Services in Pennsylvania is 7.1%.
What is the Percentage of Population Employed in Professional & Scientific Services in the United States?
Percentage of Population Employed in Professional & Scientific Services in the United States is 7.8%.