Zip Codes with the Highest Percentage of Households with Income Below $10,000 in Scranton, PA
RELATED REPORTS & OPTIONS
Household Income | $0-10k
Scranton
Compare Zip Codes
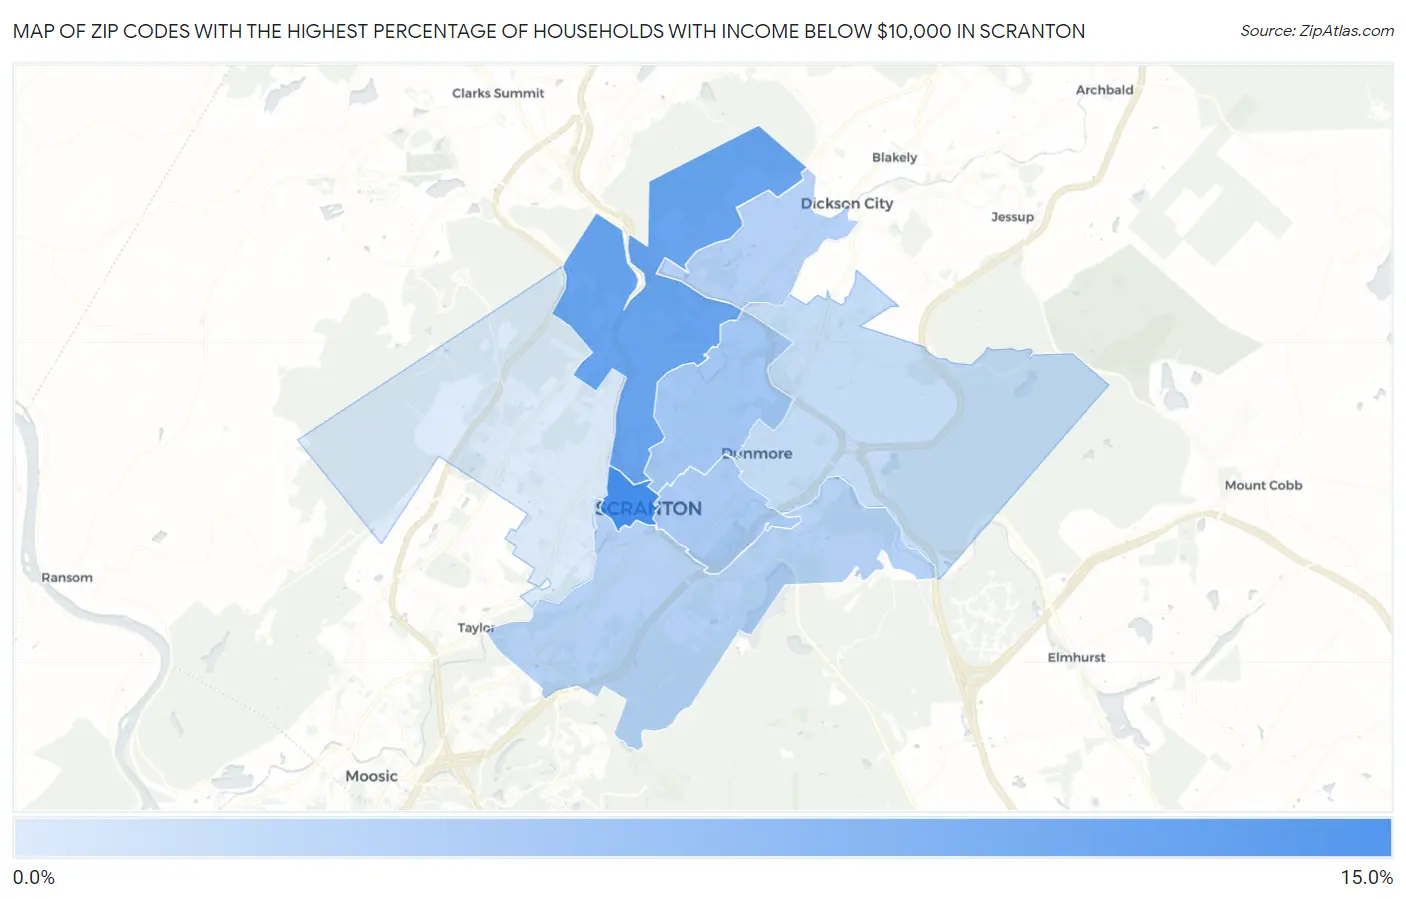
Map of Zip Codes with the Highest Percentage of Households with Income Below $10,000 in Scranton
4.0%
11.0%
Zip Codes with the Highest Percentage of Households with Income Below $10,000 in Scranton, PA
| Zip Code | Households with Income < $10k | vs State | vs National | |
| 1. | 18503 | 11.0% | 4.8%(+6.20)#108 | 4.9%(+6.10)#2,982 |
| 2. | 18508 | 9.3% | 4.8%(+4.50)#158 | 4.9%(+4.40)#4,116 |
| 3. | 18509 | 6.6% | 4.8%(+1.80)#301 | 4.9%(+1.70)#7,749 |
| 4. | 18510 | 6.3% | 4.8%(+1.50)#330 | 4.9%(+1.40)#8,368 |
| 5. | 18519 | 5.9% | 4.8%(+1.10)#369 | 4.9%(+1.00)#9,307 |
| 6. | 18505 | 5.8% | 4.8%(+1.000)#378 | 4.9%(+0.900)#9,501 |
| 7. | 18512 | 5.1% | 4.8%(+0.300)#480 | 4.9%(+0.200)#11,436 |
| 8. | 18504 | 4.0% | 4.8%(-0.800)#655 | 4.9%(-0.900)#15,293 |
1
Common Questions
What are the Top 5 Zip Codes with the Highest Percentage of Households with Income Below $10,000 in Scranton, PA?
Top 5 Zip Codes with the Highest Percentage of Households with Income Below $10,000 in Scranton, PA are:
What zip code has the Highest Percentage of Households with Income Below $10,000 in Scranton, PA?
18503 has the Highest Percentage of Households with Income Below $10,000 in Scranton, PA with 11.0%.
What is the Percentage of Households with Income Below $10,000 in Scranton, PA?
Percentage of Households with Income Below $10,000 in Scranton is 6.2%.
What is the Percentage of Households with Income Below $10,000 in Pennsylvania?
Percentage of Households with Income Below $10,000 in Pennsylvania is 4.8%.
What is the Percentage of Households with Income Below $10,000 in the United States?
Percentage of Households with Income Below $10,000 in the United States is 4.9%.