Zip Codes with the Highest Percentage of Population Employed in Farming, Fishing & Forestry in Pittsburgh, PA
RELATED REPORTS & OPTIONS
Farming, Fishing & Forestry
Pittsburgh
Compare Zip Codes
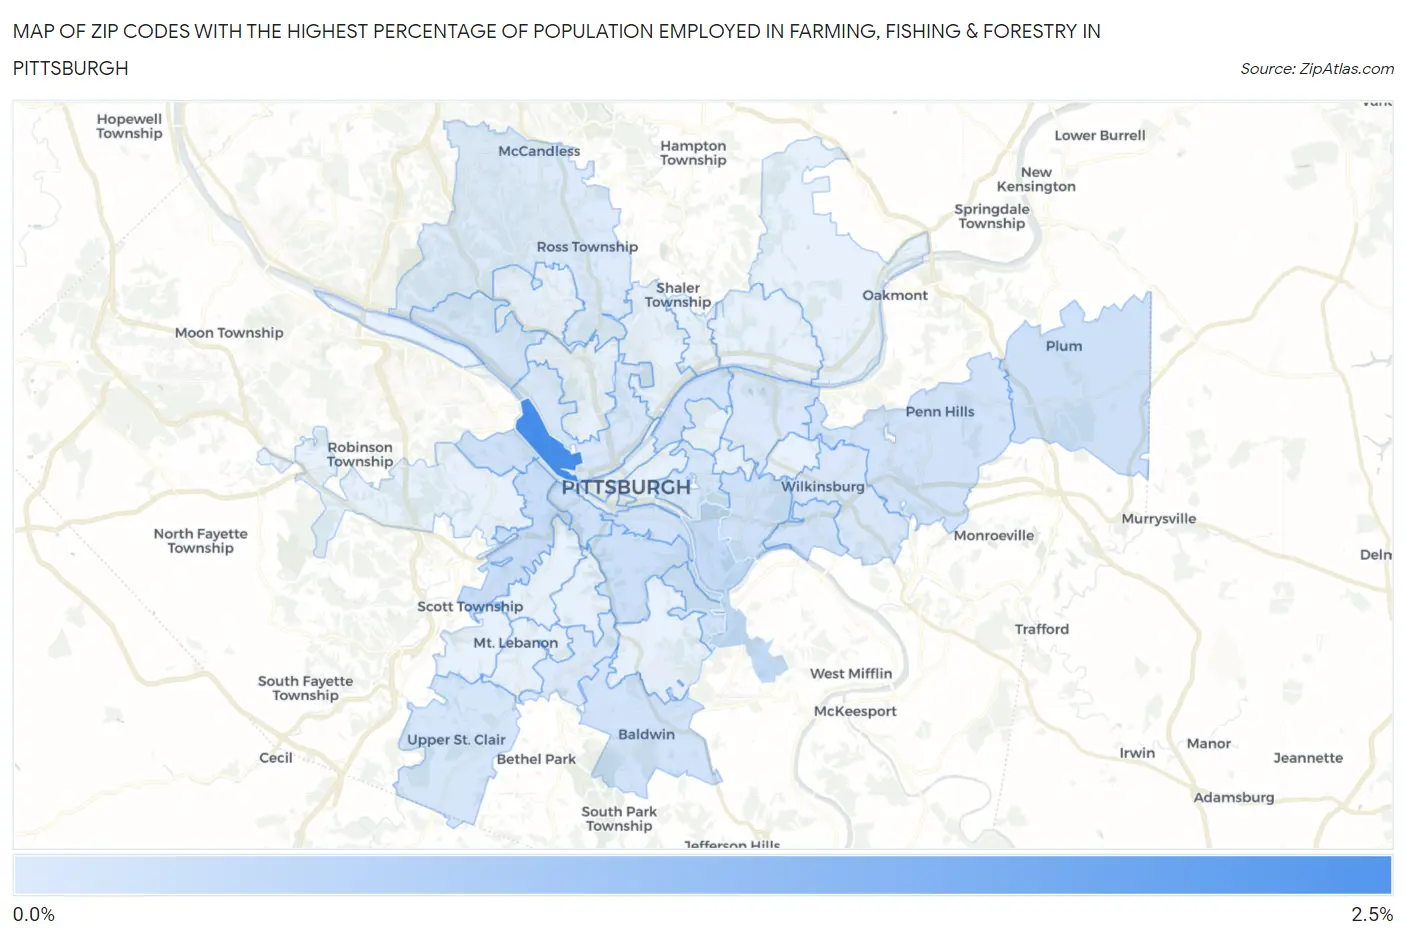
Map of Zip Codes with the Highest Percentage of Population Employed in Farming, Fishing & Forestry in Pittsburgh
0.0045%
2.1%
Zip Codes with the Highest Percentage of Population Employed in Farming, Fishing & Forestry in Pittsburgh, PA
| Zip Code | % Employed | vs State | vs National | |
| 1. | 15233 | 2.1% | 0.41%(+1.70)#182 | 0.61%(+1.50)#6,326 |
| 2. | 15207 | 0.36% | 0.41%(-0.051)#577 | 0.61%(-0.250)#14,202 |
| 3. | 15220 | 0.30% | 0.41%(-0.103)#615 | 0.61%(-0.302)#14,794 |
| 4. | 15210 | 0.21% | 0.41%(-0.193)#675 | 0.61%(-0.393)#15,952 |
| 5. | 15217 | 0.21% | 0.41%(-0.198)#680 | 0.61%(-0.397)#16,014 |
| 6. | 15204 | 0.20% | 0.41%(-0.202)#684 | 0.61%(-0.402)#16,078 |
| 7. | 15211 | 0.20% | 0.41%(-0.207)#687 | 0.61%(-0.406)#16,144 |
| 8. | 15239 | 0.19% | 0.41%(-0.213)#690 | 0.61%(-0.413)#16,233 |
| 9. | 15235 | 0.17% | 0.41%(-0.238)#704 | 0.61%(-0.437)#16,603 |
| 10. | 15203 | 0.17% | 0.41%(-0.238)#705 | 0.61%(-0.438)#16,611 |
| 11. | 15236 | 0.16% | 0.41%(-0.244)#710 | 0.61%(-0.443)#16,706 |
| 12. | 15201 | 0.16% | 0.41%(-0.244)#712 | 0.61%(-0.443)#16,711 |
| 13. | 15218 | 0.16% | 0.41%(-0.249)#717 | 0.61%(-0.449)#16,801 |
| 14. | 15202 | 0.11% | 0.41%(-0.293)#757 | 0.61%(-0.493)#17,552 |
| 15. | 15241 | 0.11% | 0.41%(-0.294)#758 | 0.61%(-0.493)#17,557 |
| 16. | 15213 | 0.094% | 0.41%(-0.311)#770 | 0.61%(-0.511)#17,852 |
| 17. | 15212 | 0.068% | 0.41%(-0.338)#802 | 0.61%(-0.538)#18,337 |
| 18. | 15221 | 0.062% | 0.41%(-0.344)#805 | 0.61%(-0.543)#18,433 |
| 19. | 15234 | 0.037% | 0.41%(-0.369)#829 | 0.61%(-0.569)#18,861 |
| 20. | 15206 | 0.036% | 0.41%(-0.370)#831 | 0.61%(-0.570)#18,875 |
| 21. | 15237 | 0.0045% | 0.41%(-0.401)#847 | 0.61%(-0.601)#19,208 |
1
Common Questions
What are the Top 10 Zip Codes with the Highest Percentage of Population Employed in Farming, Fishing & Forestry in Pittsburgh, PA?
Top 10 Zip Codes with the Highest Percentage of Population Employed in Farming, Fishing & Forestry in Pittsburgh, PA are:
What zip code has the Highest Percentage of Population Employed in Farming, Fishing & Forestry in Pittsburgh, PA?
15233 has the Highest Percentage of Population Employed in Farming, Fishing & Forestry in Pittsburgh, PA with 2.1%.
What is the Percentage of Population Employed in Farming, Fishing & Forestry in Pittsburgh, PA?
Percentage of Population Employed in Farming, Fishing & Forestry in Pittsburgh is 0.11%.
What is the Percentage of Population Employed in Farming, Fishing & Forestry in Pennsylvania?
Percentage of Population Employed in Farming, Fishing & Forestry in Pennsylvania is 0.41%.
What is the Percentage of Population Employed in Farming, Fishing & Forestry in the United States?
Percentage of Population Employed in Farming, Fishing & Forestry in the United States is 0.61%.