Zip Codes with the Highest Percentage of Population with a Degree in Physical and Health Sciences in Pittsburgh, PA
RELATED REPORTS & OPTIONS
Physical and Health Sciences
Pittsburgh
Compare Zip Codes
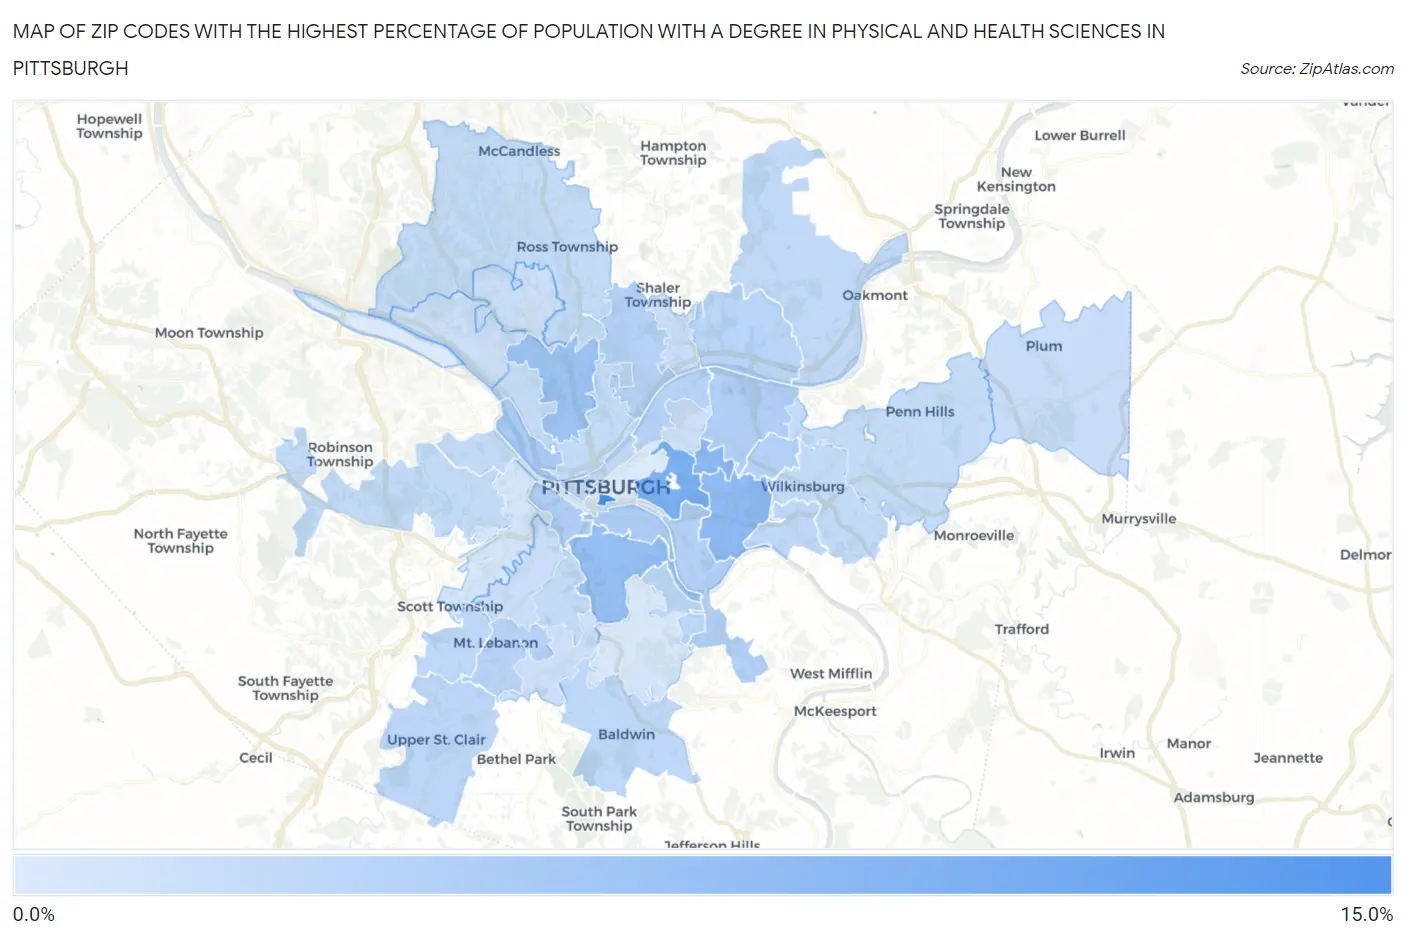
Map of Zip Codes with the Highest Percentage of Population with a Degree in Physical and Health Sciences in Pittsburgh
1.1%
13.7%
Zip Codes with the Highest Percentage of Population with a Degree in Physical and Health Sciences in Pittsburgh, PA
| Zip Code | % Graduates | vs State | vs National | |
| 1. | 15282 | 13.7% | 3.3%(+10.4)#30 | 3.1%(+10.6)#797 |
| 2. | 15213 | 9.1% | 3.3%(+5.86)#80 | 3.1%(+6.04)#1,611 |
| 3. | 15232 | 7.9% | 3.3%(+4.58)#97 | 3.1%(+4.76)#2,070 |
| 4. | 15217 | 7.4% | 3.3%(+4.16)#107 | 3.1%(+4.33)#2,281 |
| 5. | 15210 | 6.9% | 3.3%(+3.61)#130 | 3.1%(+3.79)#2,582 |
| 6. | 15214 | 6.1% | 3.3%(+2.84)#162 | 3.1%(+3.01)#3,155 |
| 7. | 15233 | 5.3% | 3.3%(+2.00)#232 | 3.1%(+2.18)#4,114 |
| 8. | 15203 | 4.9% | 3.3%(+1.65)#266 | 3.1%(+1.83)#4,698 |
| 9. | 15211 | 4.9% | 3.3%(+1.58)#275 | 3.1%(+1.76)#4,811 |
| 10. | 15206 | 4.6% | 3.3%(+1.29)#301 | 3.1%(+1.47)#5,404 |
| 11. | 15208 | 4.5% | 3.3%(+1.18)#313 | 3.1%(+1.36)#5,621 |
| 12. | 15207 | 4.4% | 3.3%(+1.16)#314 | 3.1%(+1.34)#5,669 |
| 13. | 15209 | 4.3% | 3.3%(+1.03)#334 | 3.1%(+1.21)#5,949 |
| 14. | 15201 | 4.3% | 3.3%(+0.974)#354 | 3.1%(+1.15)#6,075 |
| 15. | 15228 | 4.0% | 3.3%(+0.712)#393 | 3.1%(+0.890)#6,791 |
| 16. | 15215 | 3.9% | 3.3%(+0.656)#400 | 3.1%(+0.833)#6,937 |
| 17. | 15241 | 3.6% | 3.3%(+0.372)#461 | 3.1%(+0.550)#7,880 |
| 18. | 15236 | 3.5% | 3.3%(+0.218)#491 | 3.1%(+0.395)#8,451 |
| 19. | 15218 | 3.5% | 3.3%(+0.196)#498 | 3.1%(+0.373)#8,538 |
| 20. | 15243 | 3.4% | 3.3%(+0.153)#504 | 3.1%(+0.331)#8,690 |
| 21. | 15238 | 3.4% | 3.3%(+0.127)#511 | 3.1%(+0.304)#8,781 |
| 22. | 15222 | 3.3% | 3.3%(+0.024)#529 | 3.1%(+0.202)#9,188 |
| 23. | 15221 | 3.2% | 3.3%(-0.086)#552 | 3.1%(+0.092)#9,611 |
| 24. | 15226 | 3.1% | 3.3%(-0.129)#563 | 3.1%(+0.049)#9,781 |
| 25. | 15204 | 3.1% | 3.3%(-0.171)#571 | 3.1%(+0.007)#9,952 |
| 26. | 15205 | 3.0% | 3.3%(-0.232)#590 | 3.1%(-0.054)#10,226 |
| 27. | 15235 | 3.0% | 3.3%(-0.314)#614 | 3.1%(-0.136)#10,580 |
| 28. | 15237 | 3.0% | 3.3%(-0.317)#615 | 3.1%(-0.139)#10,604 |
| 29. | 15212 | 2.9% | 3.3%(-0.345)#620 | 3.1%(-0.167)#10,737 |
| 30. | 15239 | 2.8% | 3.3%(-0.436)#638 | 3.1%(-0.258)#11,127 |
| 31. | 15223 | 2.5% | 3.3%(-0.744)#699 | 3.1%(-0.567)#12,565 |
| 32. | 15216 | 2.5% | 3.3%(-0.759)#704 | 3.1%(-0.581)#12,648 |
| 33. | 15234 | 2.4% | 3.3%(-0.842)#727 | 3.1%(-0.664)#13,026 |
| 34. | 15202 | 2.4% | 3.3%(-0.879)#739 | 3.1%(-0.701)#13,194 |
| 35. | 15224 | 2.4% | 3.3%(-0.880)#741 | 3.1%(-0.702)#13,201 |
| 36. | 15229 | 2.3% | 3.3%(-0.930)#755 | 3.1%(-0.752)#13,444 |
| 37. | 15220 | 1.9% | 3.3%(-1.36)#860 | 3.1%(-1.19)#15,473 |
| 38. | 15227 | 1.4% | 3.3%(-1.85)#955 | 3.1%(-1.67)#17,616 |
| 39. | 15219 | 1.2% | 3.3%(-2.11)#1,009 | 3.1%(-1.93)#18,649 |
| 40. | 15225 | 1.1% | 3.3%(-2.18)#1,021 | 3.1%(-2.01)#18,907 |
1
Common Questions
What are the Top 10 Zip Codes with the Highest Percentage of Population with a Degree in Physical and Health Sciences in Pittsburgh, PA?
Top 10 Zip Codes with the Highest Percentage of Population with a Degree in Physical and Health Sciences in Pittsburgh, PA are:
What zip code has the Highest Percentage of Population with a Degree in Physical and Health Sciences in Pittsburgh, PA?
15282 has the Highest Percentage of Population with a Degree in Physical and Health Sciences in Pittsburgh, PA with 13.7%.
What is the Percentage of Population with a Degree in Physical and Health Sciences in Pittsburgh, PA?
Percentage of Population with a Degree in Physical and Health Sciences in Pittsburgh is 5.1%.
What is the Percentage of Population with a Degree in Physical and Health Sciences in Pennsylvania?
Percentage of Population with a Degree in Physical and Health Sciences in Pennsylvania is 3.3%.
What is the Percentage of Population with a Degree in Physical and Health Sciences in the United States?
Percentage of Population with a Degree in Physical and Health Sciences in the United States is 3.1%.