Cassopolis, MI Map & Demographics
Cassopolis Map
Cassopolis Overview
$21,507
PER CAPITA INCOME
$48,963
AVG FAMILY INCOME
$39,107
AVG HOUSEHOLD INCOME
18.8%
WAGE / INCOME GAP [ % ]
81.2¢/ $1
WAGE / INCOME GAP [ $ ]
0.43
INEQUALITY / GINI INDEX
1,750
TOTAL POPULATION
894
MALE POPULATION
856
FEMALE POPULATION
104.44
MALES / 100 FEMALES
95.75
FEMALES / 100 MALES
41.2
MEDIAN AGE
2.9
AVG FAMILY SIZE
2.2
AVG HOUSEHOLD SIZE
811
LABOR FORCE [ PEOPLE ]
56.9%
PERCENT IN LABOR FORCE
15.4%
UNEMPLOYMENT RATE
Cassopolis Zip Codes
Cassopolis Area Codes
Income in Cassopolis
Income Overview in Cassopolis
Per Capita Income in Cassopolis is $21,507, while median incomes of families and households are $48,963 and $39,107 respectively.
| Characteristic | Number | Measure |
| Per Capita Income | 1,750 | $21,507 |
| Median Family Income | 396 | $48,963 |
| Mean Family Income | 396 | $55,140 |
| Median Household Income | 759 | $39,107 |
| Mean Household Income | 759 | $49,422 |
| Income Deficit | 396 | $0 |
| Wage / Income Gap (%) | 1,750 | 18.84% |
| Wage / Income Gap ($) | 1,750 | 81.16¢ per $1 |
| Gini / Inequality Index | 1,750 | 0.43 |
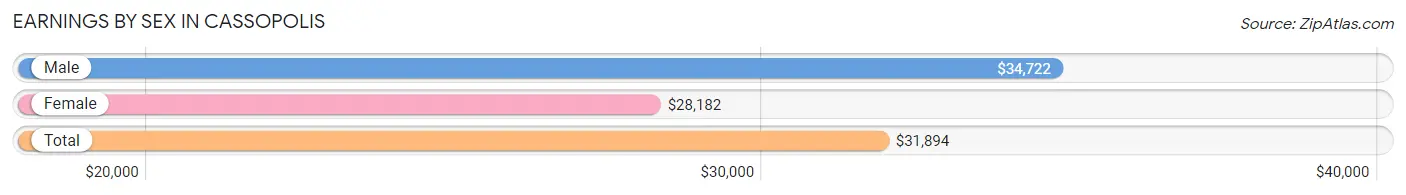
Earnings by Sex in Cassopolis
Average Earnings in Cassopolis are $31,894, $34,722 for men and $28,182 for women, a difference of 18.8%.
| Sex | Number | Average Earnings |
| Male | 462 (55.9%) | $34,722 |
| Female | 364 (44.1%) | $28,182 |
| Total | 826 (100.0%) | $31,894 |
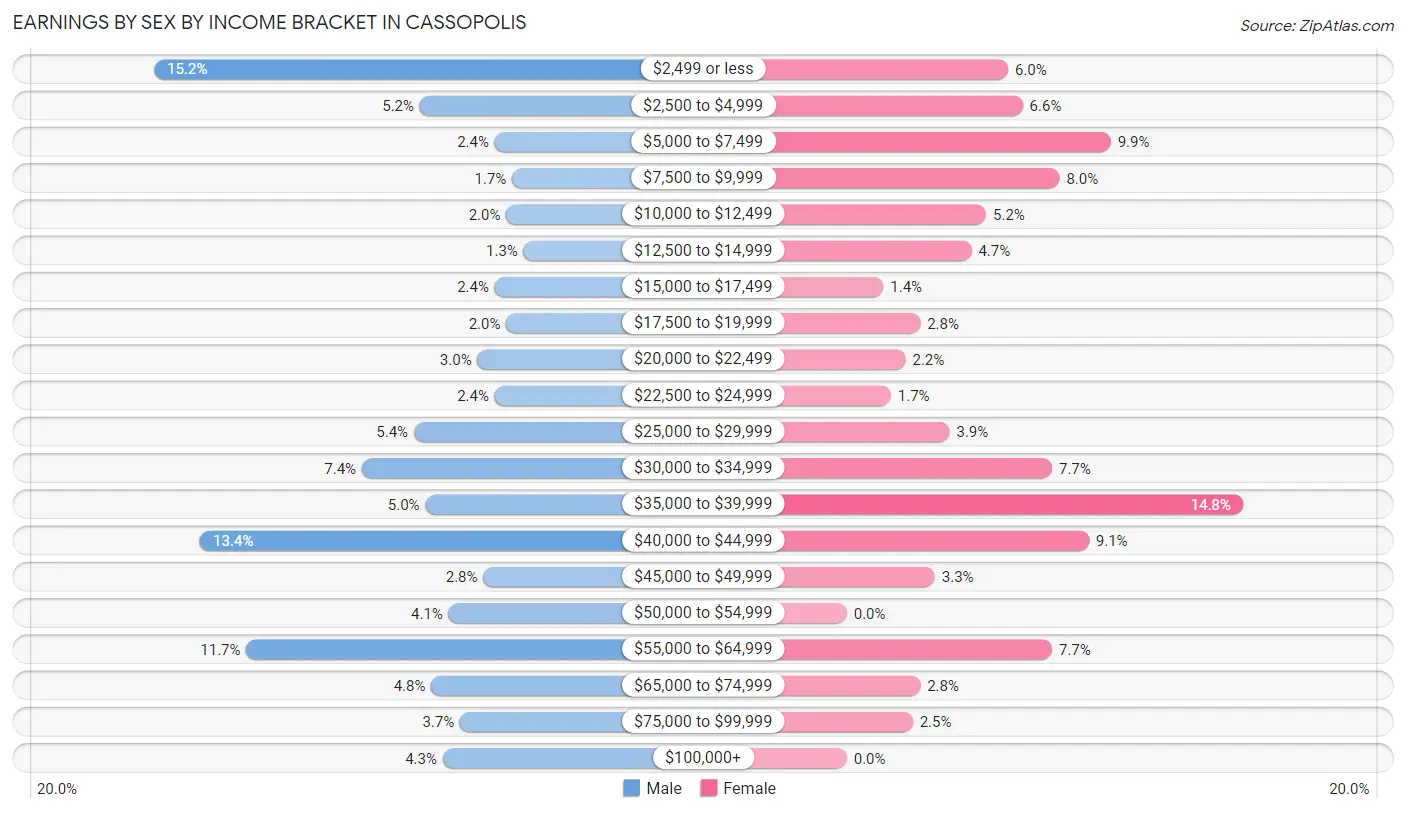
Earnings by Sex by Income Bracket in Cassopolis
The most common earnings brackets in Cassopolis are $2,499 or less for men (70 | 15.1%) and $35,000 to $39,999 for women (54 | 14.8%).
| Income | Male | Female |
| $2,499 or less | 70 (15.1%) | 22 (6.0%) |
| $2,500 to $4,999 | 24 (5.2%) | 24 (6.6%) |
| $5,000 to $7,499 | 11 (2.4%) | 36 (9.9%) |
| $7,500 to $9,999 | 8 (1.7%) | 29 (8.0%) |
| $10,000 to $12,499 | 9 (1.9%) | 19 (5.2%) |
| $12,500 to $14,999 | 6 (1.3%) | 17 (4.7%) |
| $15,000 to $17,499 | 11 (2.4%) | 5 (1.4%) |
| $17,500 to $19,999 | 9 (1.9%) | 10 (2.8%) |
| $20,000 to $22,499 | 14 (3.0%) | 8 (2.2%) |
| $22,500 to $24,999 | 11 (2.4%) | 6 (1.7%) |
| $25,000 to $29,999 | 25 (5.4%) | 14 (3.8%) |
| $30,000 to $34,999 | 34 (7.4%) | 28 (7.7%) |
| $35,000 to $39,999 | 23 (5.0%) | 54 (14.8%) |
| $40,000 to $44,999 | 62 (13.4%) | 33 (9.1%) |
| $45,000 to $49,999 | 13 (2.8%) | 12 (3.3%) |
| $50,000 to $54,999 | 19 (4.1%) | 0 (0.0%) |
| $55,000 to $64,999 | 54 (11.7%) | 28 (7.7%) |
| $65,000 to $74,999 | 22 (4.8%) | 10 (2.8%) |
| $75,000 to $99,999 | 17 (3.7%) | 9 (2.5%) |
| $100,000+ | 20 (4.3%) | 0 (0.0%) |
| Total | 462 (100.0%) | 364 (100.0%) |
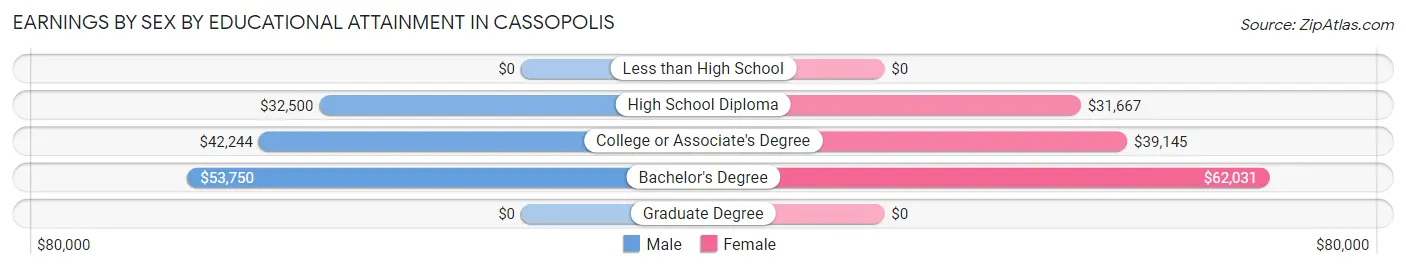
Earnings by Sex by Educational Attainment in Cassopolis
Average earnings in Cassopolis are $40,689 for men and $34,938 for women, a difference of 14.1%. Men with an educational attainment of bachelor's degree enjoy the highest average annual earnings of $53,750, while those with high school diploma education earn the least with $32,500. Women with an educational attainment of bachelor's degree earn the most with the average annual earnings of $62,031, while those with high school diploma education have the smallest earnings of $31,667.
| Educational Attainment | Male Income | Female Income |
| Less than High School | - | - |
| High School Diploma | $32,500 | $31,667 |
| College or Associate's Degree | $42,244 | $39,145 |
| Bachelor's Degree | $53,750 | $62,031 |
| Graduate Degree | - | - |
| Total | $40,689 | $34,938 |
Family Income in Cassopolis
Family Income Brackets in Cassopolis
According to the Cassopolis family income data, there are 100 families falling into the $35,000 to $49,999 income range, which is the most common income bracket and makes up 25.3% of all families. Conversely, the $200,000+ income bracket is the least frequent group with only 1 families (0.3%) belonging to this category.
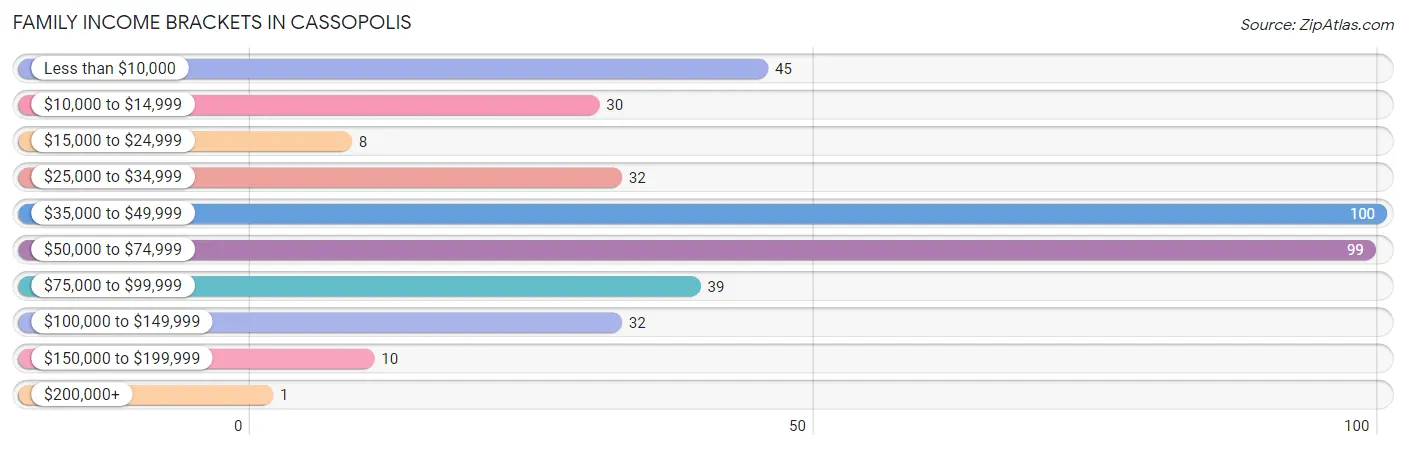
| Income Bracket | # Families | % Families |
| Less than $10,000 | 45 | 11.4% |
| $10,000 to $14,999 | 30 | 7.6% |
| $15,000 to $24,999 | 8 | 2.0% |
| $25,000 to $34,999 | 32 | 8.1% |
| $35,000 to $49,999 | 100 | 25.3% |
| $50,000 to $74,999 | 99 | 25.0% |
| $75,000 to $99,999 | 39 | 9.8% |
| $100,000 to $149,999 | 32 | 8.1% |
| $150,000 to $199,999 | 10 | 2.5% |
| $200,000+ | 1 | 0.3% |
Family Income by Famaliy Size in Cassopolis
4-person families (40 | 10.1%) account for the highest median family income in Cassopolis with $68,000 per family, while 2-person families (247 | 62.4%) have the highest median income of $24,070 per family member.
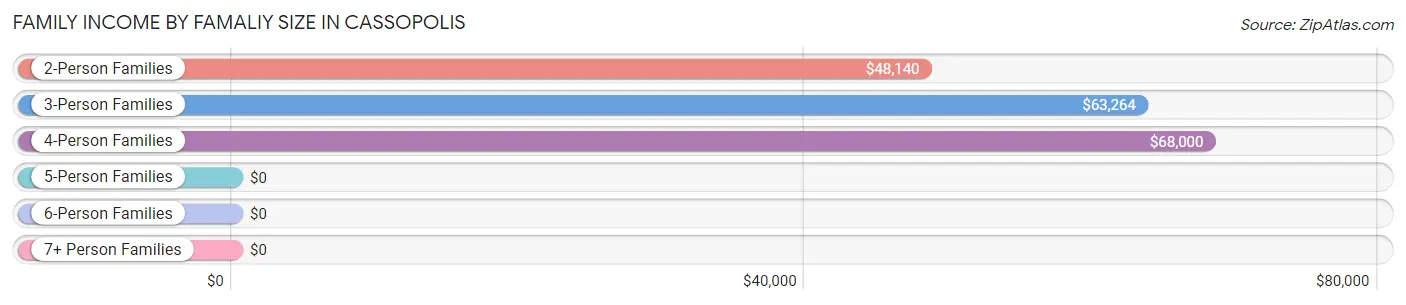
| Income Bracket | # Families | Median Income |
| 2-Person Families | 247 (62.4%) | $48,140 |
| 3-Person Families | 69 (17.4%) | $63,264 |
| 4-Person Families | 40 (10.1%) | $68,000 |
| 5-Person Families | 9 (2.3%) | $0 |
| 6-Person Families | 18 (4.5%) | $0 |
| 7+ Person Families | 13 (3.3%) | $0 |
| Total | 396 (100.0%) | $48,963 |
Family Income by Number of Earners in Cassopolis
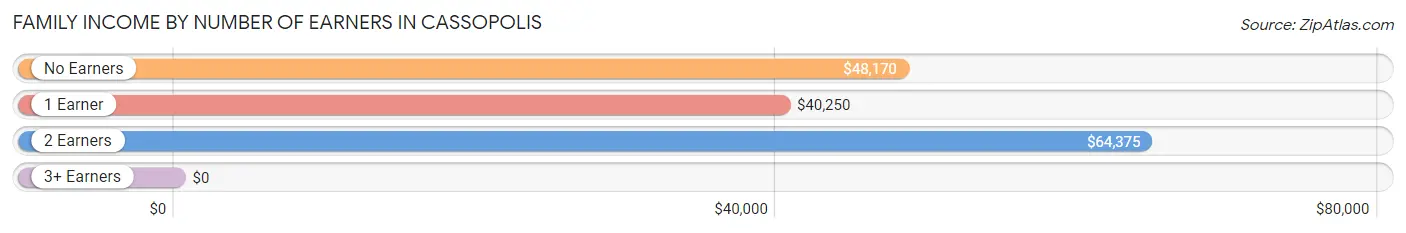
| Number of Earners | # Families | Median Income |
| No Earners | 69 (17.4%) | $48,170 |
| 1 Earner | 156 (39.4%) | $40,250 |
| 2 Earners | 159 (40.2%) | $64,375 |
| 3+ Earners | 12 (3.0%) | $0 |
| Total | 396 (100.0%) | $48,963 |
Household Income in Cassopolis
Household Income Brackets in Cassopolis
With 150 households falling in the category, the $35,000 to $49,999 income range is the most frequent in Cassopolis, accounting for 19.8% of all households. In contrast, only 1 households (0.1%) fall into the $200,000+ income bracket, making it the least populous group.
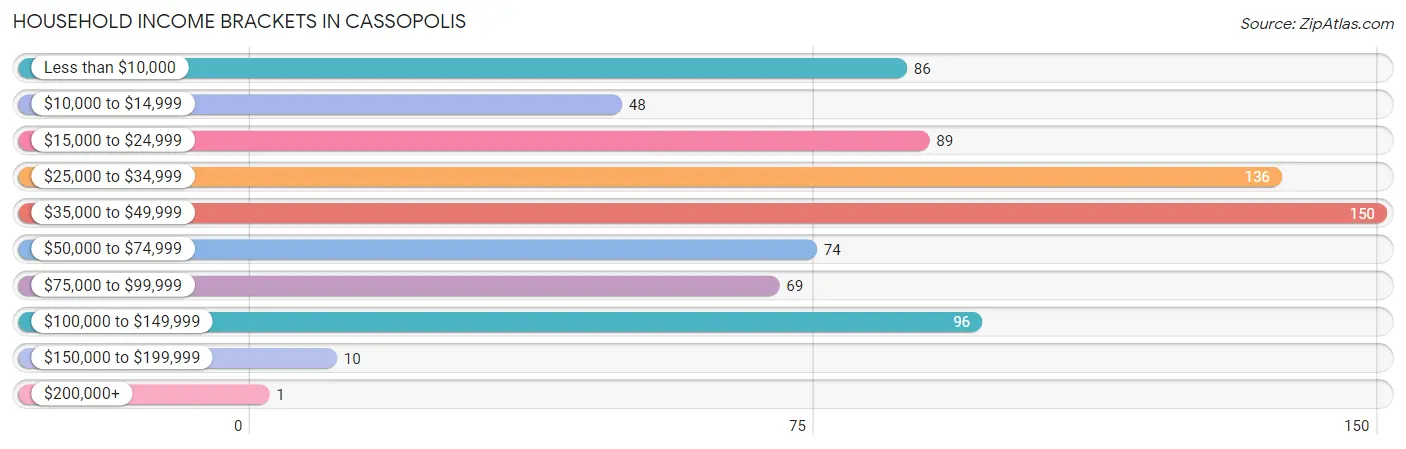
| Income Bracket | # Households | % Households |
| Less than $10,000 | 86 | 11.3% |
| $10,000 to $14,999 | 48 | 6.3% |
| $15,000 to $24,999 | 89 | 11.7% |
| $25,000 to $34,999 | 136 | 17.9% |
| $35,000 to $49,999 | 150 | 19.8% |
| $50,000 to $74,999 | 74 | 9.7% |
| $75,000 to $99,999 | 69 | 9.1% |
| $100,000 to $149,999 | 96 | 12.6% |
| $150,000 to $199,999 | 10 | 1.3% |
| $200,000+ | 1 | 0.1% |
Household Income by Householder Age in Cassopolis
The median household income in Cassopolis is $39,107, with the highest median household income of $42,778 found in the 25 to 44 years age bracket for the primary householder. A total of 174 households (22.9%) fall into this category. Meanwhile, the 15 to 24 years age bracket for the primary householder has the lowest median household income of $0, with 57 households (7.5%) in this group.
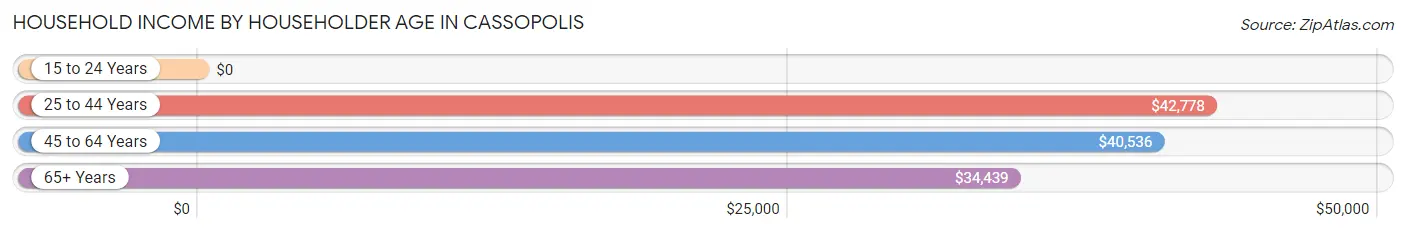
| Income Bracket | # Households | Median Income |
| 15 to 24 Years | 57 (7.5%) | $0 |
| 25 to 44 Years | 174 (22.9%) | $42,778 |
| 45 to 64 Years | 332 (43.7%) | $40,536 |
| 65+ Years | 196 (25.8%) | $34,439 |
| Total | 759 (100.0%) | $39,107 |
Poverty in Cassopolis
Income Below Poverty by Sex and Age in Cassopolis
With 20.1% poverty level for males and 32.0% for females among the residents of Cassopolis, 16 and 17 year old males and 5 year old females are the most vulnerable to poverty, with 15 males (100.0%) and 3 females (100.0%) in their respective age groups living below the poverty level.
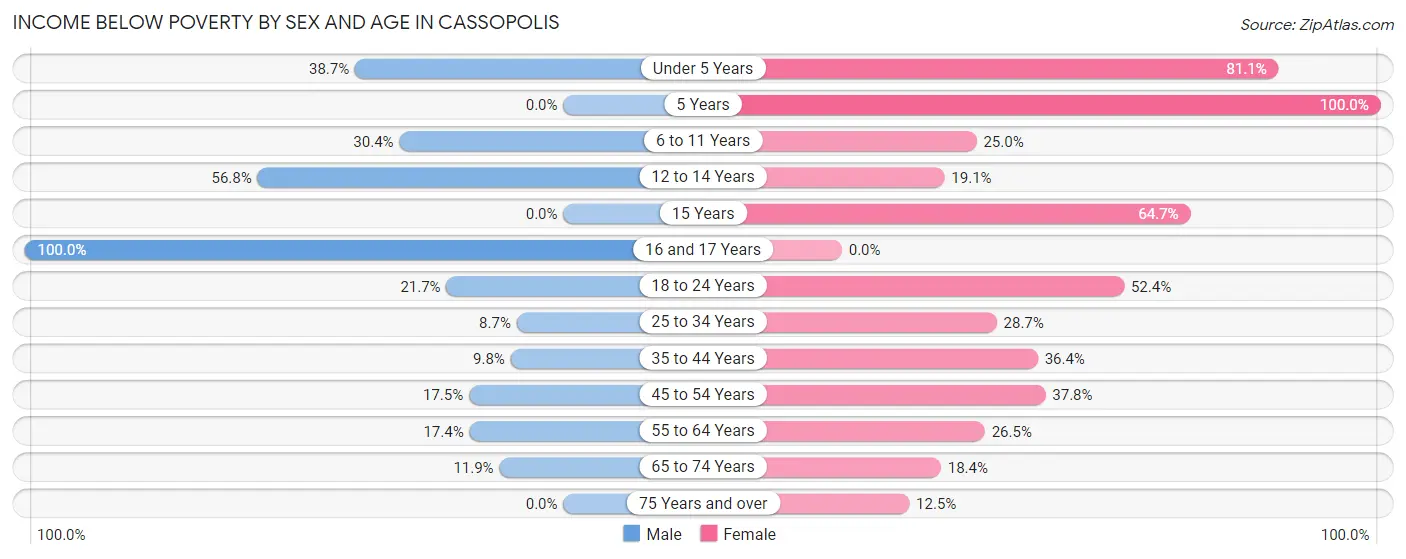
| Age Bracket | Male | Female |
| Under 5 Years | 29 (38.7%) | 30 (81.1%) |
| 5 Years | 0 (0.0%) | 3 (100.0%) |
| 6 to 11 Years | 14 (30.4%) | 13 (25.0%) |
| 12 to 14 Years | 21 (56.8%) | 4 (19.1%) |
| 15 Years | 0 (0.0%) | 11 (64.7%) |
| 16 and 17 Years | 15 (100.0%) | 0 (0.0%) |
| 18 to 24 Years | 23 (21.7%) | 44 (52.4%) |
| 25 to 34 Years | 9 (8.6%) | 25 (28.7%) |
| 35 to 44 Years | 9 (9.8%) | 40 (36.4%) |
| 45 to 54 Years | 21 (17.5%) | 51 (37.8%) |
| 55 to 64 Years | 23 (17.4%) | 26 (26.5%) |
| 65 to 74 Years | 7 (11.9%) | 9 (18.4%) |
| 75 Years and over | 0 (0.0%) | 15 (12.5%) |
| Total | 171 (20.1%) | 271 (32.0%) |
Income Above Poverty by Sex and Age in Cassopolis
According to the poverty statistics in Cassopolis, males aged 5 years and females aged 16 and 17 years are the age groups that are most secure financially, with 100.0% of males and 100.0% of females in these age groups living above the poverty line.
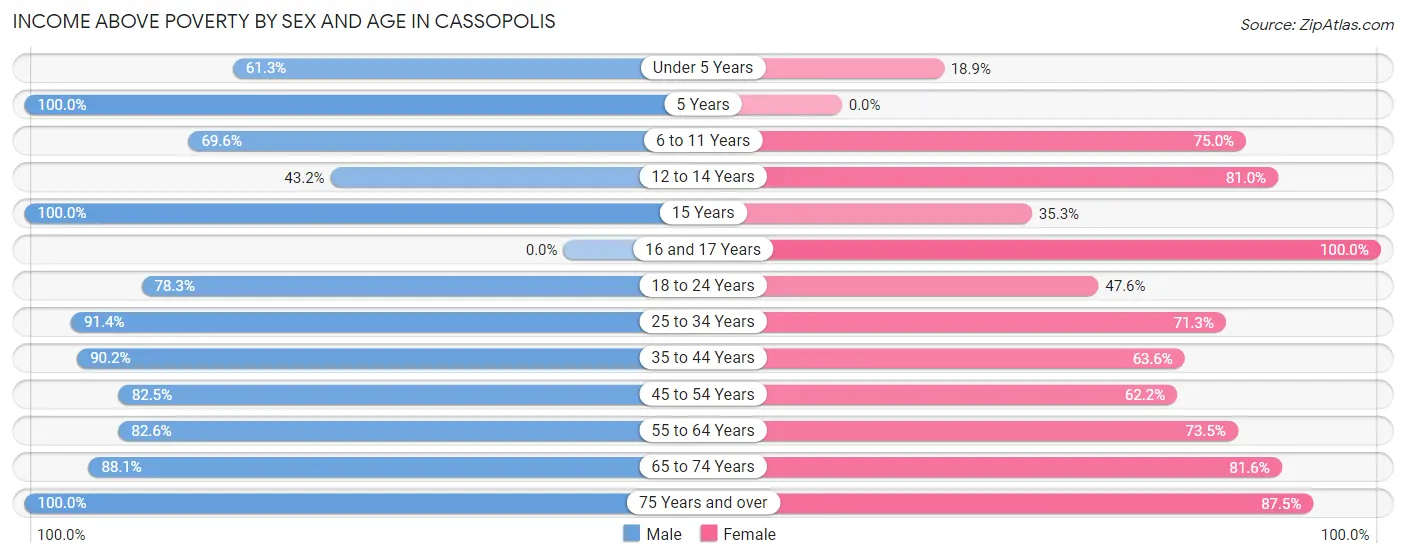
| Age Bracket | Male | Female |
| Under 5 Years | 46 (61.3%) | 7 (18.9%) |
| 5 Years | 7 (100.0%) | 0 (0.0%) |
| 6 to 11 Years | 32 (69.6%) | 39 (75.0%) |
| 12 to 14 Years | 16 (43.2%) | 17 (80.9%) |
| 15 Years | 22 (100.0%) | 6 (35.3%) |
| 16 and 17 Years | 0 (0.0%) | 34 (100.0%) |
| 18 to 24 Years | 83 (78.3%) | 40 (47.6%) |
| 25 to 34 Years | 95 (91.3%) | 62 (71.3%) |
| 35 to 44 Years | 83 (90.2%) | 70 (63.6%) |
| 45 to 54 Years | 99 (82.5%) | 84 (62.2%) |
| 55 to 64 Years | 109 (82.6%) | 72 (73.5%) |
| 65 to 74 Years | 52 (88.1%) | 40 (81.6%) |
| 75 Years and over | 35 (100.0%) | 105 (87.5%) |
| Total | 679 (79.9%) | 576 (68.0%) |
Income Below Poverty Among Married-Couple Families in Cassopolis
The poverty statistics for married-couple families in Cassopolis show that 9.2% or 21 of the total 227 families live below the poverty line. Families with 3 or 4 children have the highest poverty rate of 44.4%, comprising of 4 families. On the other hand, families with 5 or more children have the lowest poverty rate of 0.0%, which includes 0 families.
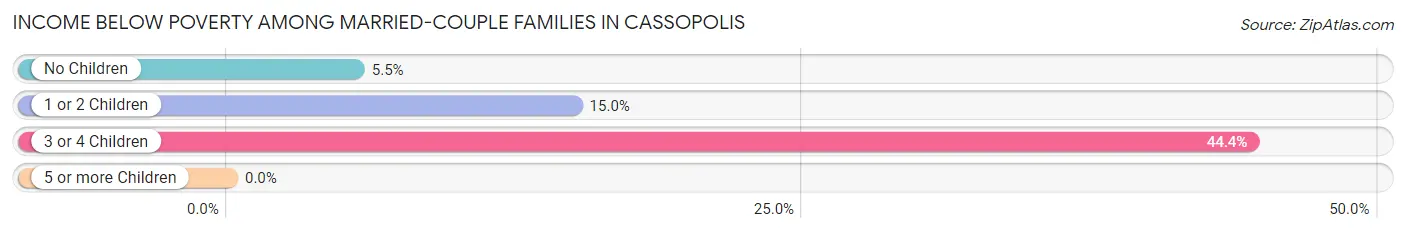
| Children | Above Poverty | Below Poverty |
| No Children | 137 (94.5%) | 8 (5.5%) |
| 1 or 2 Children | 51 (85.0%) | 9 (15.0%) |
| 3 or 4 Children | 5 (55.6%) | 4 (44.4%) |
| 5 or more Children | 13 (100.0%) | 0 (0.0%) |
| Total | 206 (90.7%) | 21 (9.2%) |
Income Below Poverty Among Single-Parent Households in Cassopolis
According to the poverty data in Cassopolis, 26.7% or 23 single-father households and 51.8% or 43 single-mother households are living below the poverty line. Among single-father households, those with 5 or more children have the highest poverty rate, with 5 households (100.0%) experiencing poverty. Likewise, among single-mother households, those with 1 or 2 children have the highest poverty rate, with 43 households (65.1%) falling below the poverty line.
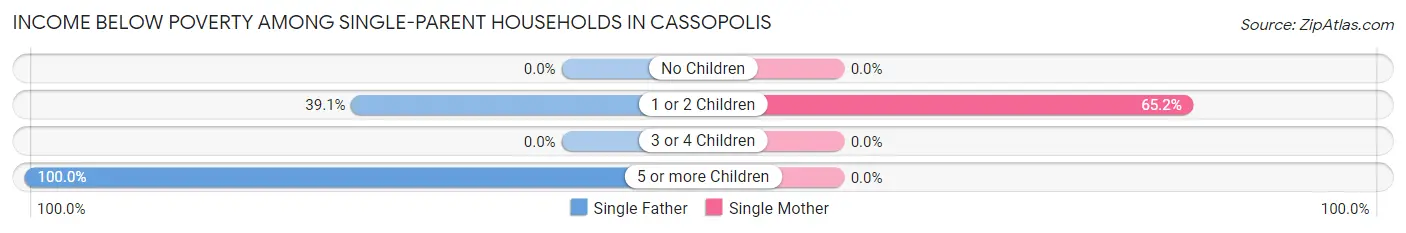
| Children | Single Father | Single Mother |
| No Children | 0 (0.0%) | 0 (0.0%) |
| 1 or 2 Children | 18 (39.1%) | 43 (65.1%) |
| 3 or 4 Children | 0 (0.0%) | 0 (0.0%) |
| 5 or more Children | 5 (100.0%) | 0 (0.0%) |
| Total | 23 (26.7%) | 43 (51.8%) |
Income Below Poverty Among Married-Couple vs Single-Parent Households in Cassopolis
The poverty data for Cassopolis shows that 21 of the married-couple family households (9.2%) and 66 of the single-parent households (39.1%) are living below the poverty level. Within the married-couple family households, those with 3 or 4 children have the highest poverty rate, with 4 households (44.4%) falling below the poverty line. Among the single-parent households, those with 5 or more children have the highest poverty rate, with 5 household (100.0%) living below poverty.
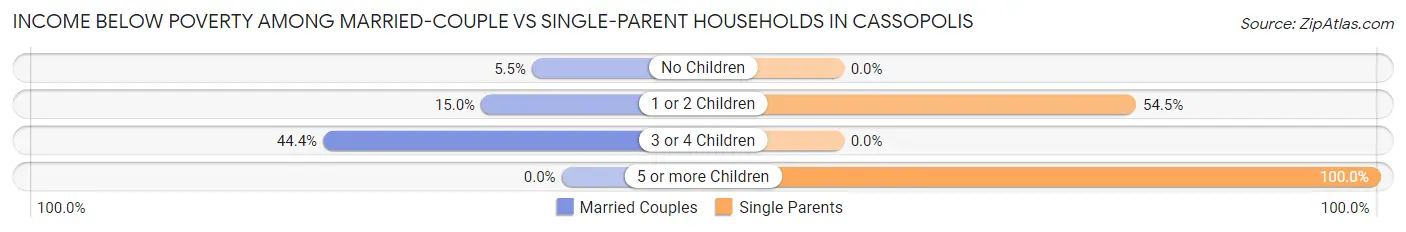
| Children | Married-Couple Families | Single-Parent Households |
| No Children | 8 (5.5%) | 0 (0.0%) |
| 1 or 2 Children | 9 (15.0%) | 61 (54.5%) |
| 3 or 4 Children | 4 (44.4%) | 0 (0.0%) |
| 5 or more Children | 0 (0.0%) | 5 (100.0%) |
| Total | 21 (9.2%) | 66 (39.1%) |
Race in Cassopolis
The most populous races in Cassopolis are White / Caucasian (893 | 51.0%), Black / African American (580 | 33.1%), and Two or more Races (210 | 12.0%).
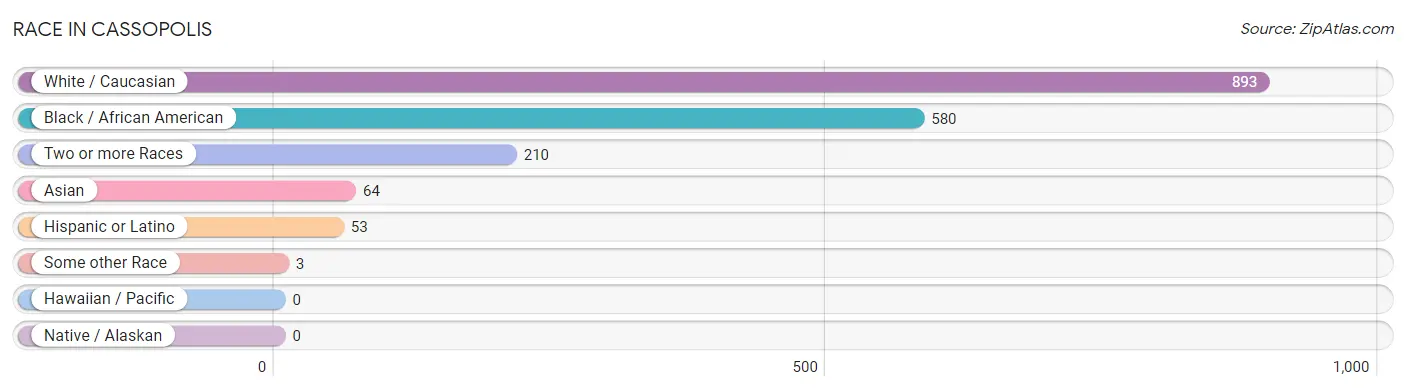
| Race | # Population | % Population |
| Asian | 64 | 3.7% |
| Black / African American | 580 | 33.1% |
| Hawaiian / Pacific | 0 | 0.0% |
| Hispanic or Latino | 53 | 3.0% |
| Native / Alaskan | 0 | 0.0% |
| White / Caucasian | 893 | 51.0% |
| Two or more Races | 210 | 12.0% |
| Some other Race | 3 | 0.2% |
| Total | 1,750 | 100.0% |
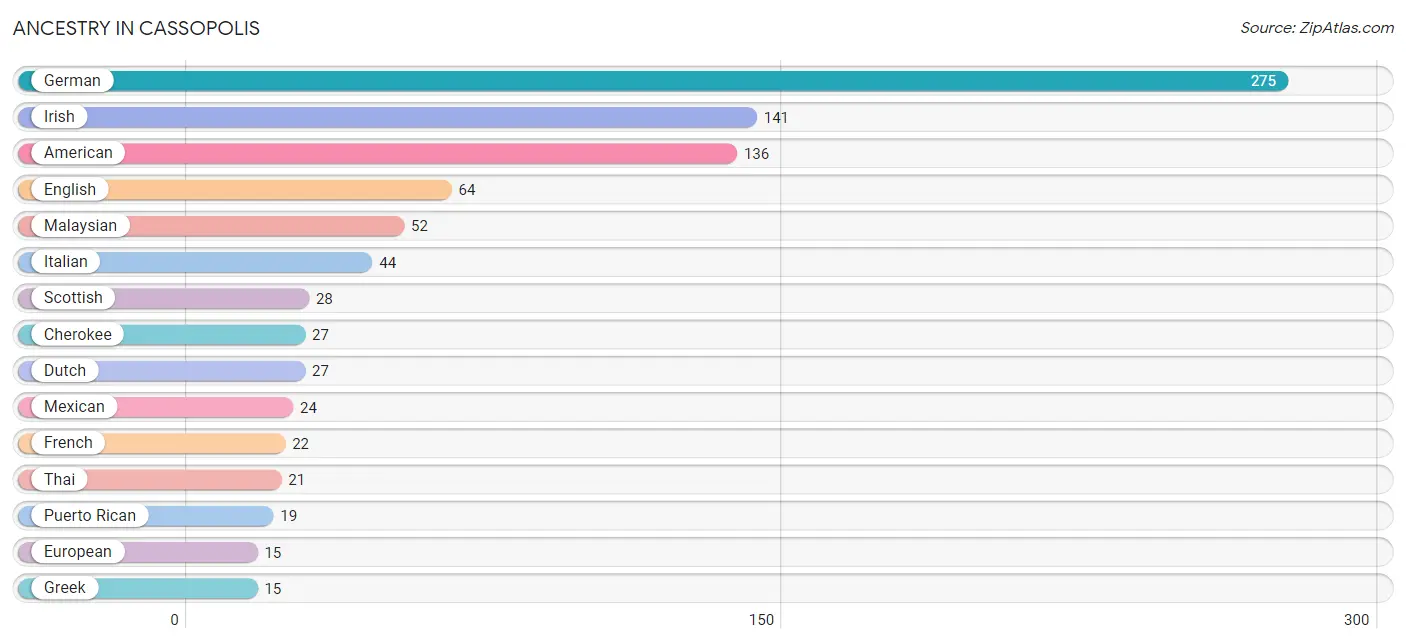
Ancestry in Cassopolis
The most populous ancestries reported in Cassopolis are German (275 | 15.7%), Irish (141 | 8.1%), American (136 | 7.8%), English (64 | 3.7%), and Malaysian (52 | 3.0%), together accounting for 38.2% of all Cassopolis residents.
| Ancestry | # Population | % Population |
| African | 6 | 0.3% |
| American | 136 | 7.8% |
| Belgian | 11 | 0.6% |
| Central American | 3 | 0.2% |
| Central American Indian | 11 | 0.6% |
| Cherokee | 27 | 1.5% |
| Croatian | 4 | 0.2% |
| Czech | 10 | 0.6% |
| Dutch | 27 | 1.5% |
| English | 64 | 3.7% |
| European | 15 | 0.9% |
| French | 22 | 1.3% |
| German | 275 | 15.7% |
| Greek | 15 | 0.9% |
| Hungarian | 7 | 0.4% |
| Inupiat | 11 | 0.6% |
| Irish | 141 | 8.1% |
| Italian | 44 | 2.5% |
| Malaysian | 52 | 3.0% |
| Mexican | 24 | 1.4% |
| Ottawa | 4 | 0.2% |
| Pennsylvania German | 3 | 0.2% |
| Polish | 13 | 0.7% |
| Puerto Rican | 19 | 1.1% |
| Russian | 4 | 0.2% |
| Salvadoran | 3 | 0.2% |
| Scandinavian | 12 | 0.7% |
| Scotch-Irish | 11 | 0.6% |
| Scottish | 28 | 1.6% |
| Spanish | 7 | 0.4% |
| Subsaharan African | 6 | 0.3% |
| Swedish | 5 | 0.3% |
| Thai | 21 | 1.2% |
| Ukrainian | 5 | 0.3% | View All 34 Rows |
Immigrants in Cassopolis
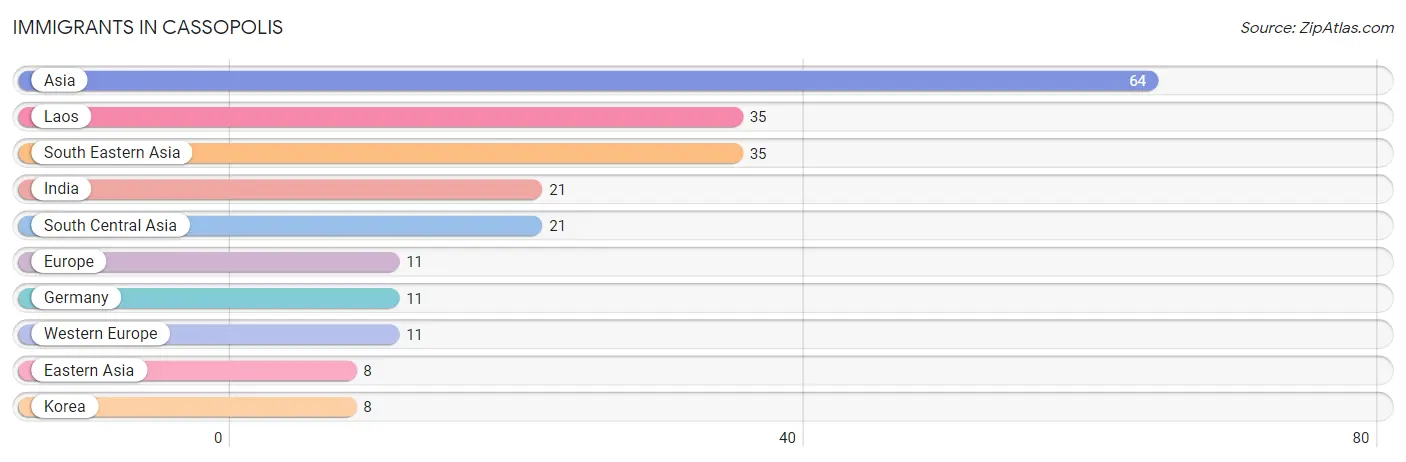
The most numerous immigrant groups reported in Cassopolis came from Asia (64 | 3.7%), Laos (35 | 2.0%), South Eastern Asia (35 | 2.0%), India (21 | 1.2%), and South Central Asia (21 | 1.2%), together accounting for 10.1% of all Cassopolis residents.
| Immigration Origin | # Population | % Population |
| Asia | 64 | 3.7% |
| Eastern Asia | 8 | 0.5% |
| Europe | 11 | 0.6% |
| Germany | 11 | 0.6% |
| India | 21 | 1.2% |
| Korea | 8 | 0.5% |
| Laos | 35 | 2.0% |
| South Central Asia | 21 | 1.2% |
| South Eastern Asia | 35 | 2.0% |
| Western Europe | 11 | 0.6% | View All 10 Rows |
Sex and Age in Cassopolis
Sex and Age in Cassopolis
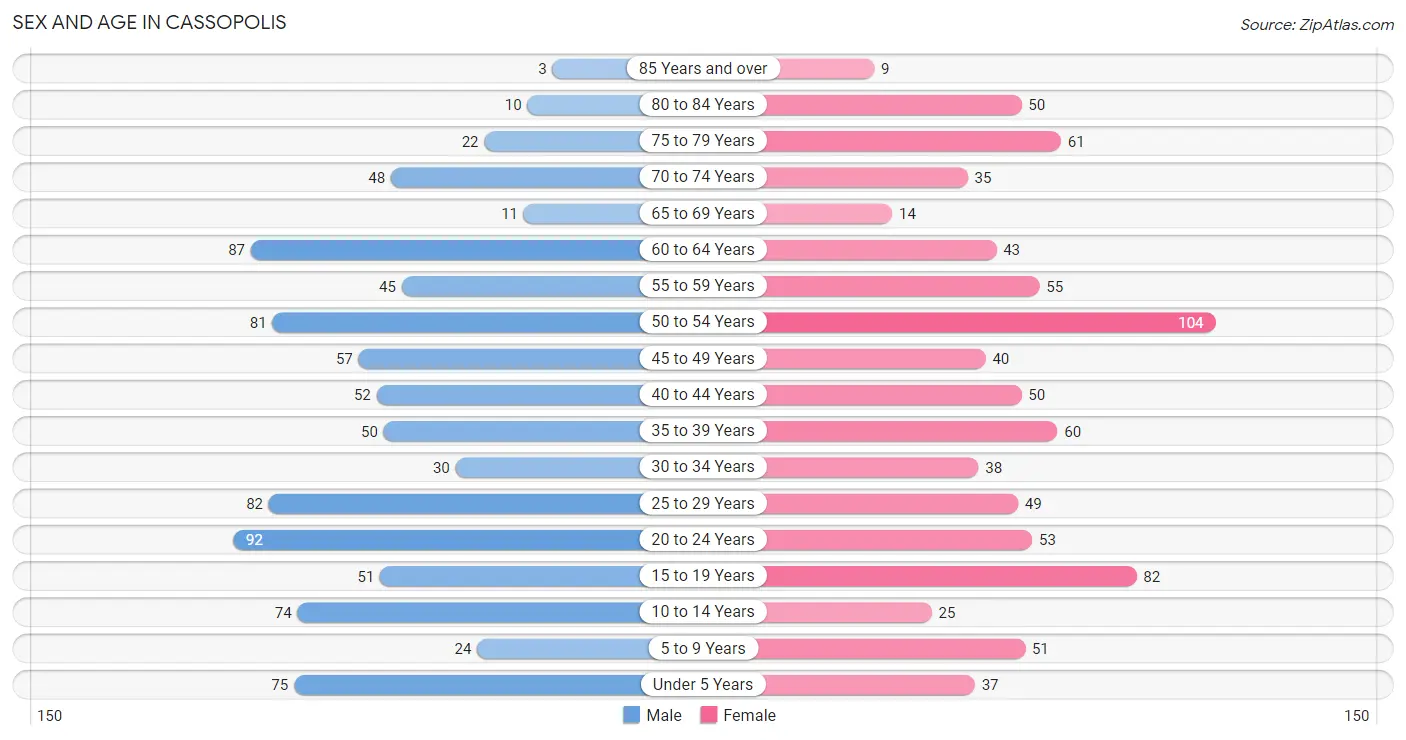
The most populous age groups in Cassopolis are 20 to 24 Years (92 | 10.3%) for men and 50 to 54 Years (104 | 12.1%) for women.
| Age Bracket | Male | Female |
| Under 5 Years | 75 (8.4%) | 37 (4.3%) |
| 5 to 9 Years | 24 (2.7%) | 51 (6.0%) |
| 10 to 14 Years | 74 (8.3%) | 25 (2.9%) |
| 15 to 19 Years | 51 (5.7%) | 82 (9.6%) |
| 20 to 24 Years | 92 (10.3%) | 53 (6.2%) |
| 25 to 29 Years | 82 (9.2%) | 49 (5.7%) |
| 30 to 34 Years | 30 (3.4%) | 38 (4.4%) |
| 35 to 39 Years | 50 (5.6%) | 60 (7.0%) |
| 40 to 44 Years | 52 (5.8%) | 50 (5.8%) |
| 45 to 49 Years | 57 (6.4%) | 40 (4.7%) |
| 50 to 54 Years | 81 (9.1%) | 104 (12.1%) |
| 55 to 59 Years | 45 (5.0%) | 55 (6.4%) |
| 60 to 64 Years | 87 (9.7%) | 43 (5.0%) |
| 65 to 69 Years | 11 (1.2%) | 14 (1.6%) |
| 70 to 74 Years | 48 (5.4%) | 35 (4.1%) |
| 75 to 79 Years | 22 (2.5%) | 61 (7.1%) |
| 80 to 84 Years | 10 (1.1%) | 50 (5.8%) |
| 85 Years and over | 3 (0.3%) | 9 (1.1%) |
| Total | 894 (100.0%) | 856 (100.0%) |
Families and Households in Cassopolis
Median Family Size in Cassopolis
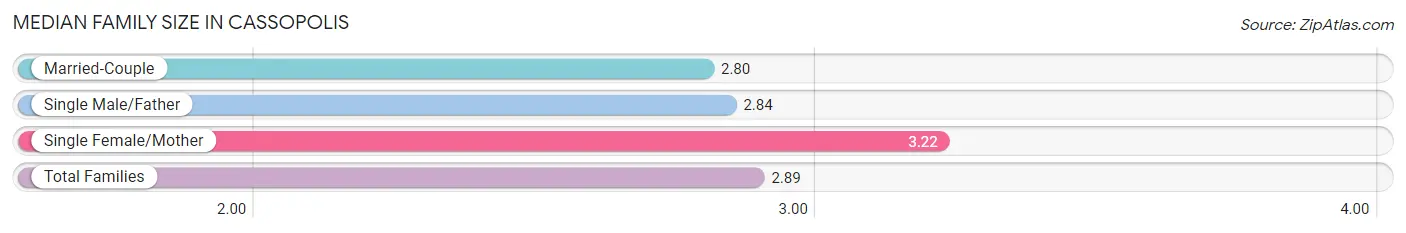
The median family size in Cassopolis is 2.89 persons per family, with single female/mother families (83 | 21.0%) accounting for the largest median family size of 3.22 persons per family. On the other hand, married-couple families (227 | 57.3%) represent the smallest median family size with 2.80 persons per family.
| Family Type | # Families | Family Size |
| Married-Couple | 227 (57.3%) | 2.80 |
| Single Male/Father | 86 (21.7%) | 2.84 |
| Single Female/Mother | 83 (21.0%) | 3.22 |
| Total Families | 396 (100.0%) | 2.89 |
Median Household Size in Cassopolis
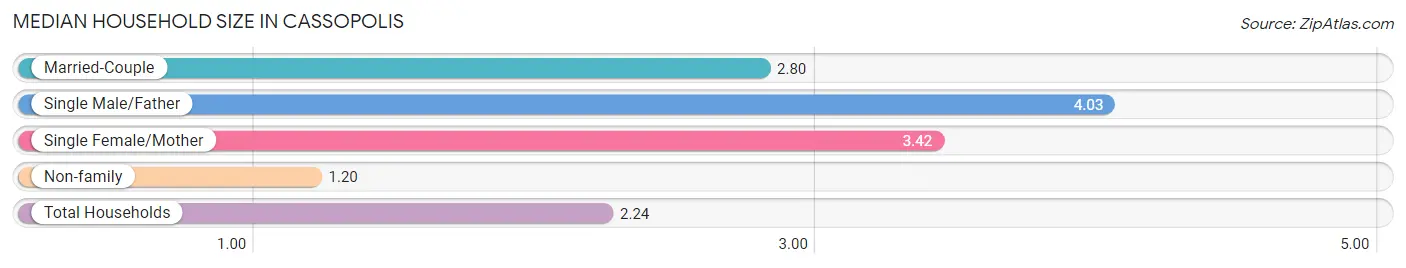
The median household size in Cassopolis is 2.24 persons per household, with single male/father households (86 | 11.3%) accounting for the largest median household size of 4.03 persons per household. non-family households (363 | 47.8%) represent the smallest median household size with 1.20 persons per household.
| Household Type | # Households | Household Size |
| Married-Couple | 227 (29.9%) | 2.80 |
| Single Male/Father | 86 (11.3%) | 4.03 |
| Single Female/Mother | 83 (10.9%) | 3.42 |
| Non-family | 363 (47.8%) | 1.20 |
| Total Households | 759 (100.0%) | 2.24 |
Household Size by Marriage Status in Cassopolis
Out of a total of 759 households in Cassopolis, 396 (52.2%) are family households, while 363 (47.8%) are nonfamily households. The most numerous type of family households are 2-person households, comprising 186, and the most common type of nonfamily households are 1-person households, comprising 305.
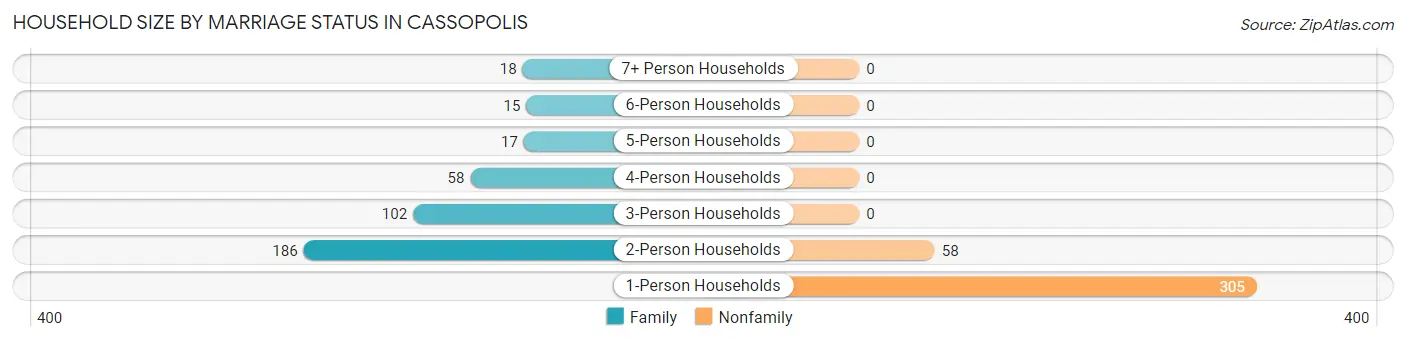
| Household Size | Family Households | Nonfamily Households |
| 1-Person Households | - | 305 (40.2%) |
| 2-Person Households | 186 (24.5%) | 58 (7.6%) |
| 3-Person Households | 102 (13.4%) | 0 (0.0%) |
| 4-Person Households | 58 (7.6%) | 0 (0.0%) |
| 5-Person Households | 17 (2.2%) | 0 (0.0%) |
| 6-Person Households | 15 (2.0%) | 0 (0.0%) |
| 7+ Person Households | 18 (2.4%) | 0 (0.0%) |
| Total | 396 (52.2%) | 363 (47.8%) |
Female Fertility in Cassopolis
Fertility by Age in Cassopolis
Average fertility rate in Cassopolis is 93.0 births per 1,000 women. Women in the age bracket of 20 to 34 years have the highest fertility rate with 207.0 births per 1,000 women. Women in the age bracket of 20 to 34 years acount for 82.9% of all women with births.
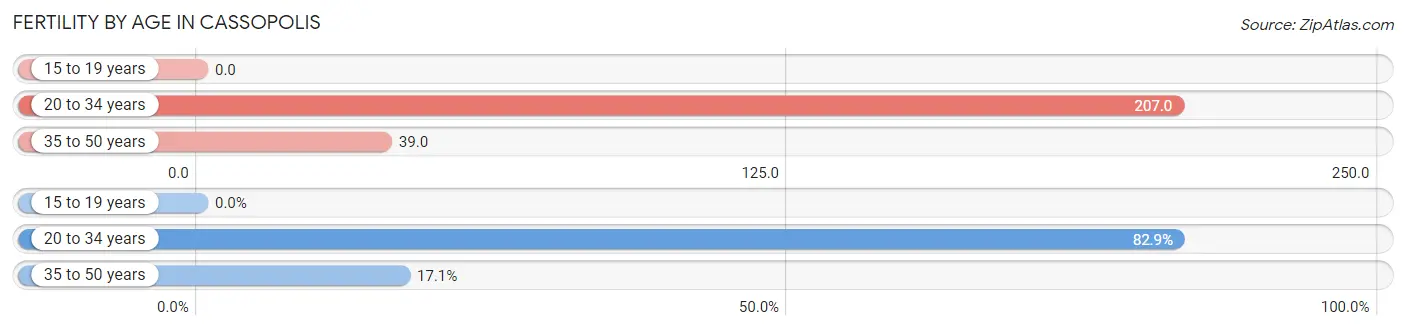
| Age Bracket | Women with Births | Births / 1,000 Women |
| 15 to 19 years | 0 (0.0%) | 0.0 |
| 20 to 34 years | 29 (82.9%) | 207.0 |
| 35 to 50 years | 6 (17.1%) | 39.0 |
| Total | 35 (100.0%) | 93.0 |
Fertility by Age by Marriage Status in Cassopolis
25.7% of women with births (35) in Cassopolis are married. The highest percentage of unmarried women with births falls into 20 to 34 years age bracket with 89.7% of them unmarried at the time of birth, while the lowest percentage of unmarried women with births belong to 35 to 50 years age bracket with 0.0% of them unmarried.
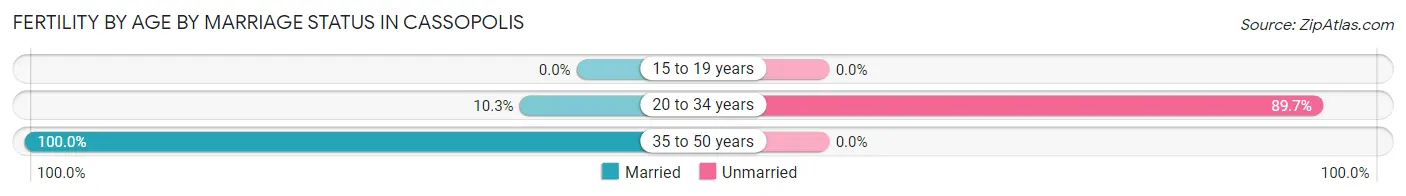
| Age Bracket | Married | Unmarried |
| 15 to 19 years | 0 (0.0%) | 0 (0.0%) |
| 20 to 34 years | 3 (10.3%) | 26 (89.7%) |
| 35 to 50 years | 6 (100.0%) | 0 (0.0%) |
| Total | 9 (25.7%) | 26 (74.3%) |
Fertility by Education in Cassopolis
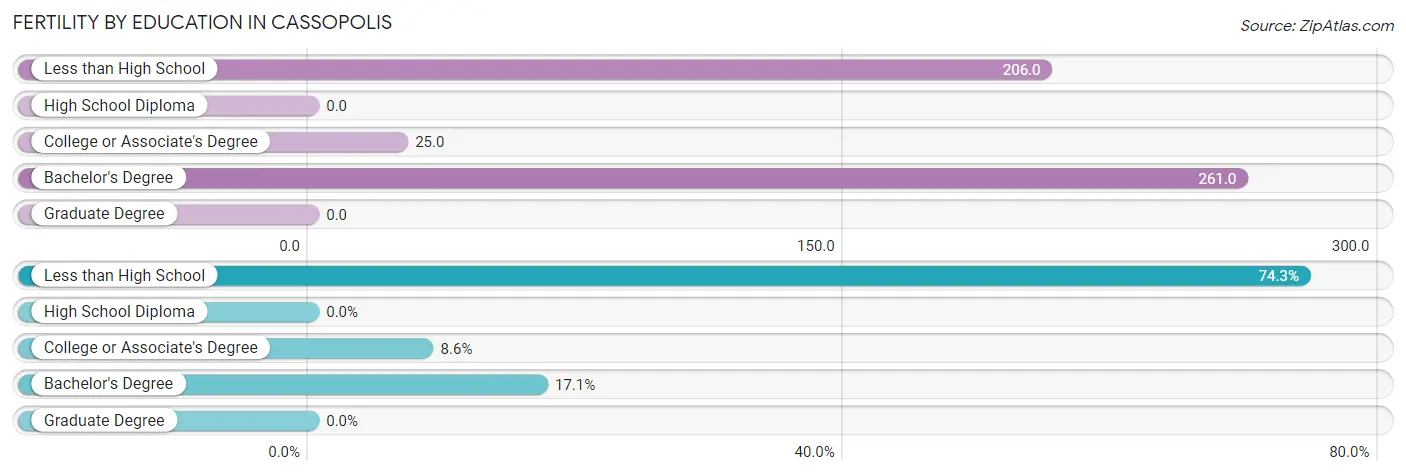
| Educational Attainment | Women with Births | Births / 1,000 Women |
| Less than High School | 26 (74.3%) | 206.0 |
| High School Diploma | 0 (0.0%) | 0.0 |
| College or Associate's Degree | 3 (8.6%) | 25.0 |
| Bachelor's Degree | 6 (17.1%) | 261.0 |
| Graduate Degree | 0 (0.0%) | 0.0 |
| Total | 35 (100.0%) | 93.0 |
Fertility by Education by Marriage Status in Cassopolis
74.3% of women with births in Cassopolis are unmarried. Women with the educational attainment of college or associate's degree are most likely to be married with 100.0% of them married at childbirth, while women with the educational attainment of less than high school are least likely to be married with 100.0% of them unmarried at childbirth.
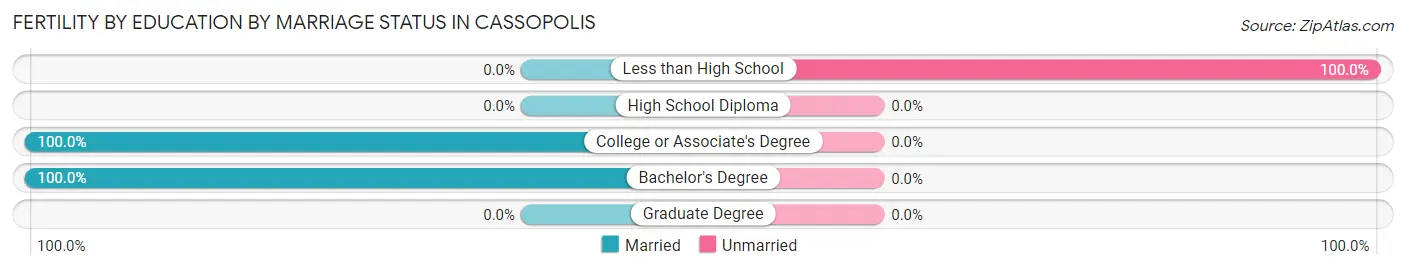
| Educational Attainment | Married | Unmarried |
| Less than High School | 0 (0.0%) | 26 (100.0%) |
| High School Diploma | 0 (0.0%) | 0 (0.0%) |
| College or Associate's Degree | 3 (100.0%) | 0 (0.0%) |
| Bachelor's Degree | 6 (100.0%) | 0 (0.0%) |
| Graduate Degree | 0 (0.0%) | 0 (0.0%) |
| Total | 9 (25.7%) | 26 (74.3%) |
Employment Characteristics in Cassopolis
Employment by Class of Employer in Cassopolis
Among the 671 employed individuals in Cassopolis, private company employees (539 | 80.3%), not-for-profit organizations (64 | 9.5%), and local government employees (23 | 3.4%) make up the most common classes of employment.

| Employer Class | # Employees | % Employees |
| Private Company Employees | 539 | 80.3% |
| Self-Employed (Incorporated) | 11 | 1.6% |
| Self-Employed (Not Incorporated) | 14 | 2.1% |
| Not-for-profit Organizations | 64 | 9.5% |
| Local Government Employees | 23 | 3.4% |
| State Government Employees | 4 | 0.6% |
| Federal Government Employees | 16 | 2.4% |
| Unpaid Family Workers | 0 | 0.0% |
| Total | 671 | 100.0% |
Employment Status by Age in Cassopolis
According to the labor force statistics for Cassopolis, out of the total population over 16 years of age (1,425), 56.9% or 811 individuals are in the labor force, with 15.4% or 125 of them unemployed. The age group with the highest labor force participation rate is 20 to 24 years, with 90.3% or 131 individuals in the labor force. Within the labor force, the 30 to 34 years age range has the highest percentage of unemployed individuals, with 46.7% or 28 of them being unemployed.
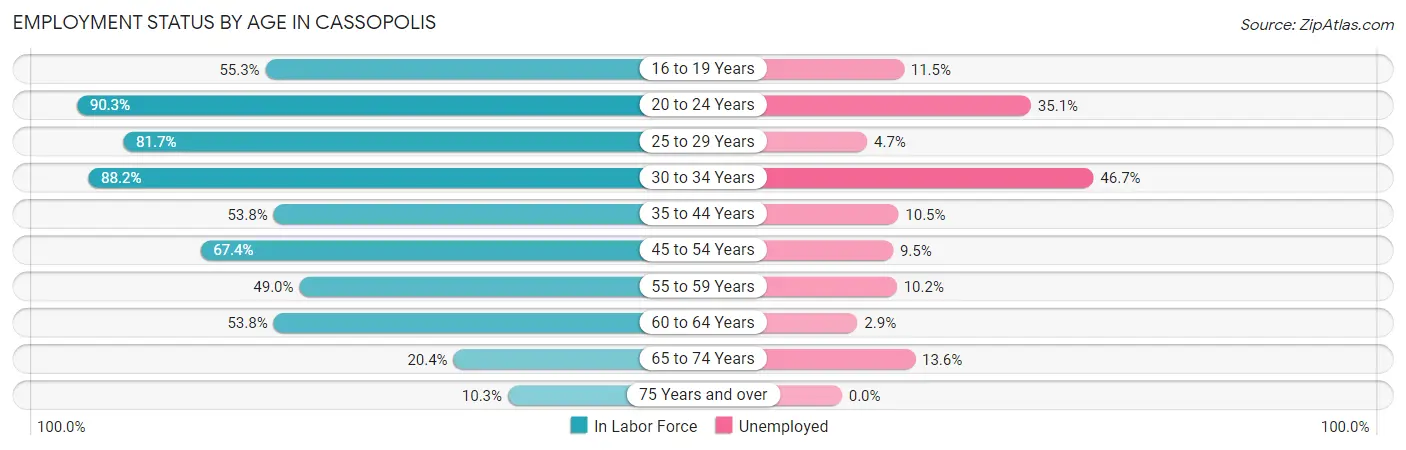
| Age Bracket | In Labor Force | Unemployed |
| 16 to 19 Years | 52 (55.3%) | 6 (11.5%) |
| 20 to 24 Years | 131 (90.3%) | 46 (35.1%) |
| 25 to 29 Years | 107 (81.7%) | 5 (4.7%) |
| 30 to 34 Years | 60 (88.2%) | 28 (46.7%) |
| 35 to 44 Years | 114 (53.8%) | 12 (10.5%) |
| 45 to 54 Years | 190 (67.4%) | 18 (9.5%) |
| 55 to 59 Years | 49 (49.0%) | 5 (10.2%) |
| 60 to 64 Years | 70 (53.8%) | 2 (2.9%) |
| 65 to 74 Years | 22 (20.4%) | 3 (13.6%) |
| 75 Years and over | 16 (10.3%) | 0 (0.0%) |
| Total | 811 (56.9%) | 125 (15.4%) |
Employment Status by Educational Attainment in Cassopolis
According to labor force statistics for Cassopolis, 63.9% of individuals (590) out of the total population between 25 and 64 years of age (923) are in the labor force, with 11.9% or 70 of them being unemployed. The group with the highest labor force participation rate are those with the educational attainment of bachelor's degree or higher, with 77.8% or 49 individuals in the labor force. Within the labor force, individuals with college / associate degree education have the highest percentage of unemployment, with 15.2% or 38 of them being unemployed.

| Educational Attainment | In Labor Force | Unemployed |
| Less than High School | 77 (68.1%) | 13 (11.7%) |
| High School Diploma | 214 (52.2%) | 34 (8.4%) |
| College / Associate Degree | 250 (74.2%) | 51 (15.2%) |
| Bachelor's Degree or higher | 49 (77.8%) | 6 (10.2%) |
| Total | 590 (63.9%) | 110 (11.9%) |
Employment Occupations by Sex in Cassopolis
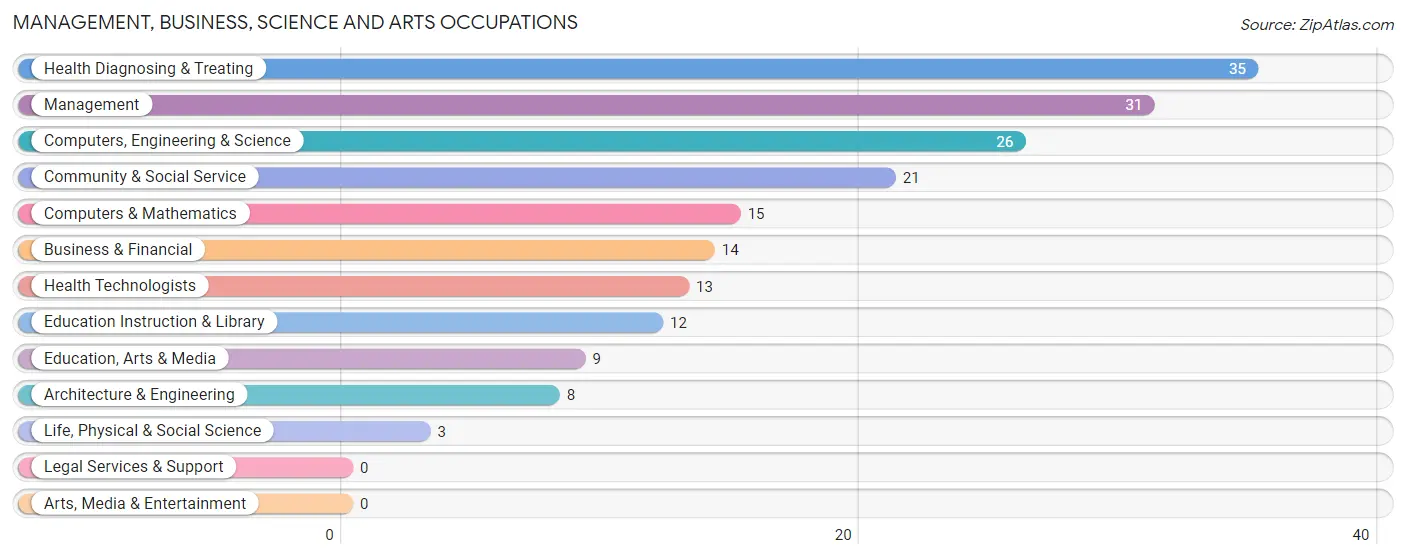
Management, Business, Science and Arts Occupations
The most common Management, Business, Science and Arts occupations in Cassopolis are Health Diagnosing & Treating (35 | 5.1%), Management (31 | 4.5%), Computers, Engineering & Science (26 | 3.8%), Community & Social Service (21 | 3.1%), and Computers & Mathematics (15 | 2.2%).
Management, Business, Science and Arts Occupations by Sex
Within the Management, Business, Science and Arts occupations in Cassopolis, the most male-oriented occupations are Business & Financial (100.0%), Computers & Mathematics (100.0%), and Life, Physical & Social Science (100.0%), while the most female-oriented occupations are Health Diagnosing & Treating (100.0%), Health Technologists (100.0%), and Education Instruction & Library (83.3%).
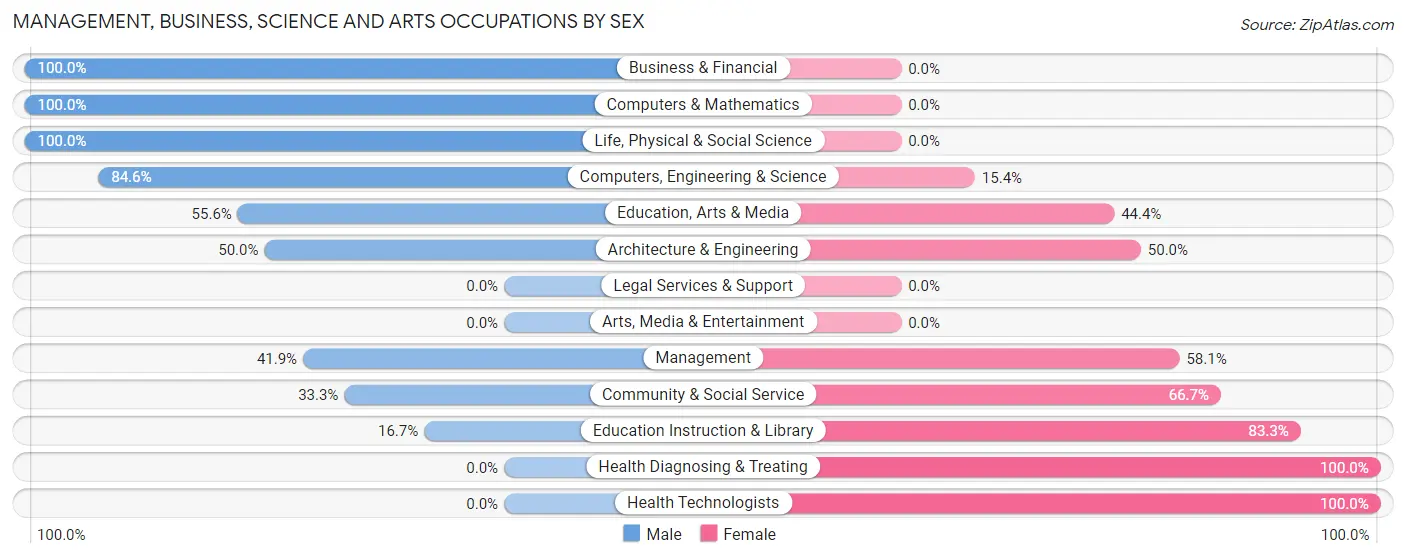
| Occupation | Male | Female |
| Management | 13 (41.9%) | 18 (58.1%) |
| Business & Financial | 14 (100.0%) | 0 (0.0%) |
| Computers, Engineering & Science | 22 (84.6%) | 4 (15.4%) |
| Computers & Mathematics | 15 (100.0%) | 0 (0.0%) |
| Architecture & Engineering | 4 (50.0%) | 4 (50.0%) |
| Life, Physical & Social Science | 3 (100.0%) | 0 (0.0%) |
| Community & Social Service | 7 (33.3%) | 14 (66.7%) |
| Education, Arts & Media | 5 (55.6%) | 4 (44.4%) |
| Legal Services & Support | 0 (0.0%) | 0 (0.0%) |
| Education Instruction & Library | 2 (16.7%) | 10 (83.3%) |
| Arts, Media & Entertainment | 0 (0.0%) | 0 (0.0%) |
| Health Diagnosing & Treating | 0 (0.0%) | 35 (100.0%) |
| Health Technologists | 0 (0.0%) | 13 (100.0%) |
| Total (Category) | 56 (44.1%) | 71 (55.9%) |
| Total (Overall) | 369 (53.8%) | 317 (46.2%) |
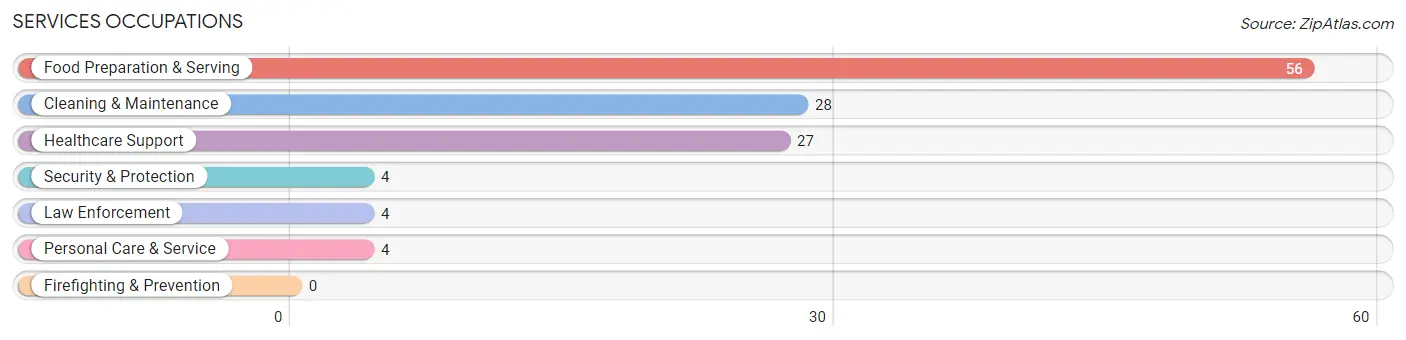
Services Occupations
The most common Services occupations in Cassopolis are Food Preparation & Serving (56 | 8.2%), Cleaning & Maintenance (28 | 4.1%), Healthcare Support (27 | 3.9%), Security & Protection (4 | 0.6%), and Law Enforcement (4 | 0.6%).
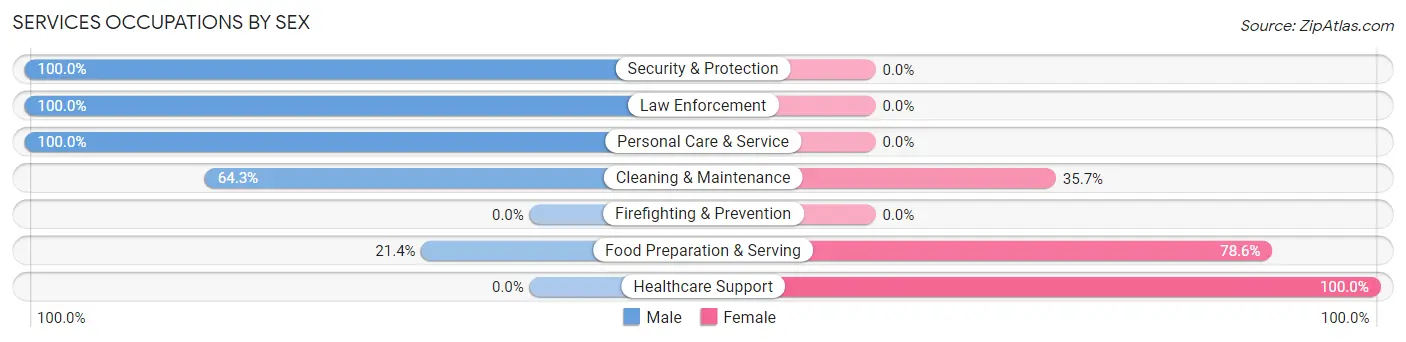
Services Occupations by Sex
Within the Services occupations in Cassopolis, the most male-oriented occupations are Security & Protection (100.0%), Law Enforcement (100.0%), and Personal Care & Service (100.0%), while the most female-oriented occupations are Healthcare Support (100.0%), Food Preparation & Serving (78.6%), and Cleaning & Maintenance (35.7%).
| Occupation | Male | Female |
| Healthcare Support | 0 (0.0%) | 27 (100.0%) |
| Security & Protection | 4 (100.0%) | 0 (0.0%) |
| Firefighting & Prevention | 0 (0.0%) | 0 (0.0%) |
| Law Enforcement | 4 (100.0%) | 0 (0.0%) |
| Food Preparation & Serving | 12 (21.4%) | 44 (78.6%) |
| Cleaning & Maintenance | 18 (64.3%) | 10 (35.7%) |
| Personal Care & Service | 4 (100.0%) | 0 (0.0%) |
| Total (Category) | 38 (31.9%) | 81 (68.1%) |
| Total (Overall) | 369 (53.8%) | 317 (46.2%) |
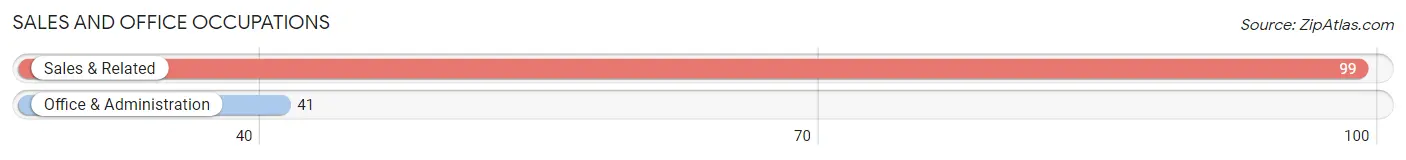
Sales and Office Occupations
The most common Sales and Office occupations in Cassopolis are Sales & Related (99 | 14.4%), and Office & Administration (41 | 6.0%).
Sales and Office Occupations by Sex

| Occupation | Male | Female |
| Sales & Related | 47 (47.5%) | 52 (52.5%) |
| Office & Administration | 7 (17.1%) | 34 (82.9%) |
| Total (Category) | 54 (38.6%) | 86 (61.4%) |
| Total (Overall) | 369 (53.8%) | 317 (46.2%) |
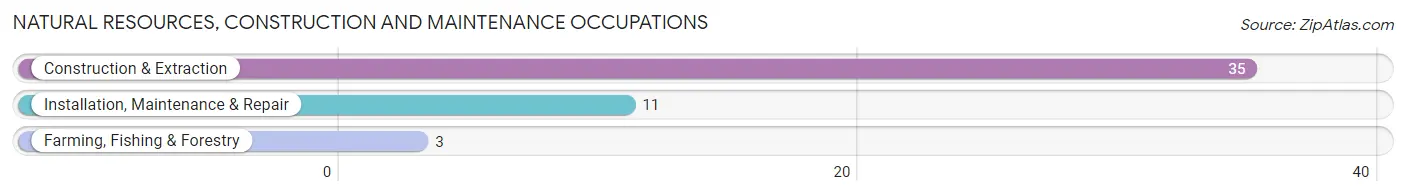
Natural Resources, Construction and Maintenance Occupations
The most common Natural Resources, Construction and Maintenance occupations in Cassopolis are Construction & Extraction (35 | 5.1%), Installation, Maintenance & Repair (11 | 1.6%), and Farming, Fishing & Forestry (3 | 0.4%).
Natural Resources, Construction and Maintenance Occupations by Sex
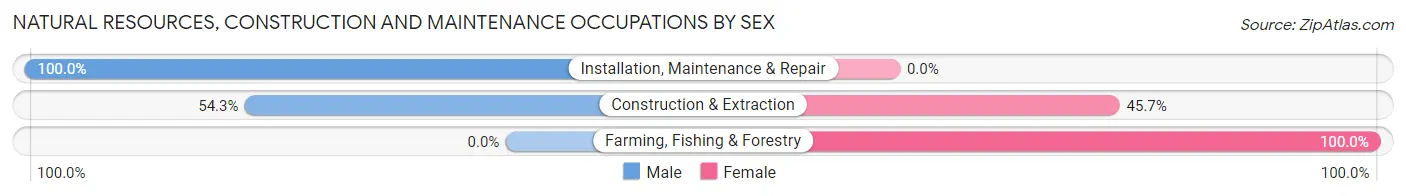
| Occupation | Male | Female |
| Farming, Fishing & Forestry | 0 (0.0%) | 3 (100.0%) |
| Construction & Extraction | 19 (54.3%) | 16 (45.7%) |
| Installation, Maintenance & Repair | 11 (100.0%) | 0 (0.0%) |
| Total (Category) | 30 (61.2%) | 19 (38.8%) |
| Total (Overall) | 369 (53.8%) | 317 (46.2%) |
Production, Transportation and Moving Occupations
The most common Production, Transportation and Moving occupations in Cassopolis are Production (129 | 18.8%), Material Moving (89 | 13.0%), and Transportation (33 | 4.8%).
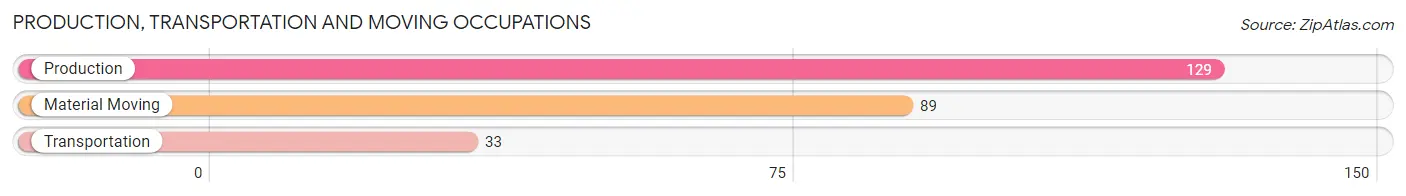
Production, Transportation and Moving Occupations by Sex
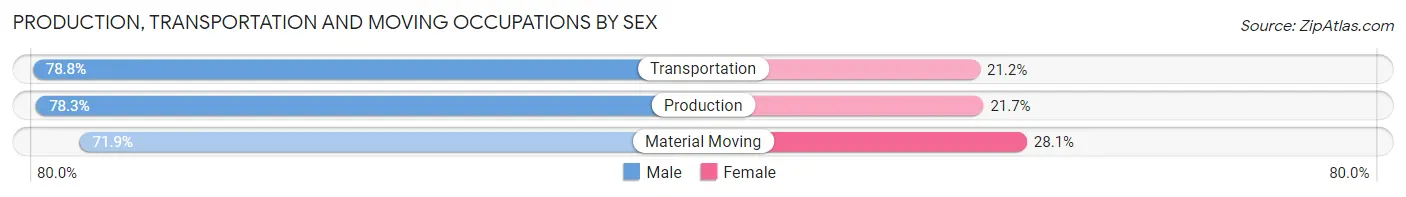
| Occupation | Male | Female |
| Production | 101 (78.3%) | 28 (21.7%) |
| Transportation | 26 (78.8%) | 7 (21.2%) |
| Material Moving | 64 (71.9%) | 25 (28.1%) |
| Total (Category) | 191 (76.1%) | 60 (23.9%) |
| Total (Overall) | 369 (53.8%) | 317 (46.2%) |
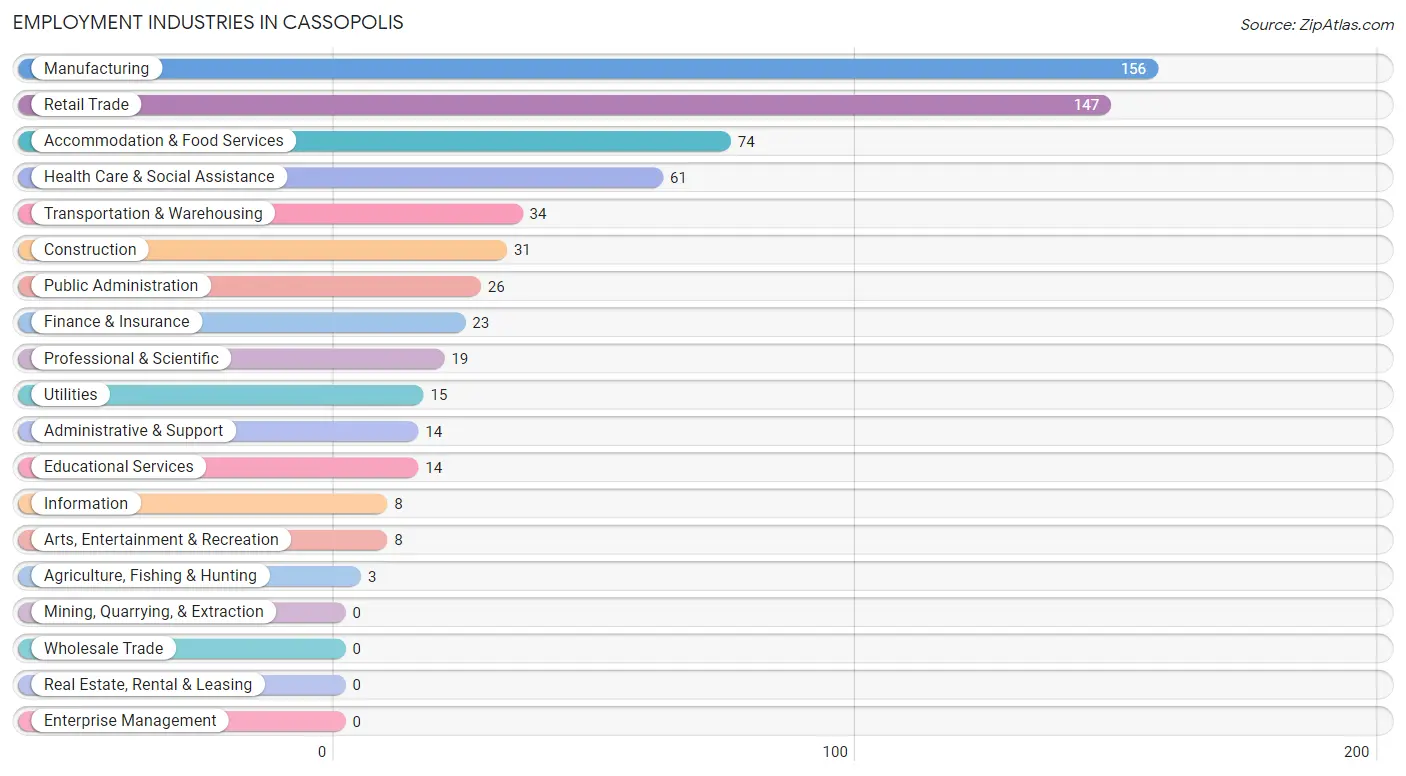
Employment Industries by Sex in Cassopolis
Employment Industries in Cassopolis
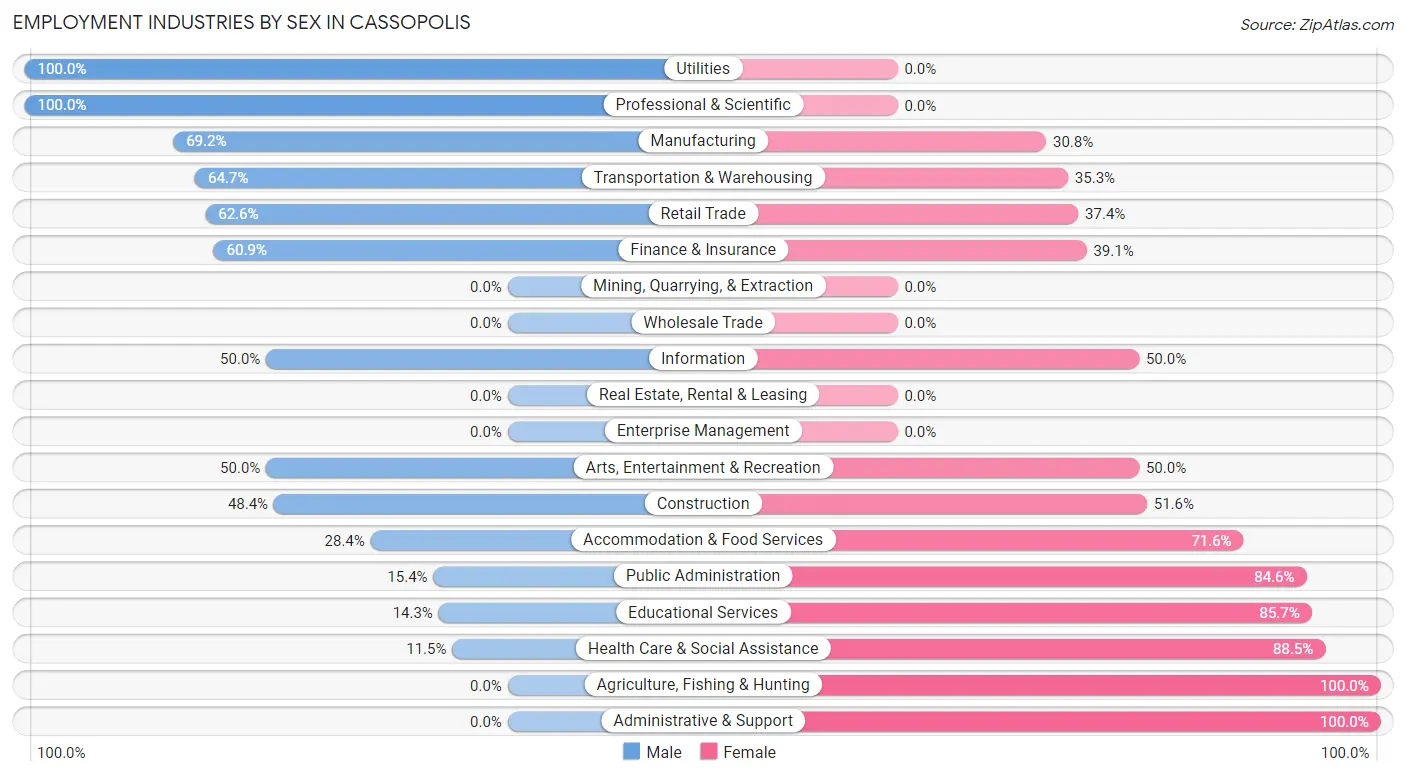
The major employment industries in Cassopolis include Manufacturing (156 | 22.7%), Retail Trade (147 | 21.4%), Accommodation & Food Services (74 | 10.8%), Health Care & Social Assistance (61 | 8.9%), and Transportation & Warehousing (34 | 5.0%).
Employment Industries by Sex in Cassopolis
The Cassopolis industries that see more men than women are Utilities (100.0%), Professional & Scientific (100.0%), and Manufacturing (69.2%), whereas the industries that tend to have a higher number of women are Agriculture, Fishing & Hunting (100.0%), Administrative & Support (100.0%), and Health Care & Social Assistance (88.5%).
| Industry | Male | Female |
| Agriculture, Fishing & Hunting | 0 (0.0%) | 3 (100.0%) |
| Mining, Quarrying, & Extraction | 0 (0.0%) | 0 (0.0%) |
| Construction | 15 (48.4%) | 16 (51.6%) |
| Manufacturing | 108 (69.2%) | 48 (30.8%) |
| Wholesale Trade | 0 (0.0%) | 0 (0.0%) |
| Retail Trade | 92 (62.6%) | 55 (37.4%) |
| Transportation & Warehousing | 22 (64.7%) | 12 (35.3%) |
| Utilities | 15 (100.0%) | 0 (0.0%) |
| Information | 4 (50.0%) | 4 (50.0%) |
| Finance & Insurance | 14 (60.9%) | 9 (39.1%) |
| Real Estate, Rental & Leasing | 0 (0.0%) | 0 (0.0%) |
| Professional & Scientific | 19 (100.0%) | 0 (0.0%) |
| Enterprise Management | 0 (0.0%) | 0 (0.0%) |
| Administrative & Support | 0 (0.0%) | 14 (100.0%) |
| Educational Services | 2 (14.3%) | 12 (85.7%) |
| Health Care & Social Assistance | 7 (11.5%) | 54 (88.5%) |
| Arts, Entertainment & Recreation | 4 (50.0%) | 4 (50.0%) |
| Accommodation & Food Services | 21 (28.4%) | 53 (71.6%) |
| Public Administration | 4 (15.4%) | 22 (84.6%) |
| Total | 369 (53.8%) | 317 (46.2%) |
Education in Cassopolis
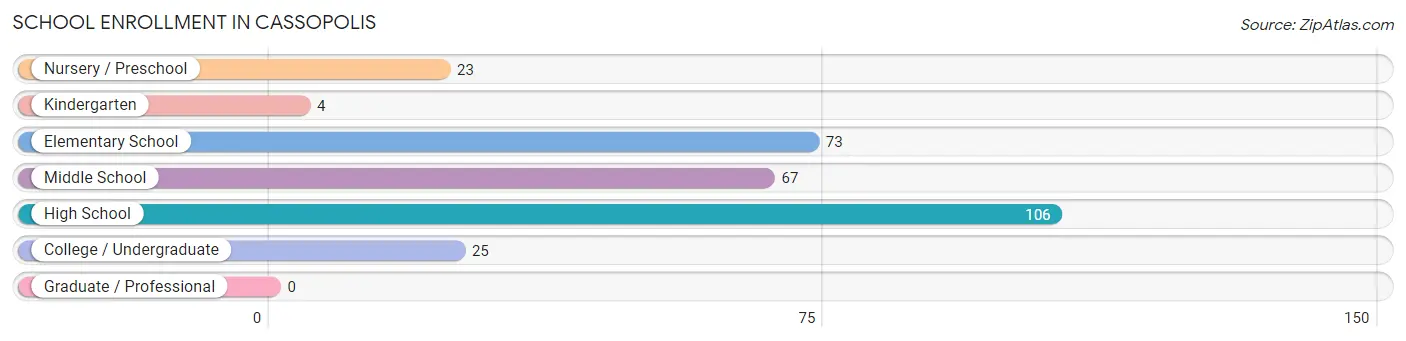
School Enrollment in Cassopolis
The most common levels of schooling among the 298 students in Cassopolis are high school (106 | 35.6%), elementary school (73 | 24.5%), and middle school (67 | 22.5%).
| School Level | # Students | % Students |
| Nursery / Preschool | 23 | 7.7% |
| Kindergarten | 4 | 1.3% |
| Elementary School | 73 | 24.5% |
| Middle School | 67 | 22.5% |
| High School | 106 | 35.6% |
| College / Undergraduate | 25 | 8.4% |
| Graduate / Professional | 0 | 0.0% |
| Total | 298 | 100.0% |
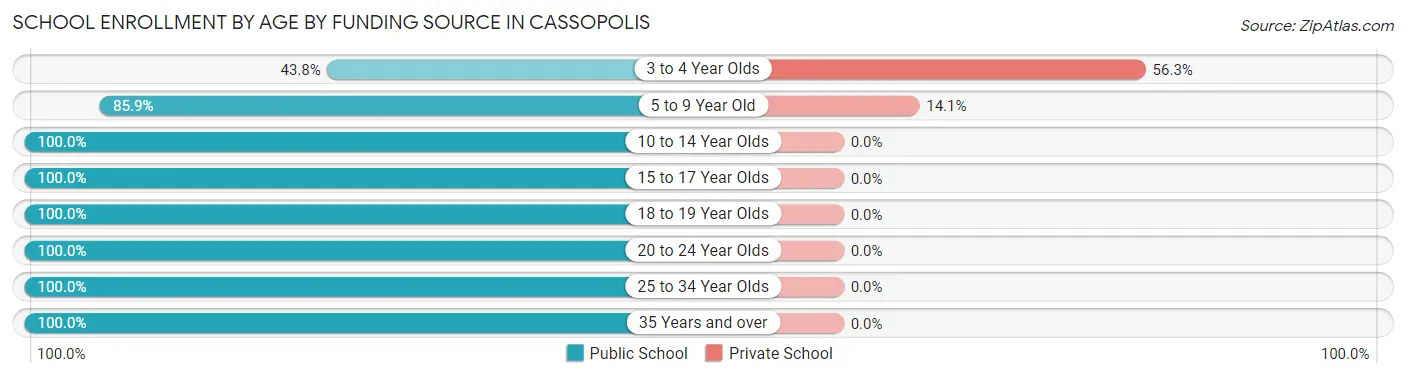
School Enrollment by Age by Funding Source in Cassopolis
Out of a total of 298 students who are enrolled in schools in Cassopolis, 19 (6.4%) attend a private institution, while the remaining 279 (93.6%) are enrolled in public schools. The age group of 3 to 4 year olds has the highest likelihood of being enrolled in private schools, with 9 (56.2% in the age bracket) enrolled. Conversely, the age group of 10 to 14 year olds has the lowest likelihood of being enrolled in a private school, with 91 (100.0% in the age bracket) attending a public institution.
| Age Bracket | Public School | Private School |
| 3 to 4 Year Olds | 7 (43.8%) | 9 (56.2%) |
| 5 to 9 Year Old | 61 (85.9%) | 10 (14.1%) |
| 10 to 14 Year Olds | 91 (100.0%) | 0 (0.0%) |
| 15 to 17 Year Olds | 84 (100.0%) | 0 (0.0%) |
| 18 to 19 Year Olds | 16 (100.0%) | 0 (0.0%) |
| 20 to 24 Year Olds | 3 (100.0%) | 0 (0.0%) |
| 25 to 34 Year Olds | 5 (100.0%) | 0 (0.0%) |
| 35 Years and over | 12 (100.0%) | 0 (0.0%) |
| Total | 279 (93.6%) | 19 (6.4%) |
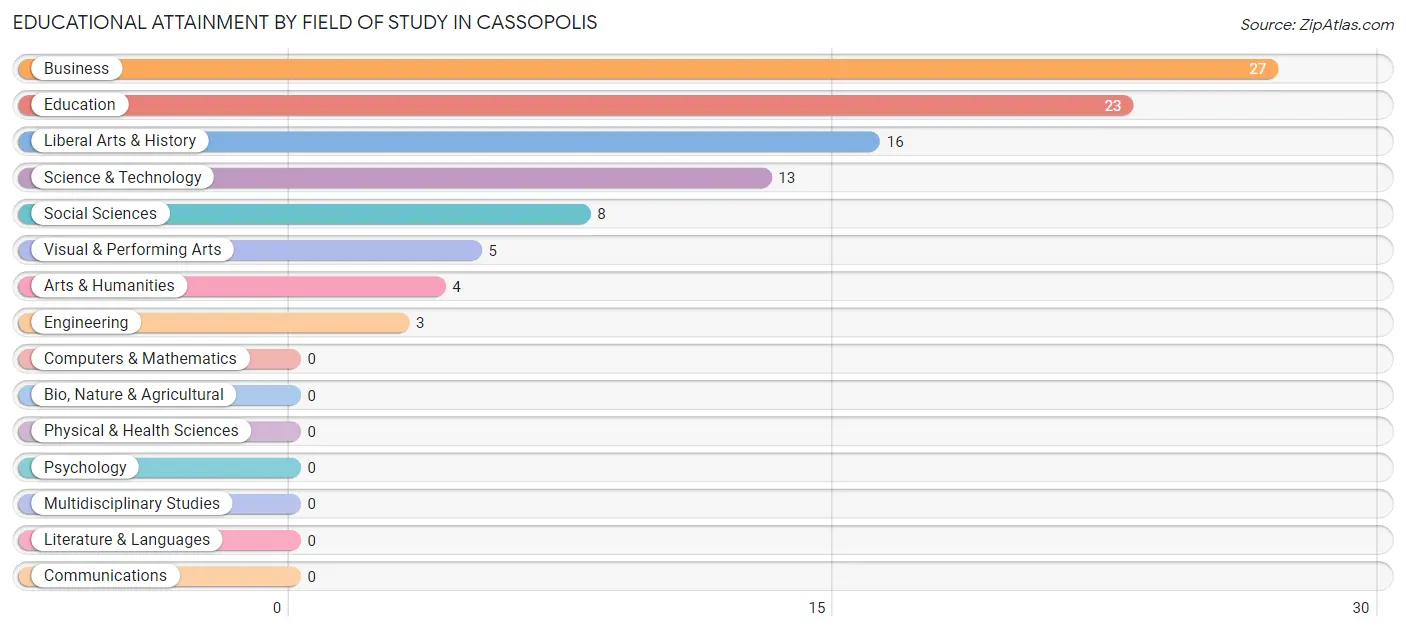
Educational Attainment by Field of Study in Cassopolis
Business (27 | 27.3%), education (23 | 23.2%), liberal arts & history (16 | 16.2%), science & technology (13 | 13.1%), and social sciences (8 | 8.1%) are the most common fields of study among 99 individuals in Cassopolis who have obtained a bachelor's degree or higher.
| Field of Study | # Graduates | % Graduates |
| Computers & Mathematics | 0 | 0.0% |
| Bio, Nature & Agricultural | 0 | 0.0% |
| Physical & Health Sciences | 0 | 0.0% |
| Psychology | 0 | 0.0% |
| Social Sciences | 8 | 8.1% |
| Engineering | 3 | 3.0% |
| Multidisciplinary Studies | 0 | 0.0% |
| Science & Technology | 13 | 13.1% |
| Business | 27 | 27.3% |
| Education | 23 | 23.2% |
| Literature & Languages | 0 | 0.0% |
| Liberal Arts & History | 16 | 16.2% |
| Visual & Performing Arts | 5 | 5.1% |
| Communications | 0 | 0.0% |
| Arts & Humanities | 4 | 4.0% |
| Total | 99 | 100.0% |
Transportation & Commute in Cassopolis
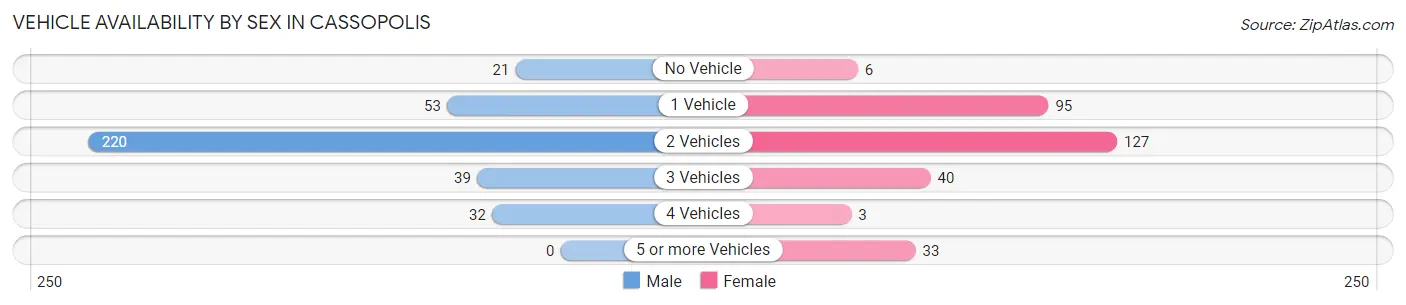
Vehicle Availability by Sex in Cassopolis
The most prevalent vehicle ownership categories in Cassopolis are males with 2 vehicles (220, accounting for 60.3%) and females with 2 vehicles (127, making up 72.4%).
| Vehicles Available | Male | Female |
| No Vehicle | 21 (5.8%) | 6 (2.0%) |
| 1 Vehicle | 53 (14.5%) | 95 (31.2%) |
| 2 Vehicles | 220 (60.3%) | 127 (41.8%) |
| 3 Vehicles | 39 (10.7%) | 40 (13.2%) |
| 4 Vehicles | 32 (8.8%) | 3 (1.0%) |
| 5 or more Vehicles | 0 (0.0%) | 33 (10.9%) |
| Total | 365 (100.0%) | 304 (100.0%) |
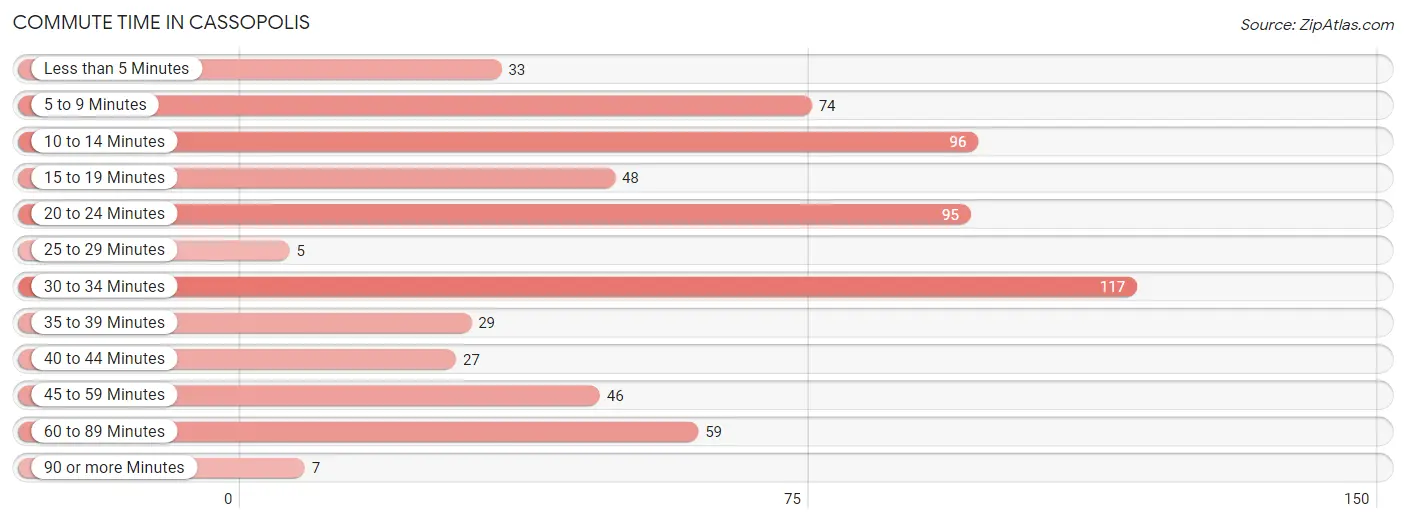
Commute Time in Cassopolis
The most frequently occuring commute durations in Cassopolis are 30 to 34 minutes (117 commuters, 18.4%), 10 to 14 minutes (96 commuters, 15.1%), and 20 to 24 minutes (95 commuters, 14.9%).
| Commute Time | # Commuters | % Commuters |
| Less than 5 Minutes | 33 | 5.2% |
| 5 to 9 Minutes | 74 | 11.6% |
| 10 to 14 Minutes | 96 | 15.1% |
| 15 to 19 Minutes | 48 | 7.5% |
| 20 to 24 Minutes | 95 | 14.9% |
| 25 to 29 Minutes | 5 | 0.8% |
| 30 to 34 Minutes | 117 | 18.4% |
| 35 to 39 Minutes | 29 | 4.6% |
| 40 to 44 Minutes | 27 | 4.3% |
| 45 to 59 Minutes | 46 | 7.2% |
| 60 to 89 Minutes | 59 | 9.3% |
| 90 or more Minutes | 7 | 1.1% |
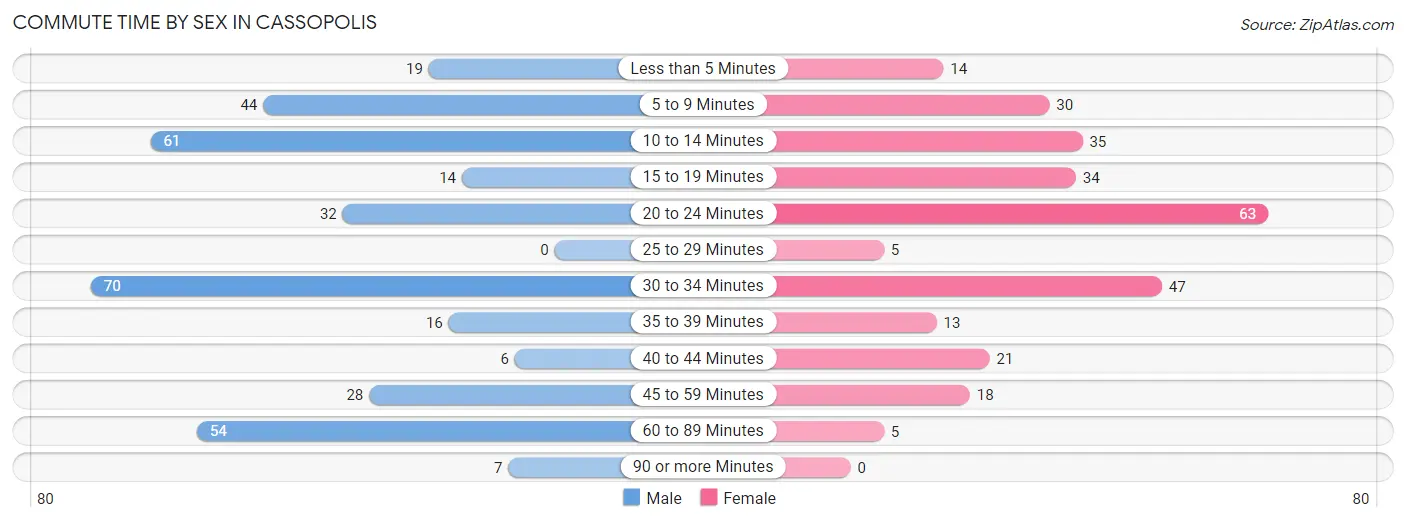
Commute Time by Sex in Cassopolis
The most common commute times in Cassopolis are 30 to 34 minutes (70 commuters, 19.9%) for males and 20 to 24 minutes (63 commuters, 22.1%) for females.
| Commute Time | Male | Female |
| Less than 5 Minutes | 19 (5.4%) | 14 (4.9%) |
| 5 to 9 Minutes | 44 (12.5%) | 30 (10.5%) |
| 10 to 14 Minutes | 61 (17.4%) | 35 (12.3%) |
| 15 to 19 Minutes | 14 (4.0%) | 34 (11.9%) |
| 20 to 24 Minutes | 32 (9.1%) | 63 (22.1%) |
| 25 to 29 Minutes | 0 (0.0%) | 5 (1.8%) |
| 30 to 34 Minutes | 70 (19.9%) | 47 (16.5%) |
| 35 to 39 Minutes | 16 (4.6%) | 13 (4.6%) |
| 40 to 44 Minutes | 6 (1.7%) | 21 (7.4%) |
| 45 to 59 Minutes | 28 (8.0%) | 18 (6.3%) |
| 60 to 89 Minutes | 54 (15.4%) | 5 (1.8%) |
| 90 or more Minutes | 7 (2.0%) | 0 (0.0%) |
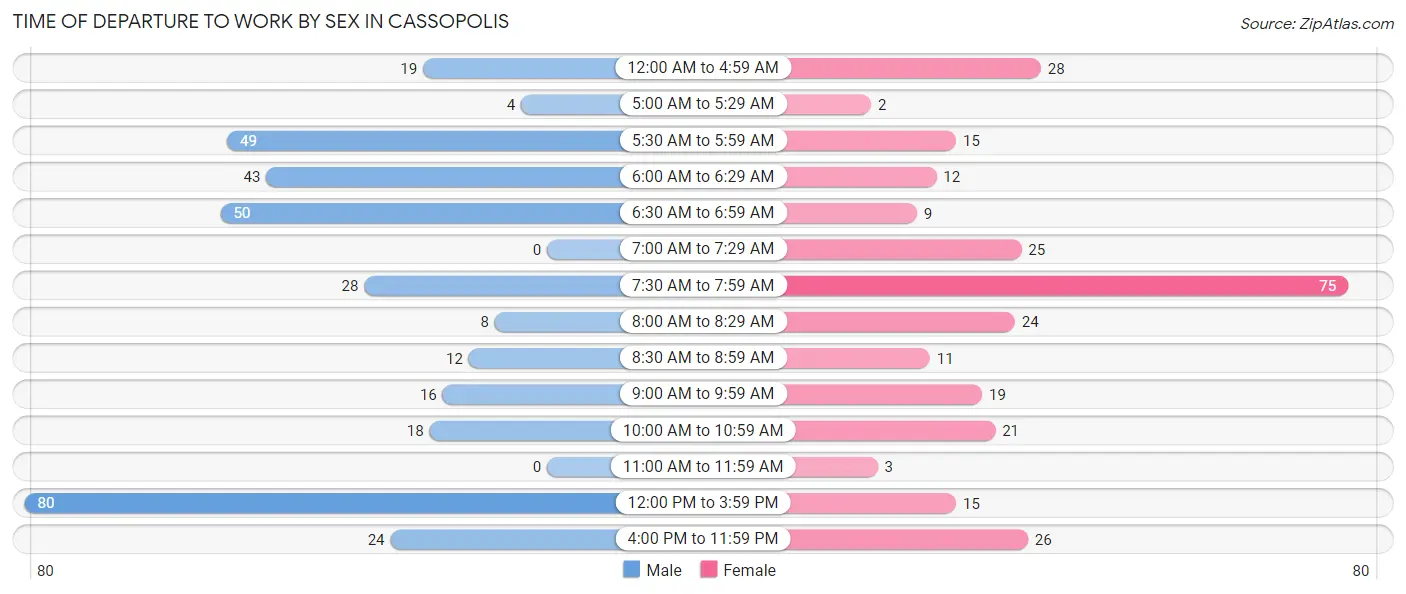
Time of Departure to Work by Sex in Cassopolis
The most frequent times of departure to work in Cassopolis are 12:00 PM to 3:59 PM (80, 22.8%) for males and 7:30 AM to 7:59 AM (75, 26.3%) for females.
| Time of Departure | Male | Female |
| 12:00 AM to 4:59 AM | 19 (5.4%) | 28 (9.8%) |
| 5:00 AM to 5:29 AM | 4 (1.1%) | 2 (0.7%) |
| 5:30 AM to 5:59 AM | 49 (14.0%) | 15 (5.3%) |
| 6:00 AM to 6:29 AM | 43 (12.2%) | 12 (4.2%) |
| 6:30 AM to 6:59 AM | 50 (14.2%) | 9 (3.2%) |
| 7:00 AM to 7:29 AM | 0 (0.0%) | 25 (8.8%) |
| 7:30 AM to 7:59 AM | 28 (8.0%) | 75 (26.3%) |
| 8:00 AM to 8:29 AM | 8 (2.3%) | 24 (8.4%) |
| 8:30 AM to 8:59 AM | 12 (3.4%) | 11 (3.9%) |
| 9:00 AM to 9:59 AM | 16 (4.6%) | 19 (6.7%) |
| 10:00 AM to 10:59 AM | 18 (5.1%) | 21 (7.4%) |
| 11:00 AM to 11:59 AM | 0 (0.0%) | 3 (1.1%) |
| 12:00 PM to 3:59 PM | 80 (22.8%) | 15 (5.3%) |
| 4:00 PM to 11:59 PM | 24 (6.8%) | 26 (9.1%) |
| Total | 351 (100.0%) | 285 (100.0%) |
Housing Occupancy in Cassopolis
Occupancy by Ownership in Cassopolis
Of the total 759 dwellings in Cassopolis, owner-occupied units account for 386 (50.9%), while renter-occupied units make up 373 (49.1%).
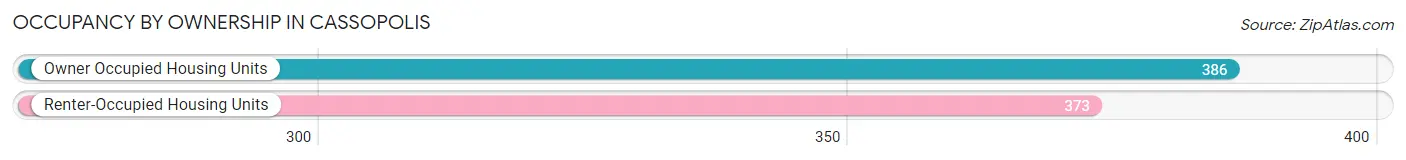
| Occupancy | # Housing Units | % Housing Units |
| Owner Occupied Housing Units | 386 | 50.9% |
| Renter-Occupied Housing Units | 373 | 49.1% |
| Total Occupied Housing Units | 759 | 100.0% |
Occupancy by Household Size in Cassopolis
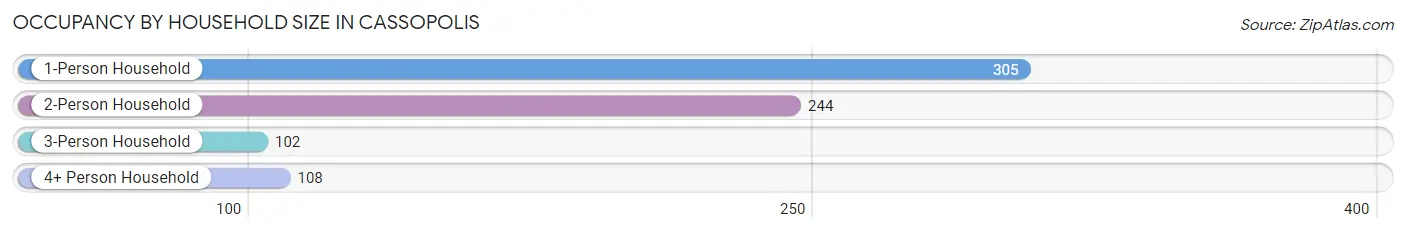
| Household Size | # Housing Units | % Housing Units |
| 1-Person Household | 305 | 40.2% |
| 2-Person Household | 244 | 32.2% |
| 3-Person Household | 102 | 13.4% |
| 4+ Person Household | 108 | 14.2% |
| Total Housing Units | 759 | 100.0% |
Occupancy by Ownership by Household Size in Cassopolis
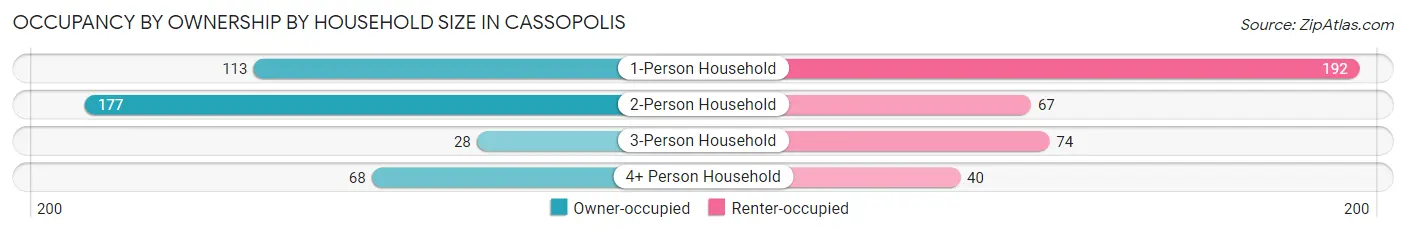
| Household Size | Owner-occupied | Renter-occupied |
| 1-Person Household | 113 (37.0%) | 192 (62.9%) |
| 2-Person Household | 177 (72.5%) | 67 (27.5%) |
| 3-Person Household | 28 (27.5%) | 74 (72.6%) |
| 4+ Person Household | 68 (63.0%) | 40 (37.0%) |
| Total Housing Units | 386 (50.9%) | 373 (49.1%) |
Occupancy by Educational Attainment in Cassopolis
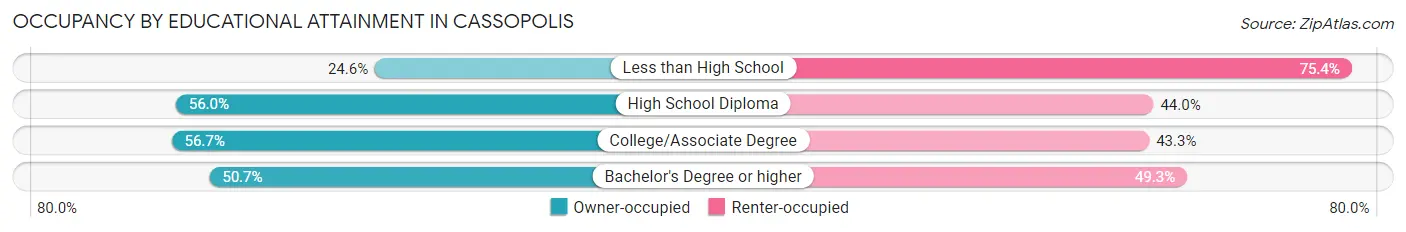
| Household Size | Owner-occupied | Renter-occupied |
| Less than High School | 29 (24.6%) | 89 (75.4%) |
| High School Diploma | 177 (56.0%) | 139 (44.0%) |
| College/Associate Degree | 144 (56.7%) | 110 (43.3%) |
| Bachelor's Degree or higher | 36 (50.7%) | 35 (49.3%) |
Occupancy by Age of Householder in Cassopolis
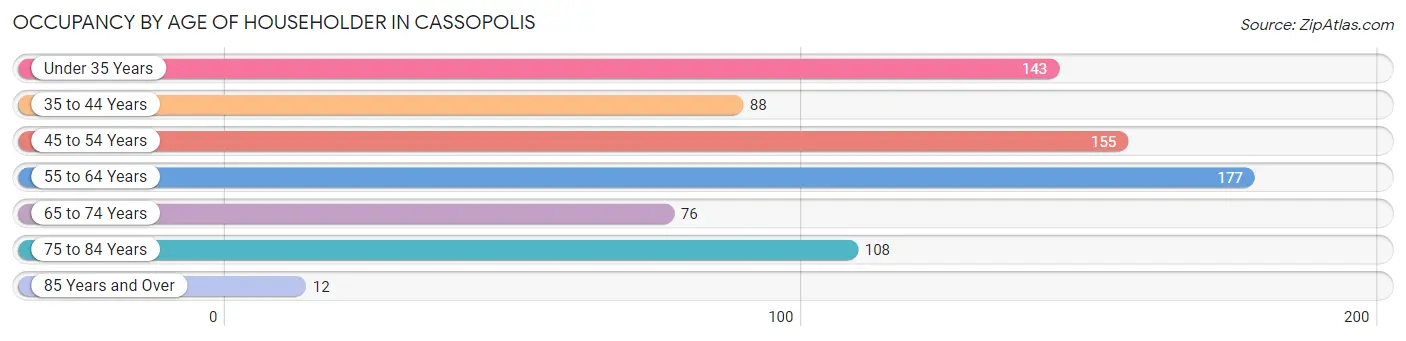
| Age Bracket | # Households | % Households |
| Under 35 Years | 143 | 18.8% |
| 35 to 44 Years | 88 | 11.6% |
| 45 to 54 Years | 155 | 20.4% |
| 55 to 64 Years | 177 | 23.3% |
| 65 to 74 Years | 76 | 10.0% |
| 75 to 84 Years | 108 | 14.2% |
| 85 Years and Over | 12 | 1.6% |
| Total | 759 | 100.0% |
Housing Finances in Cassopolis
Median Income by Occupancy in Cassopolis
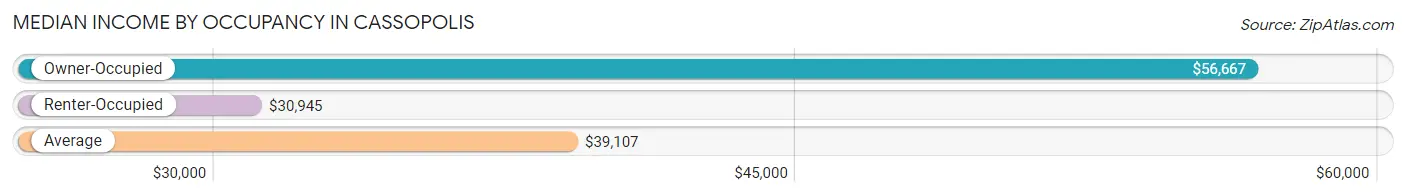
| Occupancy Type | # Households | Median Income |
| Owner-Occupied | 386 (50.9%) | $56,667 |
| Renter-Occupied | 373 (49.1%) | $30,945 |
| Average | 759 (100.0%) | $39,107 |
Occupancy by Householder Income Bracket in Cassopolis
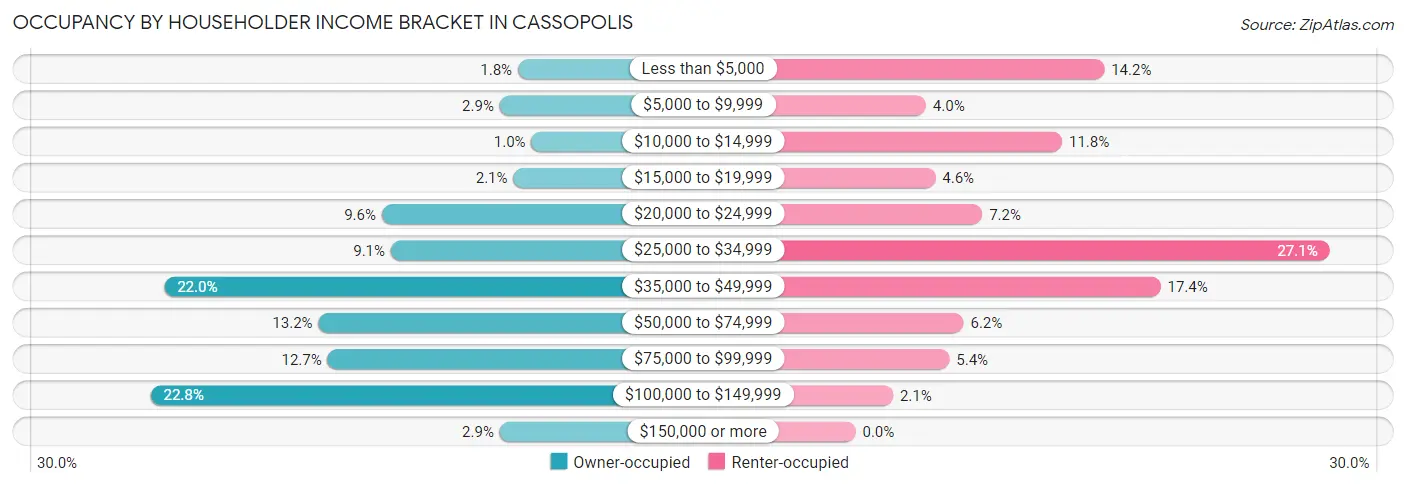
| Income Bracket | Owner-occupied | Renter-occupied |
| Less than $5,000 | 7 (1.8%) | 53 (14.2%) |
| $5,000 to $9,999 | 11 (2.9%) | 15 (4.0%) |
| $10,000 to $14,999 | 4 (1.0%) | 44 (11.8%) |
| $15,000 to $19,999 | 8 (2.1%) | 17 (4.6%) |
| $20,000 to $24,999 | 37 (9.6%) | 27 (7.2%) |
| $25,000 to $34,999 | 35 (9.1%) | 101 (27.1%) |
| $35,000 to $49,999 | 85 (22.0%) | 65 (17.4%) |
| $50,000 to $74,999 | 51 (13.2%) | 23 (6.2%) |
| $75,000 to $99,999 | 49 (12.7%) | 20 (5.4%) |
| $100,000 to $149,999 | 88 (22.8%) | 8 (2.1%) |
| $150,000 or more | 11 (2.9%) | 0 (0.0%) |
| Total | 386 (100.0%) | 373 (100.0%) |
Monthly Housing Cost Tiers in Cassopolis
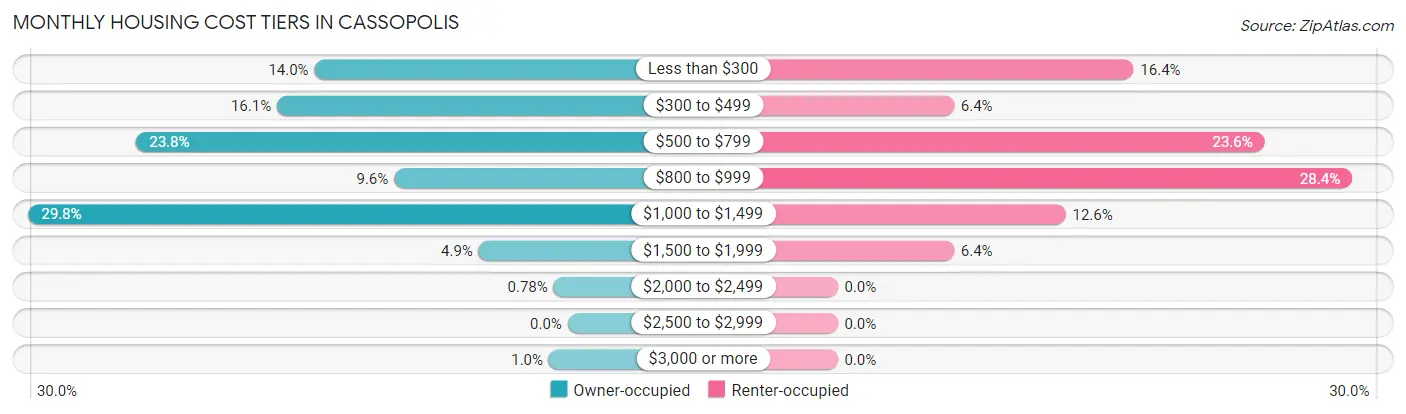
| Monthly Cost | Owner-occupied | Renter-occupied |
| Less than $300 | 54 (14.0%) | 61 (16.4%) |
| $300 to $499 | 62 (16.1%) | 24 (6.4%) |
| $500 to $799 | 92 (23.8%) | 88 (23.6%) |
| $800 to $999 | 37 (9.6%) | 106 (28.4%) |
| $1,000 to $1,499 | 115 (29.8%) | 47 (12.6%) |
| $1,500 to $1,999 | 19 (4.9%) | 24 (6.4%) |
| $2,000 to $2,499 | 3 (0.8%) | 0 (0.0%) |
| $2,500 to $2,999 | 0 (0.0%) | 0 (0.0%) |
| $3,000 or more | 4 (1.0%) | 0 (0.0%) |
| Total | 386 (100.0%) | 373 (100.0%) |
Physical Housing Characteristics in Cassopolis
Housing Structures in Cassopolis
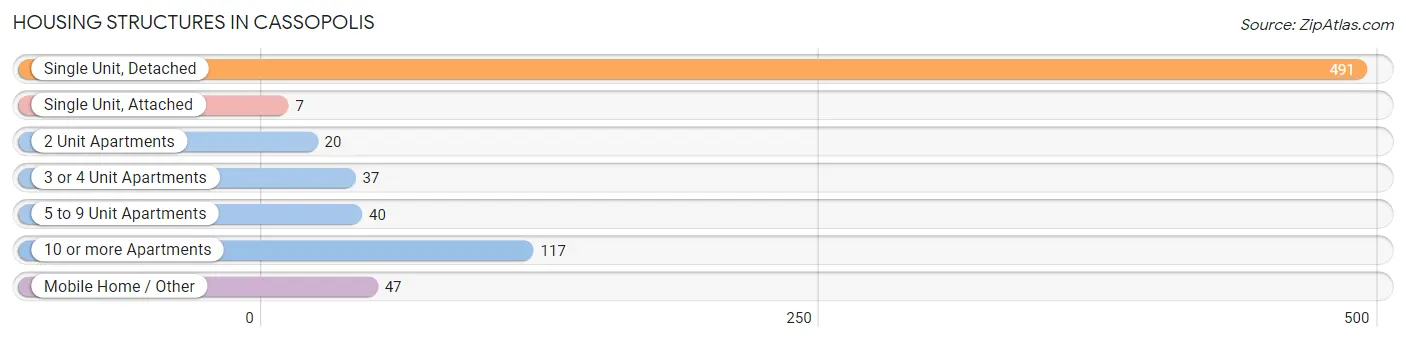
| Structure Type | # Housing Units | % Housing Units |
| Single Unit, Detached | 491 | 64.7% |
| Single Unit, Attached | 7 | 0.9% |
| 2 Unit Apartments | 20 | 2.6% |
| 3 or 4 Unit Apartments | 37 | 4.9% |
| 5 to 9 Unit Apartments | 40 | 5.3% |
| 10 or more Apartments | 117 | 15.4% |
| Mobile Home / Other | 47 | 6.2% |
| Total | 759 | 100.0% |
Housing Structures by Occupancy in Cassopolis
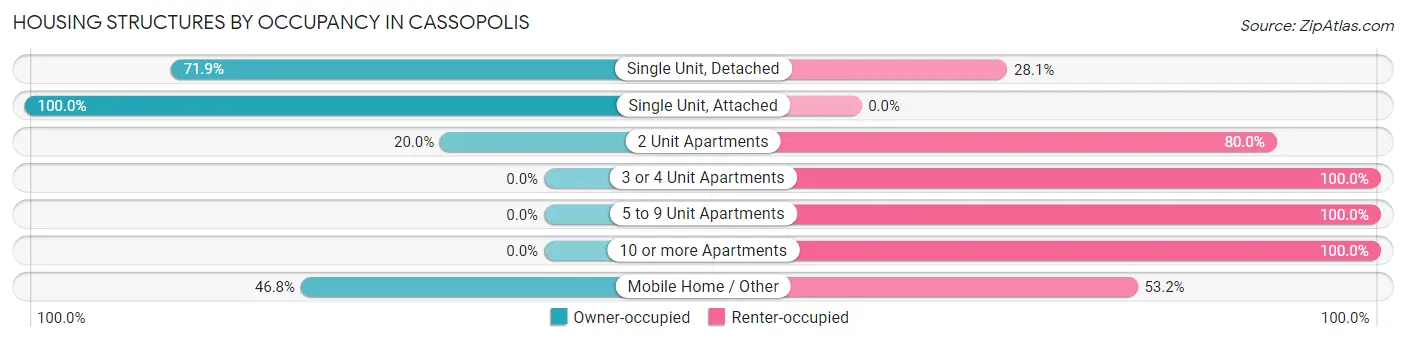
| Structure Type | Owner-occupied | Renter-occupied |
| Single Unit, Detached | 353 (71.9%) | 138 (28.1%) |
| Single Unit, Attached | 7 (100.0%) | 0 (0.0%) |
| 2 Unit Apartments | 4 (20.0%) | 16 (80.0%) |
| 3 or 4 Unit Apartments | 0 (0.0%) | 37 (100.0%) |
| 5 to 9 Unit Apartments | 0 (0.0%) | 40 (100.0%) |
| 10 or more Apartments | 0 (0.0%) | 117 (100.0%) |
| Mobile Home / Other | 22 (46.8%) | 25 (53.2%) |
| Total | 386 (50.9%) | 373 (49.1%) |
Housing Structures by Number of Rooms in Cassopolis
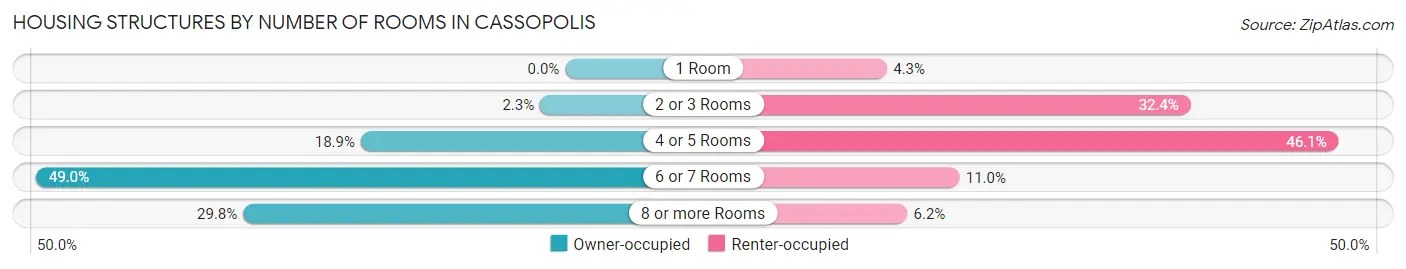
| Number of Rooms | Owner-occupied | Renter-occupied |
| 1 Room | 0 (0.0%) | 16 (4.3%) |
| 2 or 3 Rooms | 9 (2.3%) | 121 (32.4%) |
| 4 or 5 Rooms | 73 (18.9%) | 172 (46.1%) |
| 6 or 7 Rooms | 189 (49.0%) | 41 (11.0%) |
| 8 or more Rooms | 115 (29.8%) | 23 (6.2%) |
| Total | 386 (100.0%) | 373 (100.0%) |
Housing Structure by Heating Type in Cassopolis
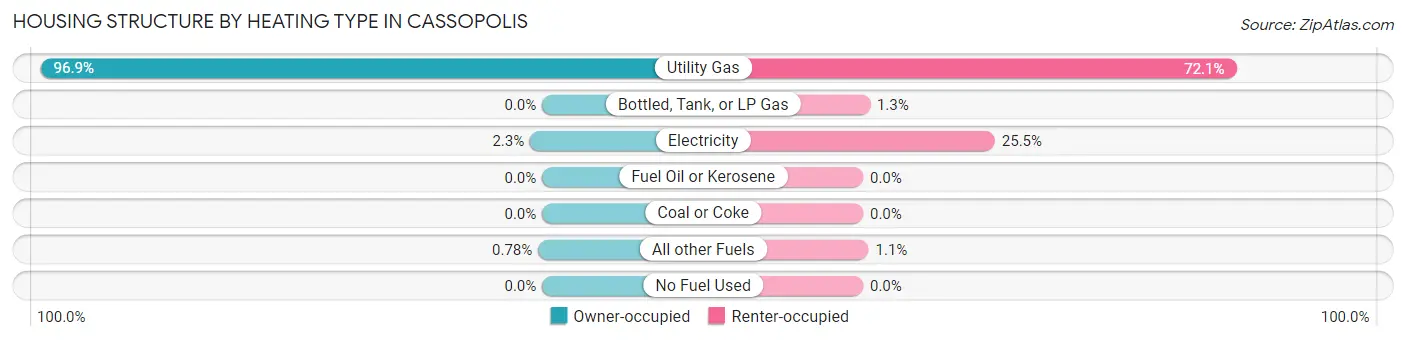
| Heating Type | Owner-occupied | Renter-occupied |
| Utility Gas | 374 (96.9%) | 269 (72.1%) |
| Bottled, Tank, or LP Gas | 0 (0.0%) | 5 (1.3%) |
| Electricity | 9 (2.3%) | 95 (25.5%) |
| Fuel Oil or Kerosene | 0 (0.0%) | 0 (0.0%) |
| Coal or Coke | 0 (0.0%) | 0 (0.0%) |
| All other Fuels | 3 (0.8%) | 4 (1.1%) |
| No Fuel Used | 0 (0.0%) | 0 (0.0%) |
| Total | 386 (100.0%) | 373 (100.0%) |
Household Vehicle Usage in Cassopolis
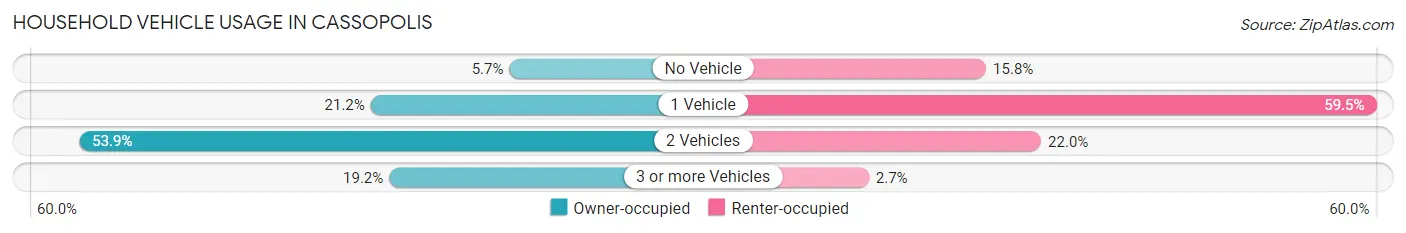
| Vehicles per Household | Owner-occupied | Renter-occupied |
| No Vehicle | 22 (5.7%) | 59 (15.8%) |
| 1 Vehicle | 82 (21.2%) | 222 (59.5%) |
| 2 Vehicles | 208 (53.9%) | 82 (22.0%) |
| 3 or more Vehicles | 74 (19.2%) | 10 (2.7%) |
| Total | 386 (100.0%) | 373 (100.0%) |
Real Estate & Mortgages in Cassopolis
Real Estate and Mortgage Overview in Cassopolis
| Characteristic | Without Mortgage | With Mortgage |
| Housing Units | 142 | 244 |
| Median Property Value | $62,500 | $108,000 |
| Median Household Income | $31,667 | $5 |
| Monthly Housing Costs | $417 | $0 |
| Real Estate Taxes | $1,025 | $25 |
Property Value by Mortgage Status in Cassopolis
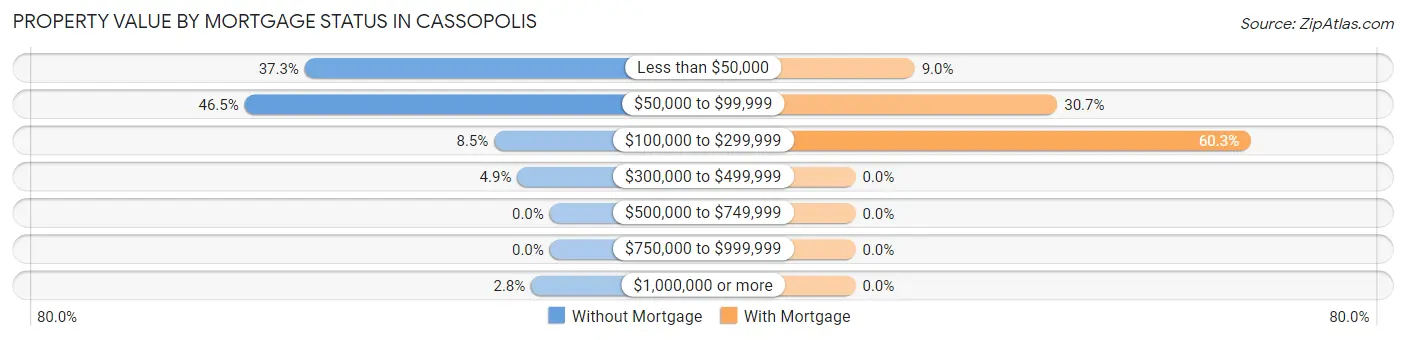
| Property Value | Without Mortgage | With Mortgage |
| Less than $50,000 | 53 (37.3%) | 22 (9.0%) |
| $50,000 to $99,999 | 66 (46.5%) | 75 (30.7%) |
| $100,000 to $299,999 | 12 (8.5%) | 147 (60.3%) |
| $300,000 to $499,999 | 7 (4.9%) | 0 (0.0%) |
| $500,000 to $749,999 | 0 (0.0%) | 0 (0.0%) |
| $750,000 to $999,999 | 0 (0.0%) | 0 (0.0%) |
| $1,000,000 or more | 4 (2.8%) | 0 (0.0%) |
| Total | 142 (100.0%) | 244 (100.0%) |
Household Income by Mortgage Status in Cassopolis
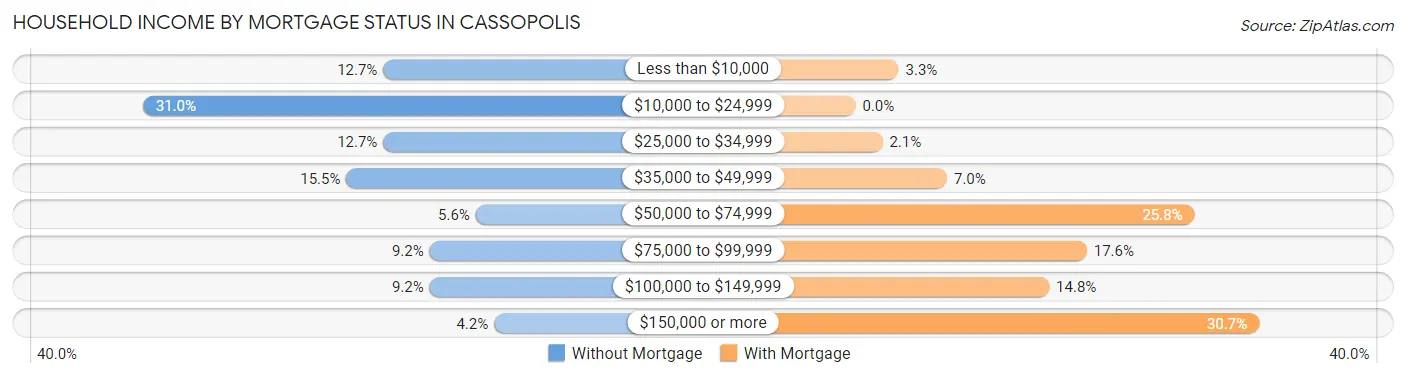
| Household Income | Without Mortgage | With Mortgage |
| Less than $10,000 | 18 (12.7%) | 8 (3.3%) |
| $10,000 to $24,999 | 44 (31.0%) | 0 (0.0%) |
| $25,000 to $34,999 | 18 (12.7%) | 5 (2.1%) |
| $35,000 to $49,999 | 22 (15.5%) | 17 (7.0%) |
| $50,000 to $74,999 | 8 (5.6%) | 63 (25.8%) |
| $75,000 to $99,999 | 13 (9.1%) | 43 (17.6%) |
| $100,000 to $149,999 | 13 (9.1%) | 36 (14.7%) |
| $150,000 or more | 6 (4.2%) | 75 (30.7%) |
| Total | 142 (100.0%) | 244 (100.0%) |
Property Value to Household Income Ratio in Cassopolis
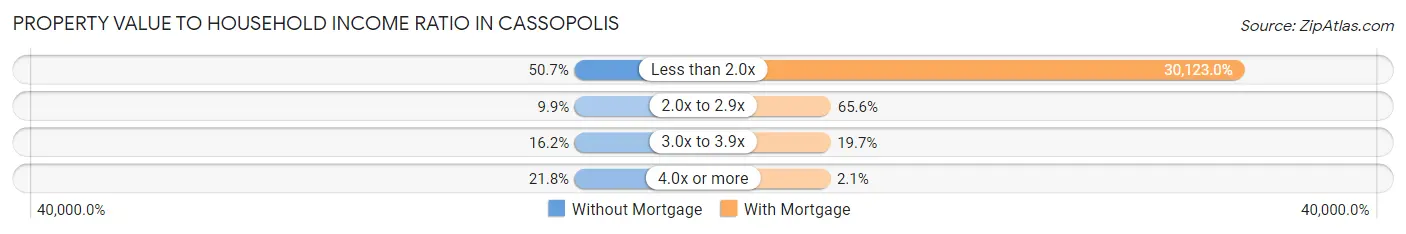
| Value-to-Income Ratio | Without Mortgage | With Mortgage |
| Less than 2.0x | 72 (50.7%) | 73,500 (30,122.9%) |
| 2.0x to 2.9x | 14 (9.9%) | 160 (65.6%) |
| 3.0x to 3.9x | 23 (16.2%) | 48 (19.7%) |
| 4.0x or more | 31 (21.8%) | 5 (2.1%) |
| Total | 142 (100.0%) | 244 (100.0%) |
Real Estate Taxes by Mortgage Status in Cassopolis
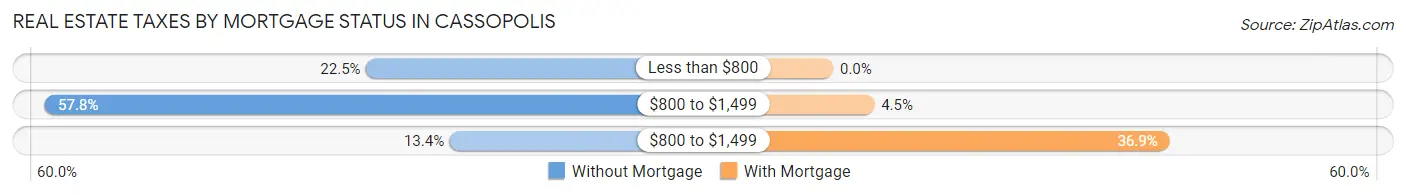
| Property Taxes | Without Mortgage | With Mortgage |
| Less than $800 | 32 (22.5%) | 0 (0.0%) |
| $800 to $1,499 | 82 (57.8%) | 11 (4.5%) |
| $800 to $1,499 | 19 (13.4%) | 90 (36.9%) |
| Total | 142 (100.0%) | 244 (100.0%) |
Health & Disability in Cassopolis
Health Insurance Coverage by Age in Cassopolis
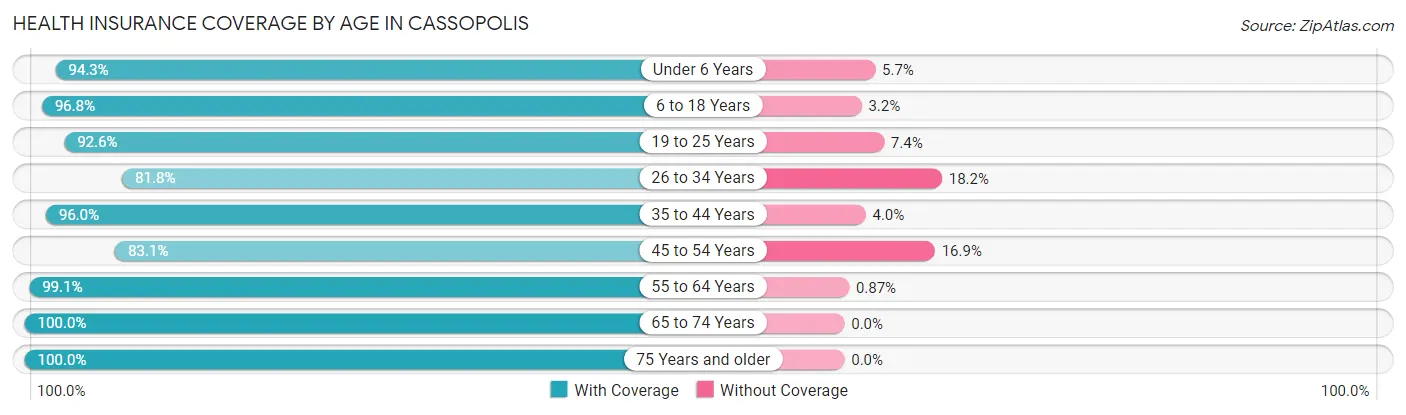
| Age Bracket | With Coverage | Without Coverage |
| Under 6 Years | 115 (94.3%) | 7 (5.7%) |
| 6 to 18 Years | 272 (96.8%) | 9 (3.2%) |
| 19 to 25 Years | 163 (92.6%) | 13 (7.4%) |
| 26 to 34 Years | 144 (81.8%) | 32 (18.2%) |
| 35 to 44 Years | 194 (96.0%) | 8 (4.0%) |
| 45 to 54 Years | 212 (83.1%) | 43 (16.9%) |
| 55 to 64 Years | 228 (99.1%) | 2 (0.9%) |
| 65 to 74 Years | 108 (100.0%) | 0 (0.0%) |
| 75 Years and older | 155 (100.0%) | 0 (0.0%) |
| Total | 1,591 (93.3%) | 114 (6.7%) |
Health Insurance Coverage by Citizenship Status in Cassopolis
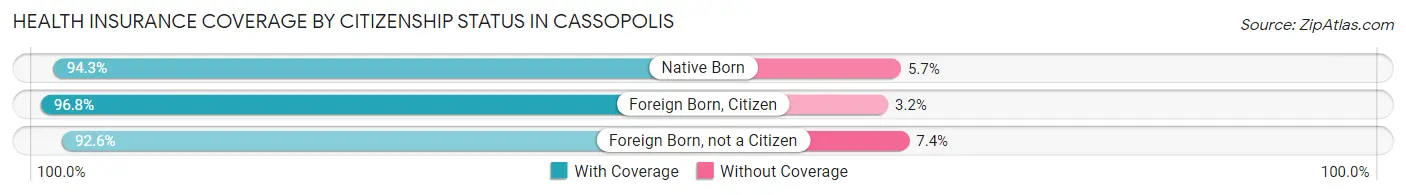
| Citizenship Status | With Coverage | Without Coverage |
| Native Born | 115 (94.3%) | 7 (5.7%) |
| Foreign Born, Citizen | 272 (96.8%) | 9 (3.2%) |
| Foreign Born, not a Citizen | 163 (92.6%) | 13 (7.4%) |
Health Insurance Coverage by Household Income in Cassopolis
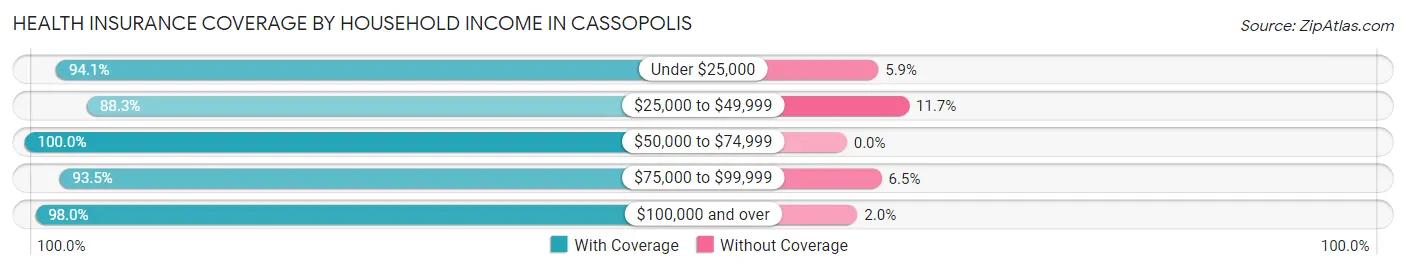
| Household Income | With Coverage | Without Coverage |
| Under $25,000 | 367 (94.1%) | 23 (5.9%) |
| $25,000 to $49,999 | 522 (88.3%) | 69 (11.7%) |
| $50,000 to $74,999 | 169 (100.0%) | 0 (0.0%) |
| $75,000 to $99,999 | 186 (93.5%) | 13 (6.5%) |
| $100,000 and over | 344 (98.0%) | 7 (2.0%) |
Public vs Private Health Insurance Coverage by Age in Cassopolis
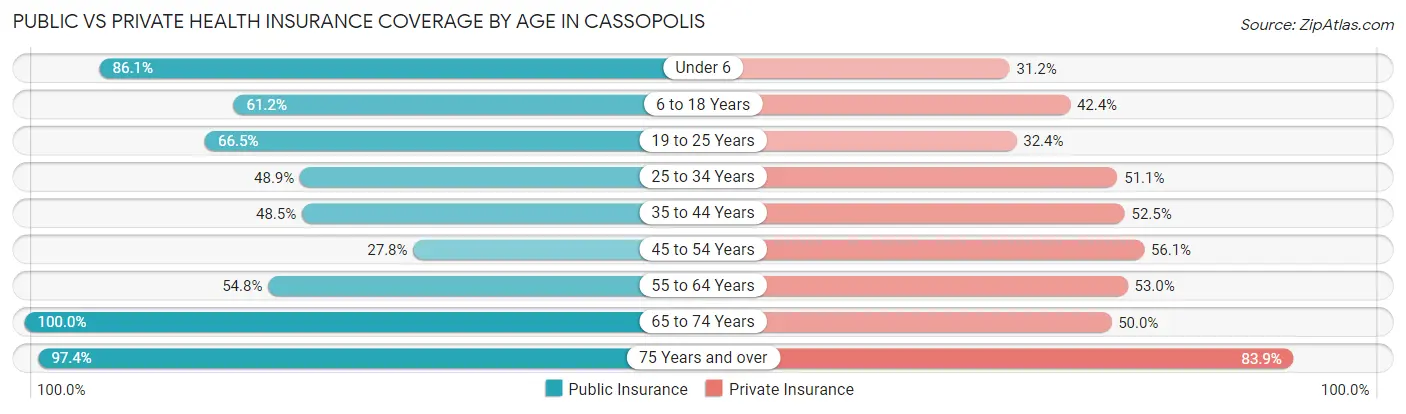
| Age Bracket | Public Insurance | Private Insurance |
| Under 6 | 105 (86.1%) | 38 (31.1%) |
| 6 to 18 Years | 172 (61.2%) | 119 (42.3%) |
| 19 to 25 Years | 117 (66.5%) | 57 (32.4%) |
| 25 to 34 Years | 86 (48.9%) | 90 (51.1%) |
| 35 to 44 Years | 98 (48.5%) | 106 (52.5%) |
| 45 to 54 Years | 71 (27.8%) | 143 (56.1%) |
| 55 to 64 Years | 126 (54.8%) | 122 (53.0%) |
| 65 to 74 Years | 108 (100.0%) | 54 (50.0%) |
| 75 Years and over | 151 (97.4%) | 130 (83.9%) |
| Total | 1,034 (60.7%) | 859 (50.4%) |
Disability Status by Sex by Age in Cassopolis
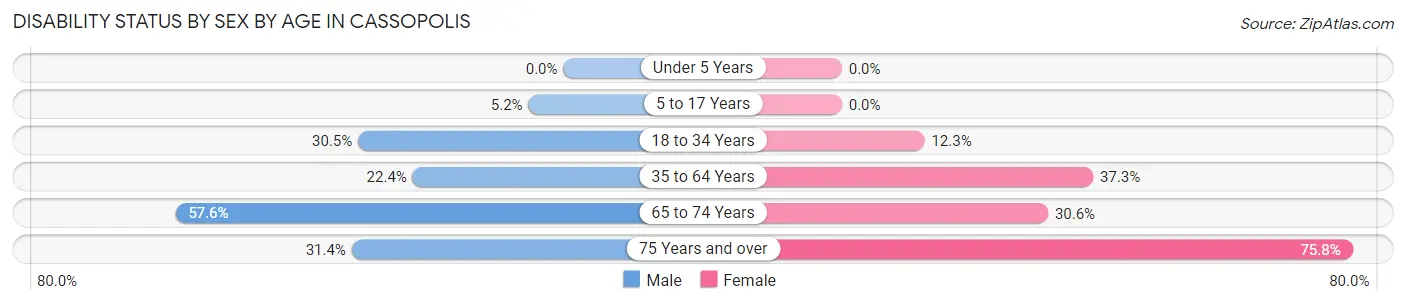
| Age Bracket | Male | Female |
| Under 5 Years | 0 (0.0%) | 0 (0.0%) |
| 5 to 17 Years | 7 (5.2%) | 0 (0.0%) |
| 18 to 34 Years | 64 (30.5%) | 21 (12.3%) |
| 35 to 64 Years | 77 (22.4%) | 128 (37.3%) |
| 65 to 74 Years | 34 (57.6%) | 15 (30.6%) |
| 75 Years and over | 11 (31.4%) | 91 (75.8%) |
Disability Class by Sex by Age in Cassopolis
Disability Class: Hearing Difficulty
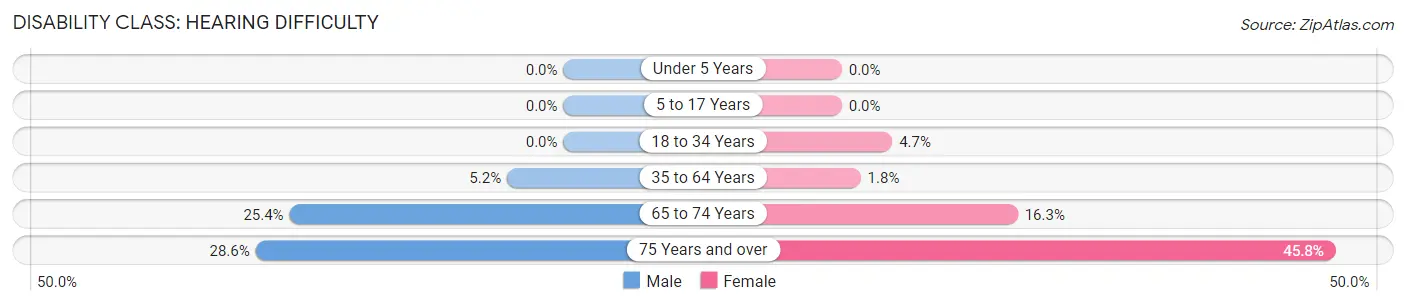
| Age Bracket | Male | Female |
| Under 5 Years | 0 (0.0%) | 0 (0.0%) |
| 5 to 17 Years | 0 (0.0%) | 0 (0.0%) |
| 18 to 34 Years | 0 (0.0%) | 8 (4.7%) |
| 35 to 64 Years | 18 (5.2%) | 6 (1.8%) |
| 65 to 74 Years | 15 (25.4%) | 8 (16.3%) |
| 75 Years and over | 10 (28.6%) | 55 (45.8%) |
Disability Class: Vision Difficulty
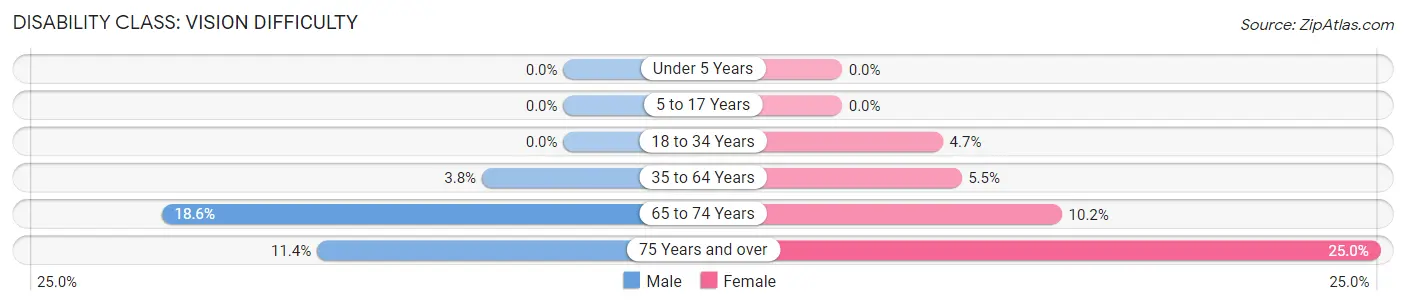
| Age Bracket | Male | Female |
| Under 5 Years | 0 (0.0%) | 0 (0.0%) |
| 5 to 17 Years | 0 (0.0%) | 0 (0.0%) |
| 18 to 34 Years | 0 (0.0%) | 8 (4.7%) |
| 35 to 64 Years | 13 (3.8%) | 19 (5.5%) |
| 65 to 74 Years | 11 (18.6%) | 5 (10.2%) |
| 75 Years and over | 4 (11.4%) | 30 (25.0%) |
Disability Class: Cognitive Difficulty
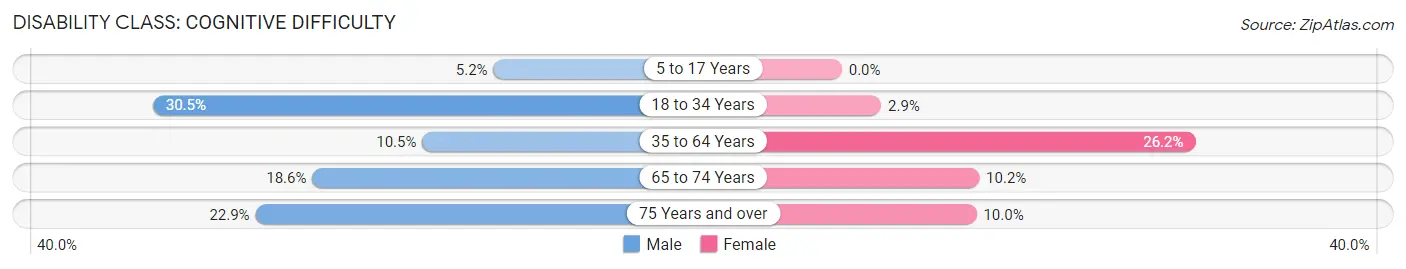
| Age Bracket | Male | Female |
| 5 to 17 Years | 7 (5.2%) | 0 (0.0%) |
| 18 to 34 Years | 64 (30.5%) | 5 (2.9%) |
| 35 to 64 Years | 36 (10.5%) | 90 (26.2%) |
| 65 to 74 Years | 11 (18.6%) | 5 (10.2%) |
| 75 Years and over | 8 (22.9%) | 12 (10.0%) |
Disability Class: Ambulatory Difficulty
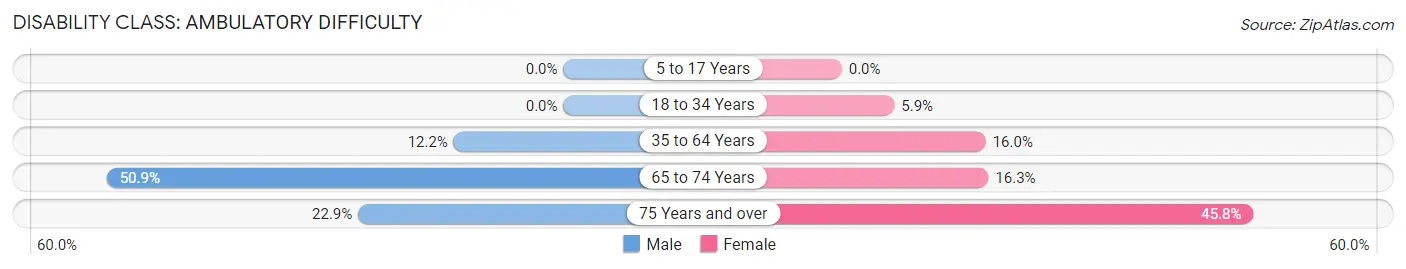
| Age Bracket | Male | Female |
| 5 to 17 Years | 0 (0.0%) | 0 (0.0%) |
| 18 to 34 Years | 0 (0.0%) | 10 (5.9%) |
| 35 to 64 Years | 42 (12.2%) | 55 (16.0%) |
| 65 to 74 Years | 30 (50.8%) | 8 (16.3%) |
| 75 Years and over | 8 (22.9%) | 55 (45.8%) |
Disability Class: Self-Care Difficulty
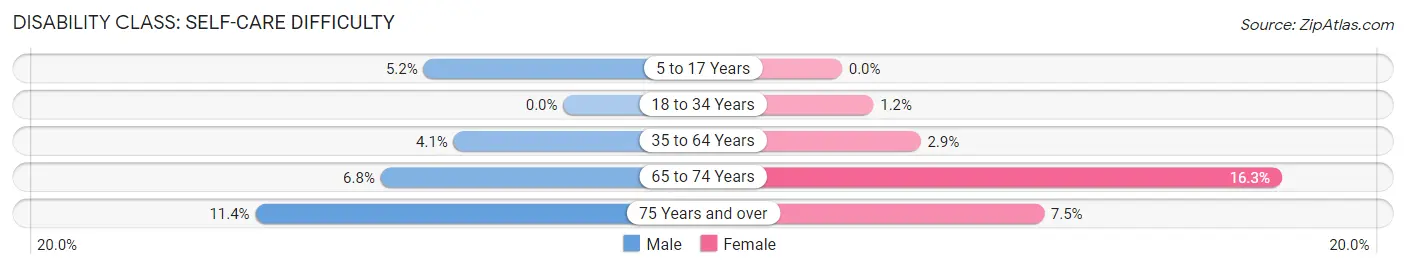
| Age Bracket | Male | Female |
| 5 to 17 Years | 7 (5.2%) | 0 (0.0%) |
| 18 to 34 Years | 0 (0.0%) | 2 (1.2%) |
| 35 to 64 Years | 14 (4.1%) | 10 (2.9%) |
| 65 to 74 Years | 4 (6.8%) | 8 (16.3%) |
| 75 Years and over | 4 (11.4%) | 9 (7.5%) |
Technology Access in Cassopolis
Computing Device Access in Cassopolis
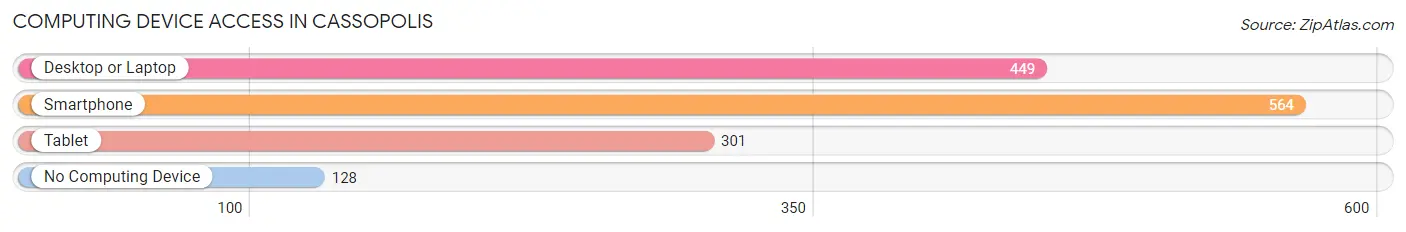
| Device Type | # Households | % Households |
| Desktop or Laptop | 449 | 59.2% |
| Smartphone | 564 | 74.3% |
| Tablet | 301 | 39.7% |
| No Computing Device | 128 | 16.9% |
| Total | 759 | 100.0% |
Internet Access in Cassopolis
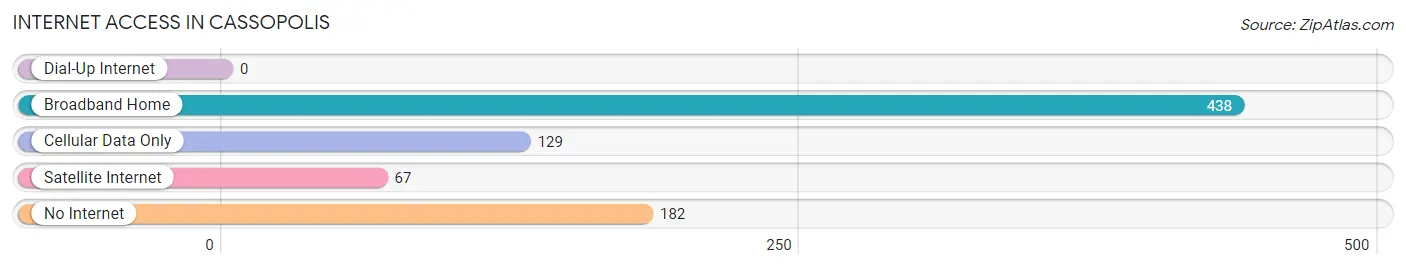
| Internet Type | # Households | % Households |
| Dial-Up Internet | 0 | 0.0% |
| Broadband Home | 438 | 57.7% |
| Cellular Data Only | 129 | 17.0% |
| Satellite Internet | 67 | 8.8% |
| No Internet | 182 | 24.0% |
| Total | 759 | 100.0% |
Cassopolis Summary
Cassopolis, Michigan is a small village located in Cass County in the southwestern part of the state. It is situated on the banks of the St. Joseph River and is the county seat of Cass County. The village has a population of 1,741 as of the 2010 census.
History
The area that is now Cassopolis was first settled in 1829 by a group of pioneers from New York. The village was originally known as “Little Prairie” and was later renamed Cassopolis in honor of General Lewis Cass, who was the governor of the Michigan Territory at the time. The village was officially incorporated in 1837.
In the late 19th century, Cassopolis was a thriving agricultural center and was known for its production of apples, peaches, and other fruits. The village was also home to several factories, including a woolen mill, a sawmill, and a gristmill.
Geography
Cassopolis is located in southwestern Michigan, approximately 40 miles east of South Bend, Indiana. The village is situated on the banks of the St. Joseph River and is surrounded by rolling hills and farmland. The village is located in the Central Lowlands region of Michigan, which is characterized by flat terrain and fertile soil.
The climate in Cassopolis is humid continental, with hot summers and cold winters. The average annual temperature is around 50 degrees Fahrenheit, and the average annual precipitation is around 35 inches.
Economy
The economy of Cassopolis is largely based on agriculture and manufacturing. The village is home to several factories, including a paper mill, a plastics factory, and a metal fabrication plant. The village is also home to several small businesses, including restaurants, retail stores, and service providers.
The village is also home to several educational institutions, including a community college and a vocational school. The village is also home to a branch of the Cass County Library.
Demographics
As of the 2010 census, the population of Cassopolis was 1,741. The racial makeup of the village was 94.3% White, 1.2% African American, 0.7% Native American, 0.3% Asian, 0.1% Pacific Islander, and 3.4% from other races. The median household income was $37,917, and the median family income was $45,938.
The village is home to several churches, including the First Presbyterian Church, the First United Methodist Church, and the St. Joseph Catholic Church. The village is also home to several parks, including the Cassopolis Village Park and the Cass County Park.
Conclusion
Cassopolis, Michigan is a small village located in Cass County in the southwestern part of the state. It is situated on the banks of the St. Joseph River and is the county seat of Cass County. The village has a population of 1,741 as of the 2010 census. The economy of Cassopolis is largely based on agriculture and manufacturing, and the village is home to several educational institutions, churches, and parks.
Common Questions
What is Per Capita Income in Cassopolis?
Per Capita income in Cassopolis is $21,507.
What is the Median Family Income in Cassopolis?
Median Family Income in Cassopolis is $48,963.
What is the Median Household income in Cassopolis?
Median Household Income in Cassopolis is $39,107.
What is Income or Wage Gap in Cassopolis?
Income or Wage Gap in Cassopolis is 18.8%.
Women in Cassopolis earn 81.2 cents for every dollar earned by a man.
What is Inequality or Gini Index in Cassopolis?
Inequality or Gini Index in Cassopolis is 0.43.
What is the Total Population of Cassopolis?
Total Population of Cassopolis is 1,750.
What is the Total Male Population of Cassopolis?
Total Male Population of Cassopolis is 894.
What is the Total Female Population of Cassopolis?
Total Female Population of Cassopolis is 856.
What is the Ratio of Males per 100 Females in Cassopolis?
There are 104.44 Males per 100 Females in Cassopolis.
What is the Ratio of Females per 100 Males in Cassopolis?
There are 95.75 Females per 100 Males in Cassopolis.
What is the Median Population Age in Cassopolis?
Median Population Age in Cassopolis is 41.2 Years.
What is the Average Family Size in Cassopolis
Average Family Size in Cassopolis is 2.9 People.
What is the Average Household Size in Cassopolis
Average Household Size in Cassopolis is 2.2 People.
How Large is the Labor Force in Cassopolis?
There are 811 People in the Labor Forcein in Cassopolis.
What is the Percentage of People in the Labor Force in Cassopolis?
56.9% of People are in the Labor Force in Cassopolis.
What is the Unemployment Rate in Cassopolis?
Unemployment Rate in Cassopolis is 15.4%.