Central Lake, MI Map & Demographics
Central Lake Map
Central Lake Overview
$23,834
PER CAPITA INCOME
$59,167
AVG FAMILY INCOME
$56,550
AVG HOUSEHOLD INCOME
8.7%
WAGE / INCOME GAP [ % ]
91.3¢/ $1
WAGE / INCOME GAP [ $ ]
0.35
INEQUALITY / GINI INDEX
887
TOTAL POPULATION
473
MALE POPULATION
414
FEMALE POPULATION
114.25
MALES / 100 FEMALES
87.53
FEMALES / 100 MALES
35.5
MEDIAN AGE
3.2
AVG FAMILY SIZE
2.7
AVG HOUSEHOLD SIZE
381
LABOR FORCE [ PEOPLE ]
60.6%
PERCENT IN LABOR FORCE
3.1%
UNEMPLOYMENT RATE
Central Lake Zip Codes
Central Lake Area Codes
Income in Central Lake
Income Overview in Central Lake
Per Capita Income in Central Lake is $23,834, while median incomes of families and households are $59,167 and $56,550 respectively.
| Characteristic | Number | Measure |
| Per Capita Income | 887 | $23,834 |
| Median Family Income | 238 | $59,167 |
| Mean Family Income | 238 | $76,776 |
| Median Household Income | 323 | $56,550 |
| Mean Household Income | 323 | $68,521 |
| Income Deficit | 238 | $0 |
| Wage / Income Gap (%) | 887 | 8.68% |
| Wage / Income Gap ($) | 887 | 91.32¢ per $1 |
| Gini / Inequality Index | 887 | 0.35 |
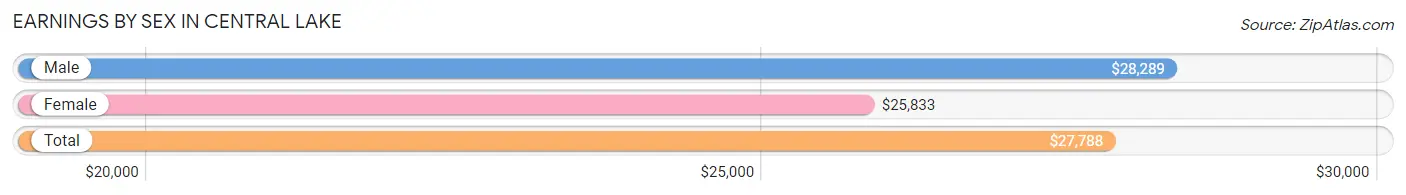
Earnings by Sex in Central Lake
Average Earnings in Central Lake are $27,788, $28,289 for men and $25,833 for women, a difference of 8.7%.
| Sex | Number | Average Earnings |
| Male | 194 (49.2%) | $28,289 |
| Female | 200 (50.8%) | $25,833 |
| Total | 394 (100.0%) | $27,788 |
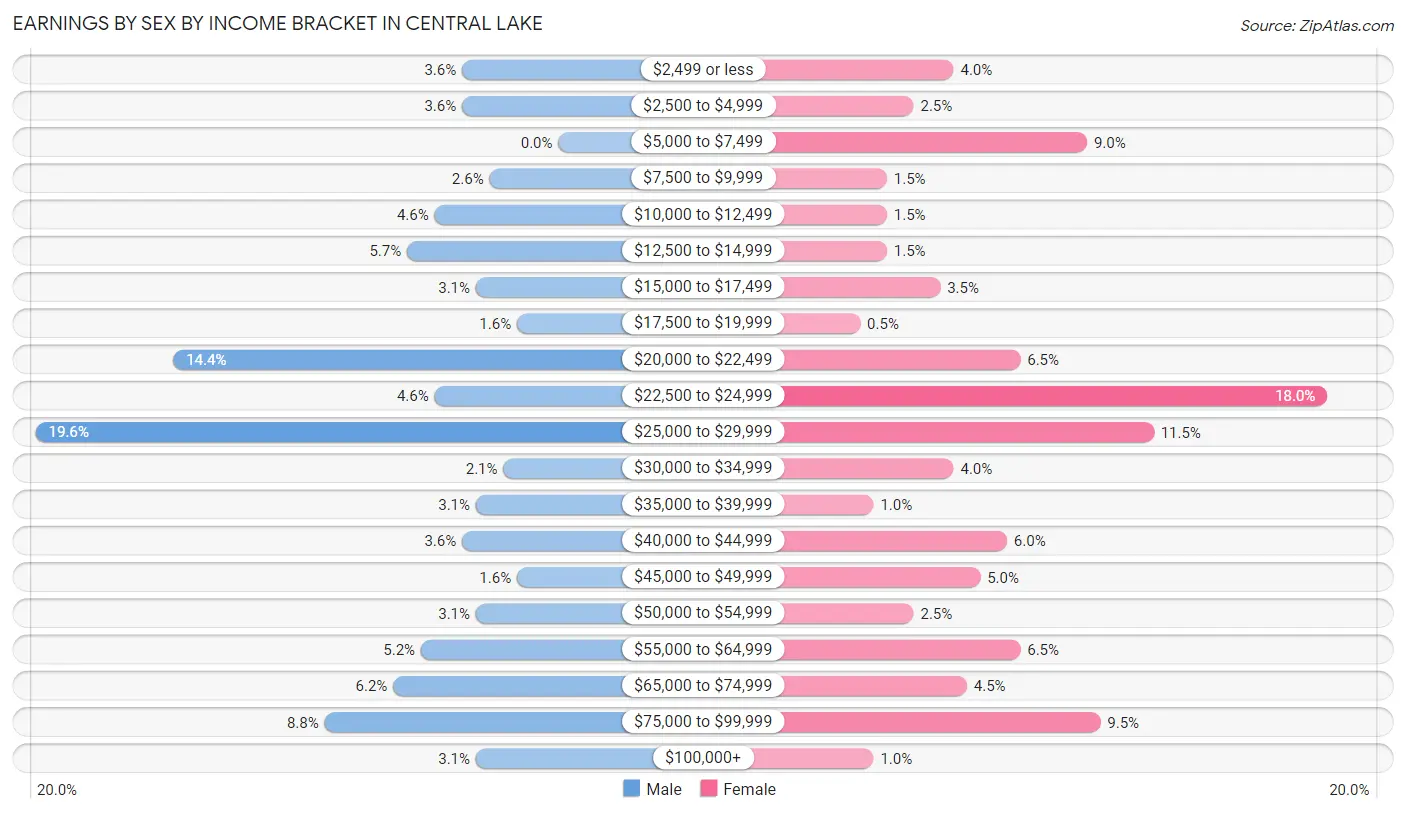
Earnings by Sex by Income Bracket in Central Lake
The most common earnings brackets in Central Lake are $25,000 to $29,999 for men (38 | 19.6%) and $22,500 to $24,999 for women (36 | 18.0%).
| Income | Male | Female |
| $2,499 or less | 7 (3.6%) | 8 (4.0%) |
| $2,500 to $4,999 | 7 (3.6%) | 5 (2.5%) |
| $5,000 to $7,499 | 0 (0.0%) | 18 (9.0%) |
| $7,500 to $9,999 | 5 (2.6%) | 3 (1.5%) |
| $10,000 to $12,499 | 9 (4.6%) | 3 (1.5%) |
| $12,500 to $14,999 | 11 (5.7%) | 3 (1.5%) |
| $15,000 to $17,499 | 6 (3.1%) | 7 (3.5%) |
| $17,500 to $19,999 | 3 (1.5%) | 1 (0.5%) |
| $20,000 to $22,499 | 28 (14.4%) | 13 (6.5%) |
| $22,500 to $24,999 | 9 (4.6%) | 36 (18.0%) |
| $25,000 to $29,999 | 38 (19.6%) | 23 (11.5%) |
| $30,000 to $34,999 | 4 (2.1%) | 8 (4.0%) |
| $35,000 to $39,999 | 6 (3.1%) | 2 (1.0%) |
| $40,000 to $44,999 | 7 (3.6%) | 12 (6.0%) |
| $45,000 to $49,999 | 3 (1.5%) | 10 (5.0%) |
| $50,000 to $54,999 | 6 (3.1%) | 5 (2.5%) |
| $55,000 to $64,999 | 10 (5.1%) | 13 (6.5%) |
| $65,000 to $74,999 | 12 (6.2%) | 9 (4.5%) |
| $75,000 to $99,999 | 17 (8.8%) | 19 (9.5%) |
| $100,000+ | 6 (3.1%) | 2 (1.0%) |
| Total | 194 (100.0%) | 200 (100.0%) |
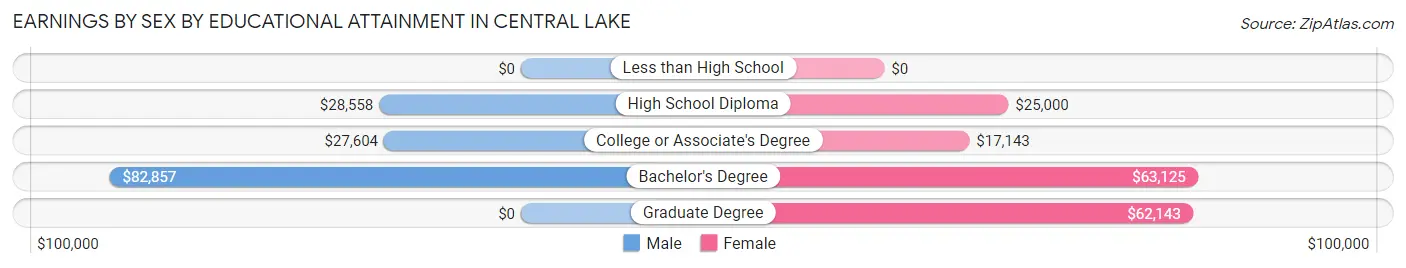
Earnings by Sex by Educational Attainment in Central Lake
Average earnings in Central Lake are $29,046 for men and $29,286 for women, a difference of 0.8%. Men with an educational attainment of bachelor's degree enjoy the highest average annual earnings of $82,857, while those with college or associate's degree education earn the least with $27,604. Women with an educational attainment of bachelor's degree earn the most with the average annual earnings of $63,125, while those with college or associate's degree education have the smallest earnings of $17,143.
| Educational Attainment | Male Income | Female Income |
| Less than High School | - | - |
| High School Diploma | $28,558 | $25,000 |
| College or Associate's Degree | $27,604 | $17,143 |
| Bachelor's Degree | $82,857 | $63,125 |
| Graduate Degree | - | - |
| Total | $29,046 | $29,286 |
Family Income in Central Lake
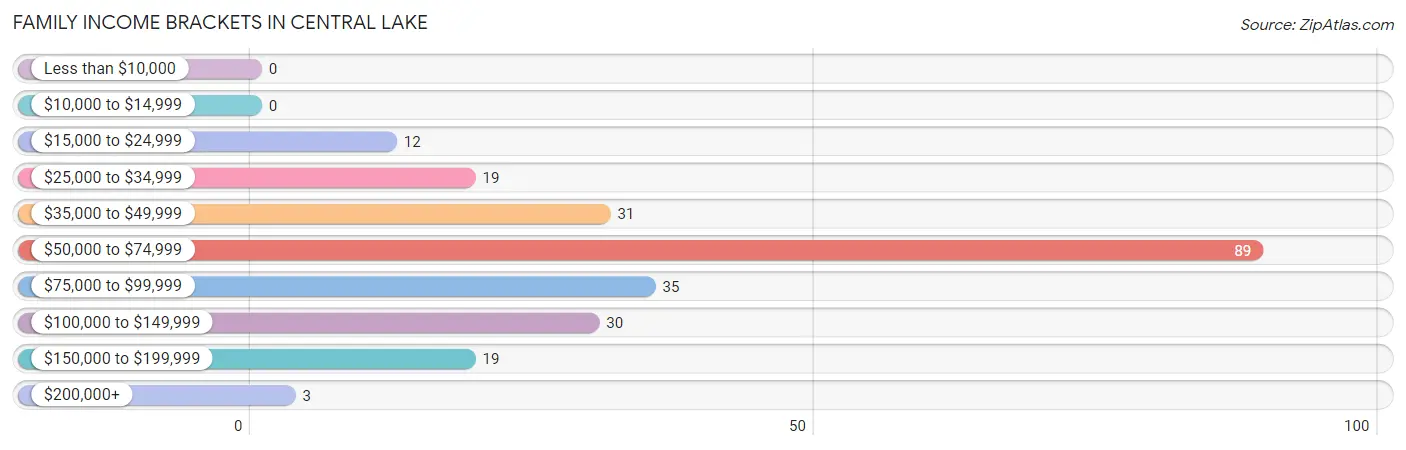
Family Income Brackets in Central Lake
According to the Central Lake family income data, there are 89 families falling into the $50,000 to $74,999 income range, which is the most common income bracket and makes up 37.4% of all families.
| Income Bracket | # Families | % Families |
| Less than $10,000 | 0 | 0.0% |
| $10,000 to $14,999 | 0 | 0.0% |
| $15,000 to $24,999 | 12 | 5.0% |
| $25,000 to $34,999 | 19 | 8.0% |
| $35,000 to $49,999 | 31 | 13.0% |
| $50,000 to $74,999 | 89 | 37.4% |
| $75,000 to $99,999 | 35 | 14.7% |
| $100,000 to $149,999 | 30 | 12.6% |
| $150,000 to $199,999 | 19 | 8.0% |
| $200,000+ | 3 | 1.3% |
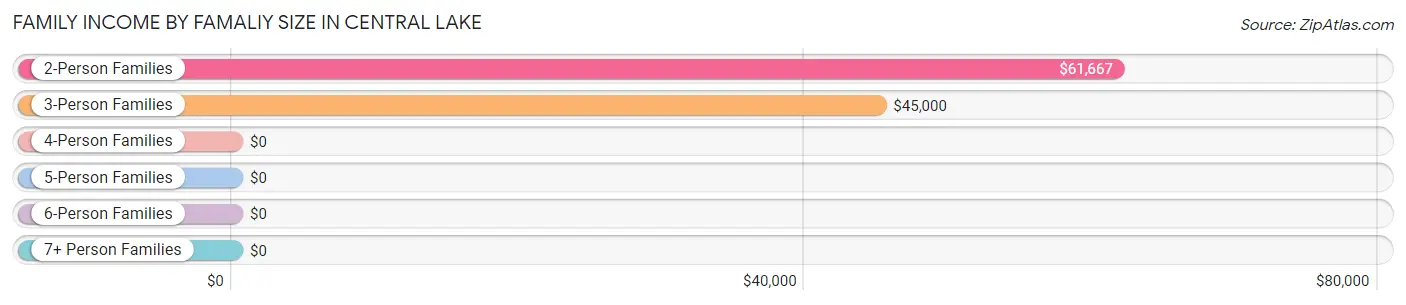
Family Income by Famaliy Size in Central Lake
2-person families (100 | 42.0%) account for the highest median family income in Central Lake with $61,667 per family, while 2-person families (100 | 42.0%) have the highest median income of $30,834 per family member.
| Income Bracket | # Families | Median Income |
| 2-Person Families | 100 (42.0%) | $61,667 |
| 3-Person Families | 54 (22.7%) | $45,000 |
| 4-Person Families | 33 (13.9%) | $0 |
| 5-Person Families | 22 (9.2%) | $0 |
| 6-Person Families | 9 (3.8%) | $0 |
| 7+ Person Families | 20 (8.4%) | $0 |
| Total | 238 (100.0%) | $59,167 |
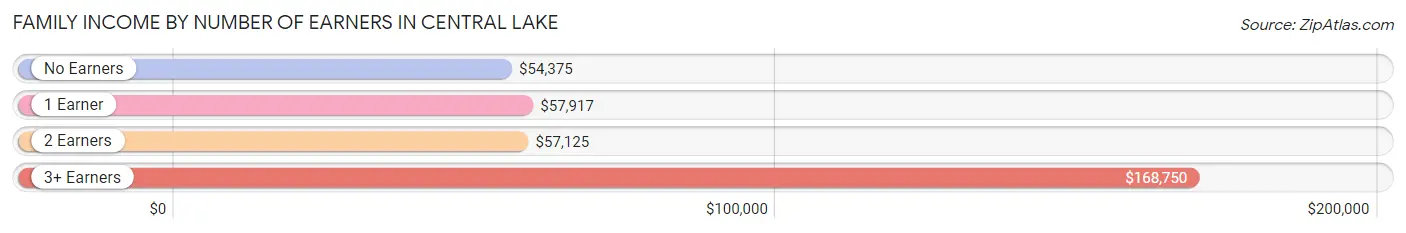
Family Income by Number of Earners in Central Lake
The median family income in Central Lake is $59,167, with families comprising 3+ earners (30) having the highest median family income of $168,750, while families with no earners (51) have the lowest median family income of $54,375, accounting for 12.6% and 21.4% of families, respectively.
| Number of Earners | # Families | Median Income |
| No Earners | 51 (21.4%) | $54,375 |
| 1 Earner | 69 (29.0%) | $57,917 |
| 2 Earners | 88 (37.0%) | $57,125 |
| 3+ Earners | 30 (12.6%) | $168,750 |
| Total | 238 (100.0%) | $59,167 |
Household Income in Central Lake
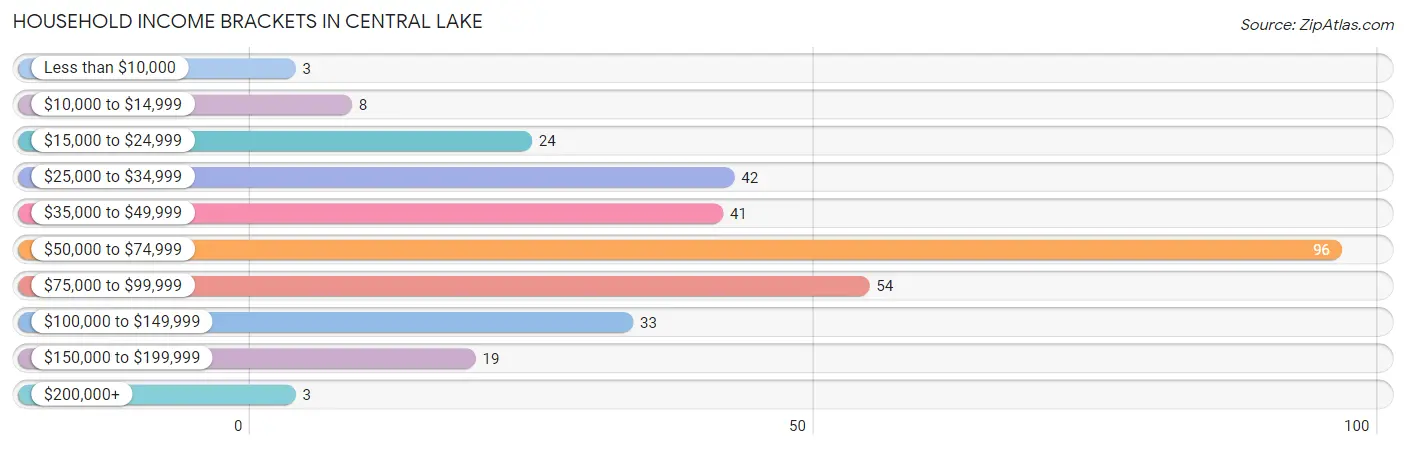
Household Income Brackets in Central Lake
With 96 households falling in the category, the $50,000 to $74,999 income range is the most frequent in Central Lake, accounting for 29.7% of all households. In contrast, only 3 households (0.9%) fall into the less than $10,000 income bracket, making it the least populous group.
| Income Bracket | # Households | % Households |
| Less than $10,000 | 3 | 0.9% |
| $10,000 to $14,999 | 8 | 2.5% |
| $15,000 to $24,999 | 24 | 7.4% |
| $25,000 to $34,999 | 42 | 13.0% |
| $35,000 to $49,999 | 41 | 12.7% |
| $50,000 to $74,999 | 96 | 29.7% |
| $75,000 to $99,999 | 54 | 16.7% |
| $100,000 to $149,999 | 33 | 10.2% |
| $150,000 to $199,999 | 19 | 5.9% |
| $200,000+ | 3 | 0.9% |
Household Income by Householder Age in Central Lake
The median household income in Central Lake is $56,550, with the highest median household income of $75,208 found in the 45 to 64 years age bracket for the primary householder. A total of 93 households (28.8%) fall into this category.
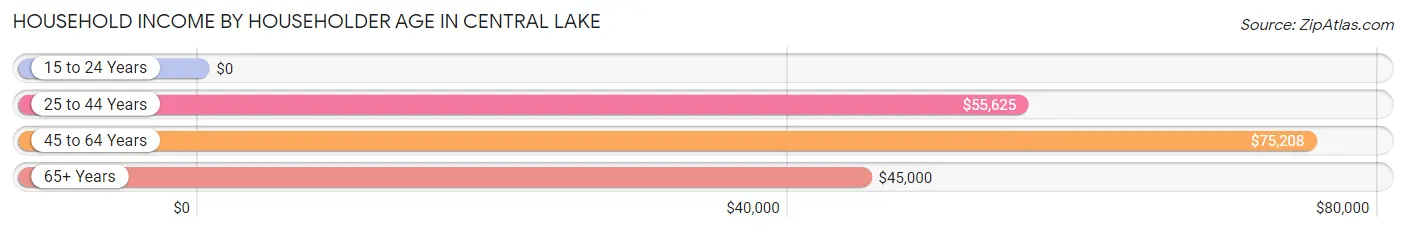
| Income Bracket | # Households | Median Income |
| 15 to 24 Years | 0 (0.0%) | $0 |
| 25 to 44 Years | 118 (36.5%) | $55,625 |
| 45 to 64 Years | 93 (28.8%) | $75,208 |
| 65+ Years | 112 (34.7%) | $45,000 |
| Total | 323 (100.0%) | $56,550 |
Poverty in Central Lake
Income Below Poverty by Sex and Age in Central Lake
With 9.3% poverty level for males and 17.4% for females among the residents of Central Lake, 25 to 34 year old males and 12 to 14 year old females are the most vulnerable to poverty, with 13 males (24.1%) and 7 females (100.0%) in their respective age groups living below the poverty level.
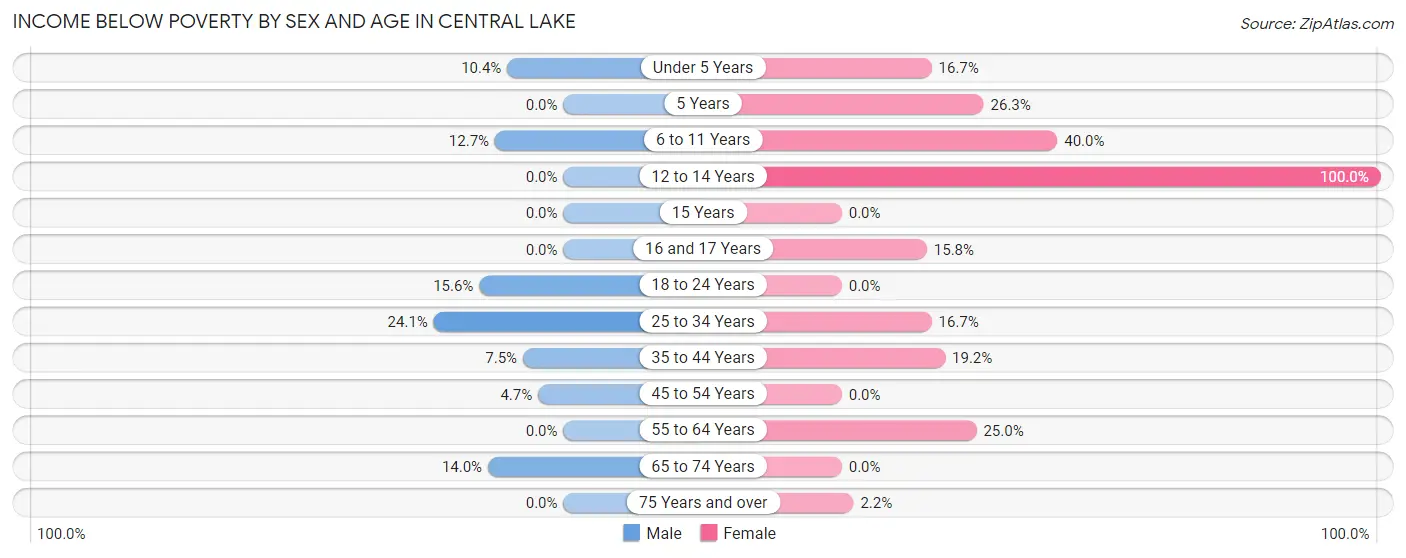
| Age Bracket | Male | Female |
| Under 5 Years | 5 (10.4%) | 1 (16.7%) |
| 5 Years | 0 (0.0%) | 5 (26.3%) |
| 6 to 11 Years | 8 (12.7%) | 22 (40.0%) |
| 12 to 14 Years | 0 (0.0%) | 7 (100.0%) |
| 15 Years | 0 (0.0%) | 0 (0.0%) |
| 16 and 17 Years | 0 (0.0%) | 3 (15.8%) |
| 18 to 24 Years | 5 (15.6%) | 0 (0.0%) |
| 25 to 34 Years | 13 (24.1%) | 6 (16.7%) |
| 35 to 44 Years | 3 (7.5%) | 14 (19.2%) |
| 45 to 54 Years | 3 (4.7%) | 0 (0.0%) |
| 55 to 64 Years | 0 (0.0%) | 13 (25.0%) |
| 65 to 74 Years | 7 (14.0%) | 0 (0.0%) |
| 75 Years and over | 0 (0.0%) | 1 (2.2%) |
| Total | 44 (9.3%) | 72 (17.4%) |
Income Above Poverty by Sex and Age in Central Lake
According to the poverty statistics in Central Lake, males aged 5 years and females aged 18 to 24 years are the age groups that are most secure financially, with 100.0% of males and 100.0% of females in these age groups living above the poverty line.
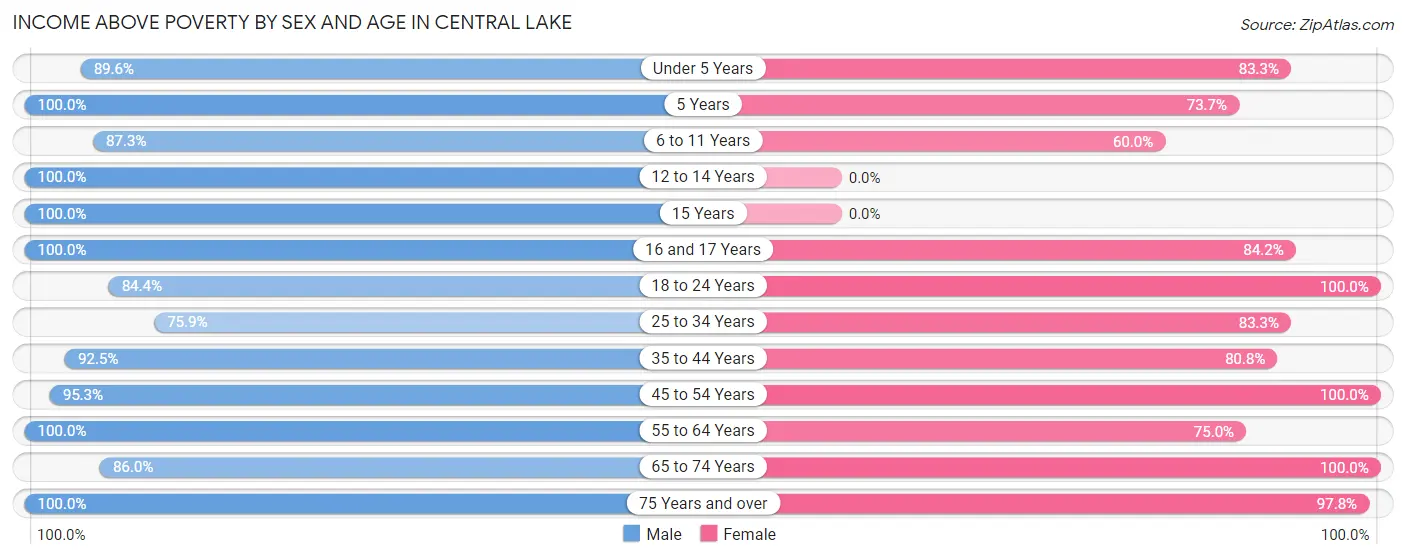
| Age Bracket | Male | Female |
| Under 5 Years | 43 (89.6%) | 5 (83.3%) |
| 5 Years | 4 (100.0%) | 14 (73.7%) |
| 6 to 11 Years | 55 (87.3%) | 33 (60.0%) |
| 12 to 14 Years | 47 (100.0%) | 0 (0.0%) |
| 15 Years | 9 (100.0%) | 0 (0.0%) |
| 16 and 17 Years | 5 (100.0%) | 16 (84.2%) |
| 18 to 24 Years | 27 (84.4%) | 22 (100.0%) |
| 25 to 34 Years | 41 (75.9%) | 30 (83.3%) |
| 35 to 44 Years | 37 (92.5%) | 59 (80.8%) |
| 45 to 54 Years | 61 (95.3%) | 35 (100.0%) |
| 55 to 64 Years | 27 (100.0%) | 39 (75.0%) |
| 65 to 74 Years | 43 (86.0%) | 44 (100.0%) |
| 75 Years and over | 30 (100.0%) | 45 (97.8%) |
| Total | 429 (90.7%) | 342 (82.6%) |
Income Below Poverty Among Married-Couple Families in Central Lake
The poverty statistics for married-couple families in Central Lake show that 1.7% or 3 of the total 172 families live below the poverty line. Families with 1 or 2 children have the highest poverty rate of 4.5%, comprising of 3 families. On the other hand, families with no children have the lowest poverty rate of 0.0%, which includes 0 families.
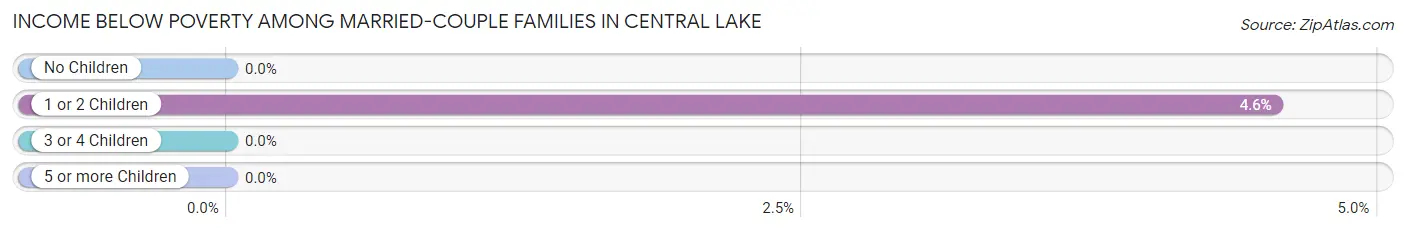
| Children | Above Poverty | Below Poverty |
| No Children | 78 (100.0%) | 0 (0.0%) |
| 1 or 2 Children | 63 (95.5%) | 3 (4.5%) |
| 3 or 4 Children | 8 (100.0%) | 0 (0.0%) |
| 5 or more Children | 20 (100.0%) | 0 (0.0%) |
| Total | 169 (98.3%) | 3 (1.7%) |
Income Below Poverty Among Single-Parent Households in Central Lake
According to the poverty data in Central Lake, 11.1% or 2 single-father households and 31.2% or 15 single-mother households are living below the poverty line. Among single-father households, those with 1 or 2 children have the highest poverty rate, with 2 households (25.0%) experiencing poverty. Likewise, among single-mother households, those with 3 or 4 children have the highest poverty rate, with 2 households (100.0%) falling below the poverty line.
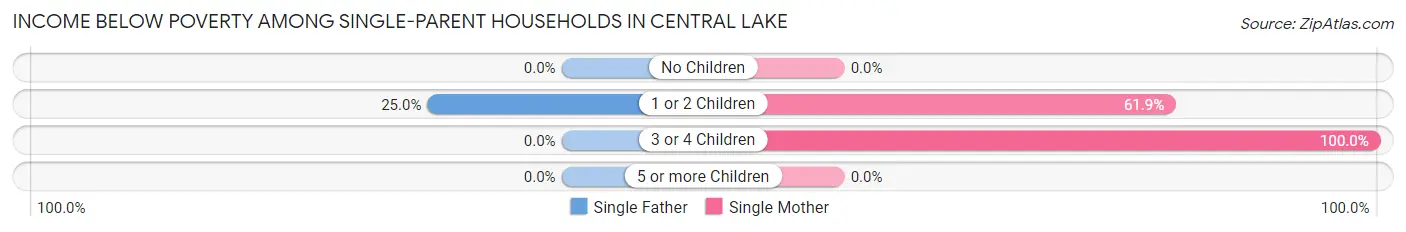
| Children | Single Father | Single Mother |
| No Children | 0 (0.0%) | 0 (0.0%) |
| 1 or 2 Children | 2 (25.0%) | 13 (61.9%) |
| 3 or 4 Children | 0 (0.0%) | 2 (100.0%) |
| 5 or more Children | 0 (0.0%) | 0 (0.0%) |
| Total | 2 (11.1%) | 15 (31.2%) |
Income Below Poverty Among Married-Couple vs Single-Parent Households in Central Lake
The poverty data for Central Lake shows that 3 of the married-couple family households (1.7%) and 17 of the single-parent households (25.8%) are living below the poverty level. Within the married-couple family households, those with 1 or 2 children have the highest poverty rate, with 3 households (4.5%) falling below the poverty line. Among the single-parent households, those with 3 or 4 children have the highest poverty rate, with 2 household (100.0%) living below poverty.
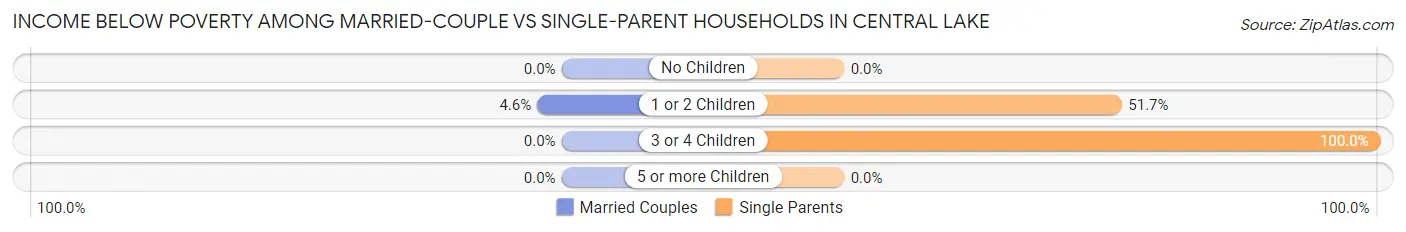
| Children | Married-Couple Families | Single-Parent Households |
| No Children | 0 (0.0%) | 0 (0.0%) |
| 1 or 2 Children | 3 (4.5%) | 15 (51.7%) |
| 3 or 4 Children | 0 (0.0%) | 2 (100.0%) |
| 5 or more Children | 0 (0.0%) | 0 (0.0%) |
| Total | 3 (1.7%) | 17 (25.8%) |
Race in Central Lake
The most populous races in Central Lake are White / Caucasian (871 | 98.2%), Native / Alaskan (8 | 0.9%), and Two or more Races (7 | 0.8%).
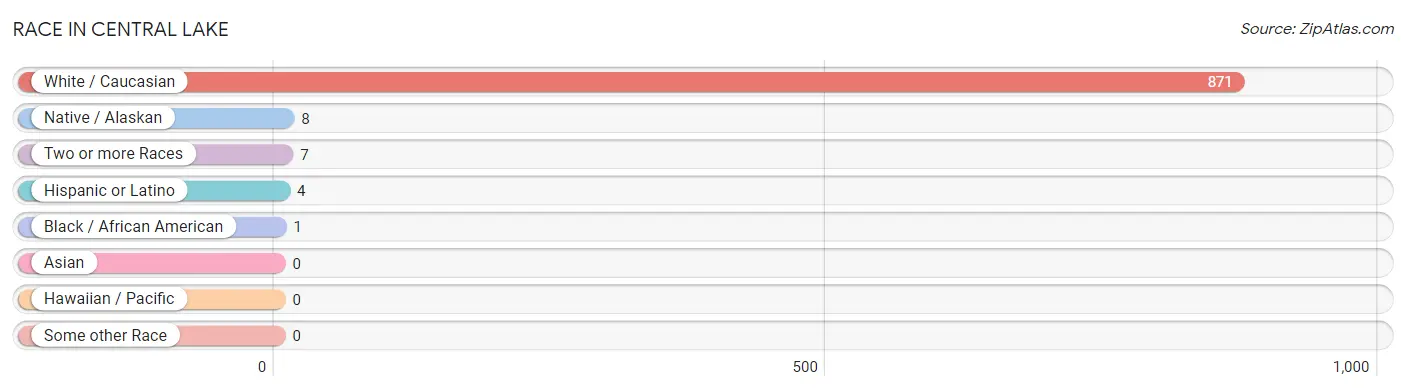
| Race | # Population | % Population |
| Asian | 0 | 0.0% |
| Black / African American | 1 | 0.1% |
| Hawaiian / Pacific | 0 | 0.0% |
| Hispanic or Latino | 4 | 0.4% |
| Native / Alaskan | 8 | 0.9% |
| White / Caucasian | 871 | 98.2% |
| Two or more Races | 7 | 0.8% |
| Some other Race | 0 | 0.0% |
| Total | 887 | 100.0% |
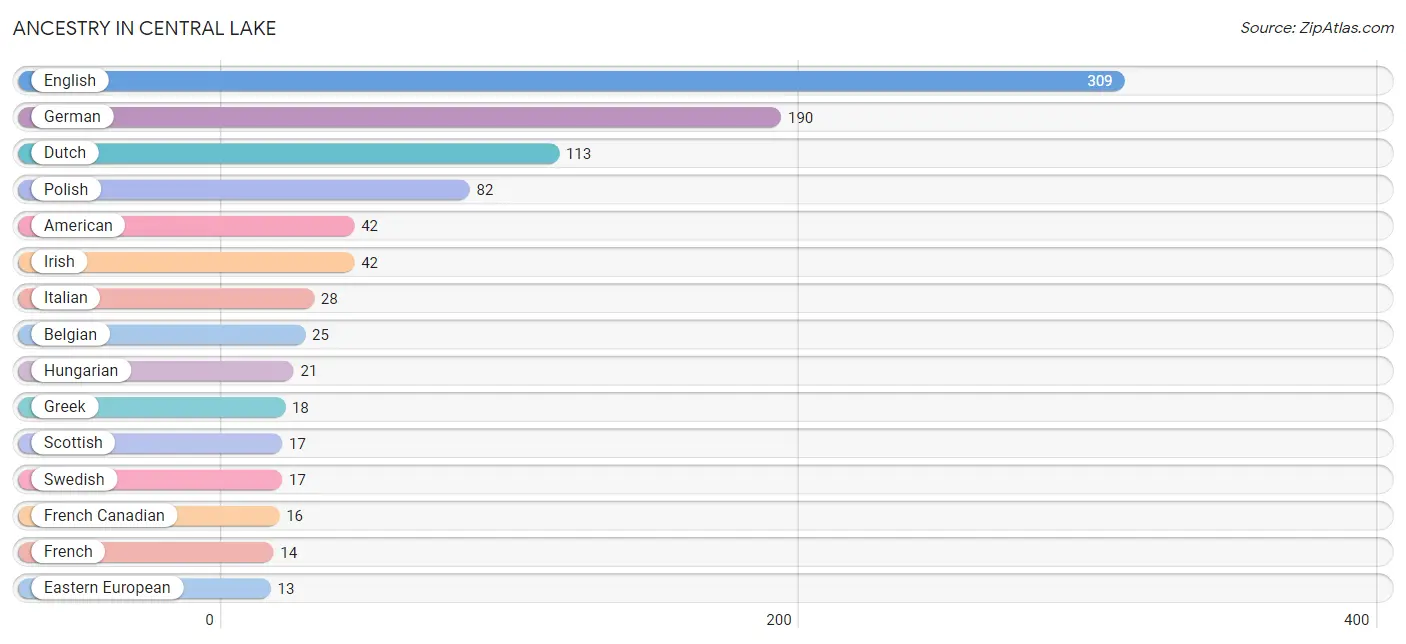
Ancestry in Central Lake
The most populous ancestries reported in Central Lake are English (309 | 34.8%), German (190 | 21.4%), Dutch (113 | 12.7%), Polish (82 | 9.2%), and American (42 | 4.7%), together accounting for 83.0% of all Central Lake residents.
| Ancestry | # Population | % Population |
| American | 42 | 4.7% |
| Belgian | 25 | 2.8% |
| British | 7 | 0.8% |
| Canadian | 2 | 0.2% |
| Central American | 4 | 0.4% |
| Cherokee | 1 | 0.1% |
| Croatian | 9 | 1.0% |
| Danish | 4 | 0.4% |
| Dutch | 113 | 12.7% |
| Eastern European | 13 | 1.5% |
| English | 309 | 34.8% |
| European | 2 | 0.2% |
| French | 14 | 1.6% |
| French Canadian | 16 | 1.8% |
| German | 190 | 21.4% |
| Greek | 18 | 2.0% |
| Hungarian | 21 | 2.4% |
| Irish | 42 | 4.7% |
| Italian | 28 | 3.2% |
| Norwegian | 2 | 0.2% |
| Ottawa | 8 | 0.9% |
| Pennsylvania German | 3 | 0.3% |
| Polish | 82 | 9.2% |
| Salvadoran | 4 | 0.4% |
| Scotch-Irish | 11 | 1.2% |
| Scottish | 17 | 1.9% |
| Slovak | 2 | 0.2% |
| Swedish | 17 | 1.9% |
| Welsh | 1 | 0.1% | View All 29 Rows |
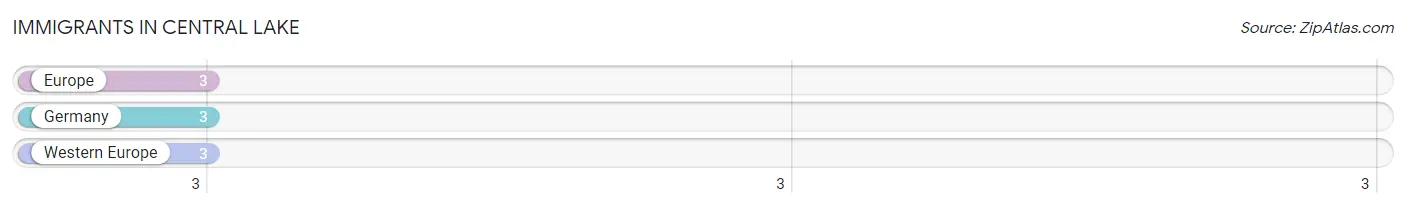
Immigrants in Central Lake
The most numerous immigrant groups reported in Central Lake came from Europe (3 | 0.3%), Germany (3 | 0.3%), and Western Europe (3 | 0.3%), together accounting for 1.0% of all Central Lake residents.
| Immigration Origin | # Population | % Population |
| Europe | 3 | 0.3% |
| Germany | 3 | 0.3% |
| Western Europe | 3 | 0.3% | View All 3 Rows |
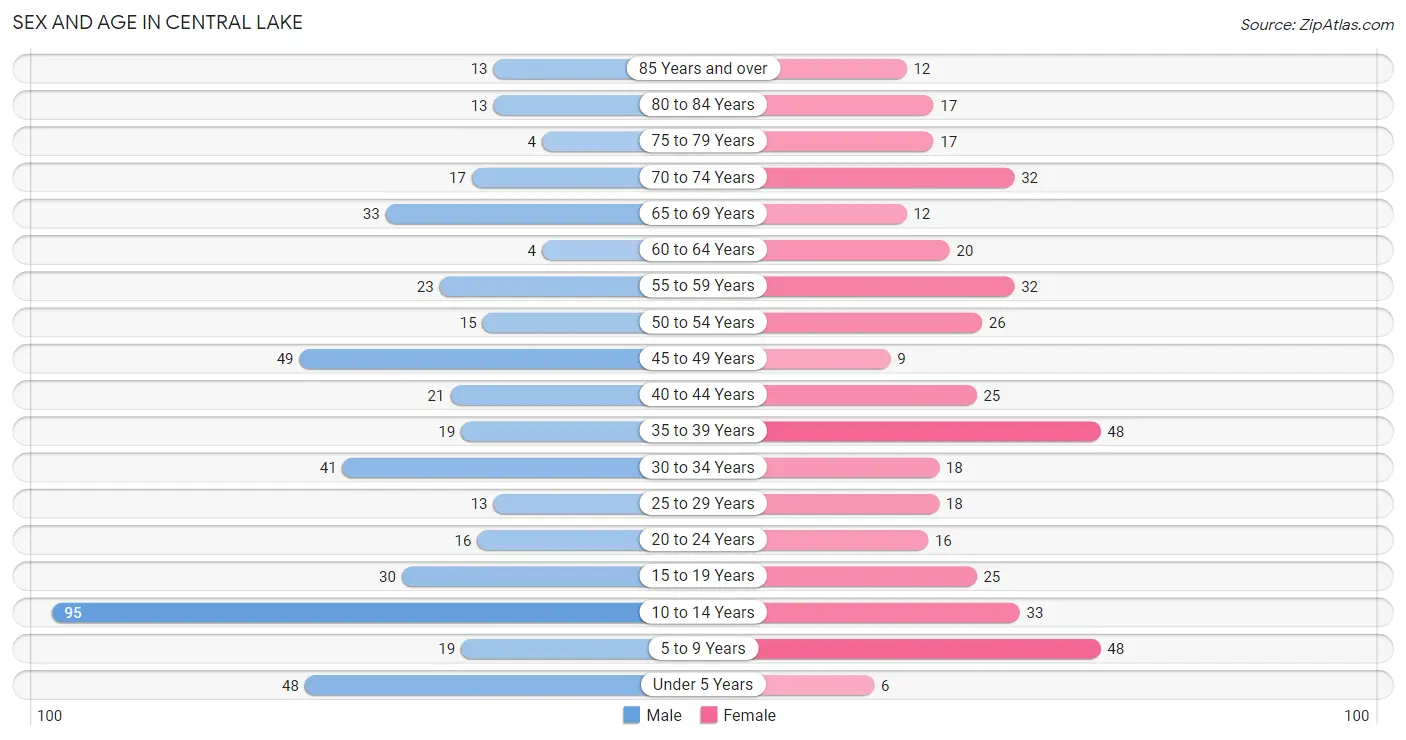
Sex and Age in Central Lake
Sex and Age in Central Lake
The most populous age groups in Central Lake are 10 to 14 Years (95 | 20.1%) for men and 5 to 9 Years (48 | 11.6%) for women.
| Age Bracket | Male | Female |
| Under 5 Years | 48 (10.2%) | 6 (1.5%) |
| 5 to 9 Years | 19 (4.0%) | 48 (11.6%) |
| 10 to 14 Years | 95 (20.1%) | 33 (8.0%) |
| 15 to 19 Years | 30 (6.3%) | 25 (6.0%) |
| 20 to 24 Years | 16 (3.4%) | 16 (3.9%) |
| 25 to 29 Years | 13 (2.8%) | 18 (4.3%) |
| 30 to 34 Years | 41 (8.7%) | 18 (4.3%) |
| 35 to 39 Years | 19 (4.0%) | 48 (11.6%) |
| 40 to 44 Years | 21 (4.4%) | 25 (6.0%) |
| 45 to 49 Years | 49 (10.4%) | 9 (2.2%) |
| 50 to 54 Years | 15 (3.2%) | 26 (6.3%) |
| 55 to 59 Years | 23 (4.9%) | 32 (7.7%) |
| 60 to 64 Years | 4 (0.9%) | 20 (4.8%) |
| 65 to 69 Years | 33 (7.0%) | 12 (2.9%) |
| 70 to 74 Years | 17 (3.6%) | 32 (7.7%) |
| 75 to 79 Years | 4 (0.9%) | 17 (4.1%) |
| 80 to 84 Years | 13 (2.8%) | 17 (4.1%) |
| 85 Years and over | 13 (2.8%) | 12 (2.9%) |
| Total | 473 (100.0%) | 414 (100.0%) |
Families and Households in Central Lake
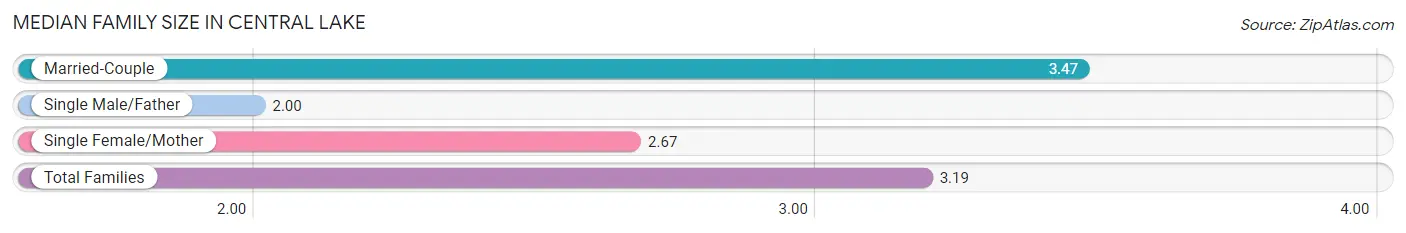
Median Family Size in Central Lake
The median family size in Central Lake is 3.19 persons per family, with married-couple families (172 | 72.3%) accounting for the largest median family size of 3.47 persons per family. On the other hand, single male/father families (18 | 7.6%) represent the smallest median family size with 2.00 persons per family.
| Family Type | # Families | Family Size |
| Married-Couple | 172 (72.3%) | 3.47 |
| Single Male/Father | 18 (7.6%) | 2.00 |
| Single Female/Mother | 48 (20.2%) | 2.67 |
| Total Families | 238 (100.0%) | 3.19 |
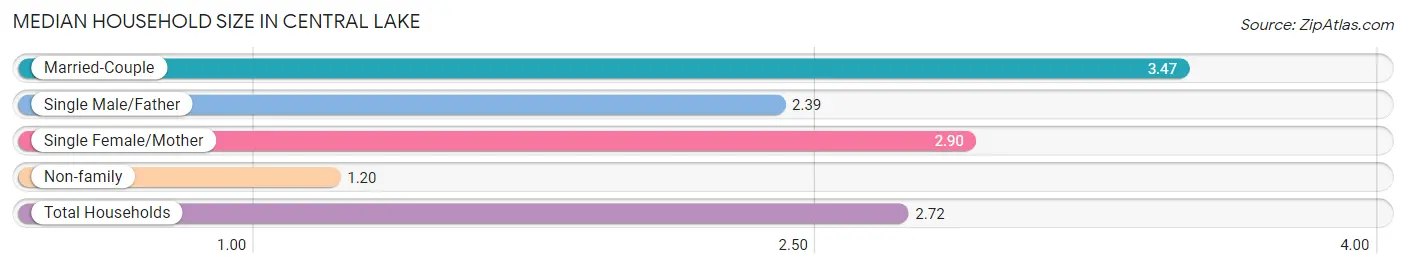
Median Household Size in Central Lake
The median household size in Central Lake is 2.72 persons per household, with married-couple households (172 | 53.2%) accounting for the largest median household size of 3.47 persons per household. non-family households (85 | 26.3%) represent the smallest median household size with 1.20 persons per household.
| Household Type | # Households | Household Size |
| Married-Couple | 172 (53.2%) | 3.47 |
| Single Male/Father | 18 (5.6%) | 2.39 |
| Single Female/Mother | 48 (14.9%) | 2.90 |
| Non-family | 85 (26.3%) | 1.20 |
| Total Households | 323 (100.0%) | 2.72 |
Household Size by Marriage Status in Central Lake
Out of a total of 323 households in Central Lake, 238 (73.7%) are family households, while 85 (26.3%) are nonfamily households. The most numerous type of family households are 2-person households, comprising 89, and the most common type of nonfamily households are 1-person households, comprising 64.
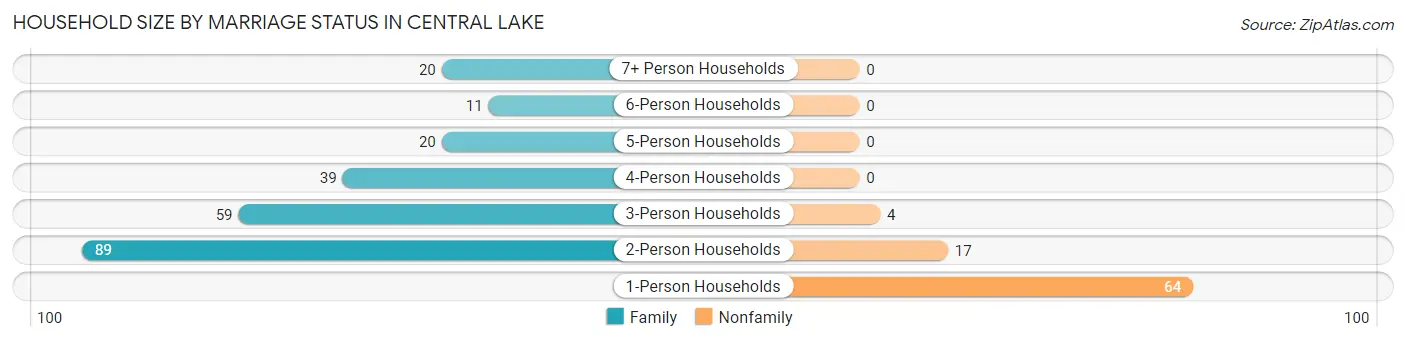
| Household Size | Family Households | Nonfamily Households |
| 1-Person Households | - | 64 (19.8%) |
| 2-Person Households | 89 (27.6%) | 17 (5.3%) |
| 3-Person Households | 59 (18.3%) | 4 (1.2%) |
| 4-Person Households | 39 (12.1%) | 0 (0.0%) |
| 5-Person Households | 20 (6.2%) | 0 (0.0%) |
| 6-Person Households | 11 (3.4%) | 0 (0.0%) |
| 7+ Person Households | 20 (6.2%) | 0 (0.0%) |
| Total | 238 (73.7%) | 85 (26.3%) |
Female Fertility in Central Lake
Fertility by Age in Central Lake

| Age Bracket | Women with Births | Births / 1,000 Women |
| 15 to 19 years | 0 (0.0%) | 0.0 |
| 20 to 34 years | 0 (0.0%) | 0.0 |
| 35 to 50 years | 0 (0.0%) | 0.0 |
| Total | 0 (0.0%) | 0.0 |
Fertility by Age by Marriage Status in Central Lake
| Age Bracket | Married | Unmarried |
| 15 to 19 years | 0 (0.0%) | 0 (0.0%) |
| 20 to 34 years | 0 (0.0%) | 0 (0.0%) |
| 35 to 50 years | 0 (0.0%) | 0 (0.0%) |
| Total | 0 (0.0%) | 0 (0.0%) |
Fertility by Education in Central Lake
| Educational Attainment | Women with Births | Births / 1,000 Women |
| Less than High School | 0 (0.0%) | 0.0 |
| High School Diploma | 0 (0.0%) | 0.0 |
| College or Associate's Degree | 0 (0.0%) | 0.0 |
| Bachelor's Degree | 0 (0.0%) | 0.0 |
| Graduate Degree | 0 (0.0%) | 0.0 |
| Total | 0 (0.0%) | 0.0 |
Fertility by Education by Marriage Status in Central Lake
| Educational Attainment | Married | Unmarried |
| Less than High School | 0 (0.0%) | 0 (0.0%) |
| High School Diploma | 0 (0.0%) | 0 (0.0%) |
| College or Associate's Degree | 0 (0.0%) | 0 (0.0%) |
| Bachelor's Degree | 0 (0.0%) | 0 (0.0%) |
| Graduate Degree | 0 (0.0%) | 0 (0.0%) |
| Total | 0 (0.0%) | 0 (0.0%) |
Employment Characteristics in Central Lake
Employment by Class of Employer in Central Lake
Among the 356 employed individuals in Central Lake, private company employees (245 | 68.8%), not-for-profit organizations (45 | 12.6%), and local government employees (25 | 7.0%) make up the most common classes of employment.
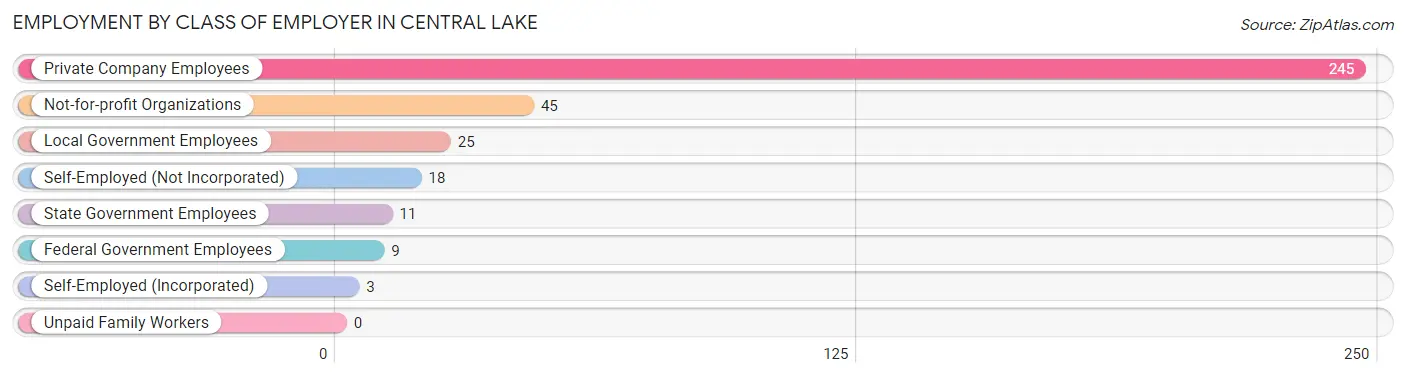
| Employer Class | # Employees | % Employees |
| Private Company Employees | 245 | 68.8% |
| Self-Employed (Incorporated) | 3 | 0.8% |
| Self-Employed (Not Incorporated) | 18 | 5.1% |
| Not-for-profit Organizations | 45 | 12.6% |
| Local Government Employees | 25 | 7.0% |
| State Government Employees | 11 | 3.1% |
| Federal Government Employees | 9 | 2.5% |
| Unpaid Family Workers | 0 | 0.0% |
| Total | 356 | 100.0% |
Employment Status by Age in Central Lake
According to the labor force statistics for Central Lake, out of the total population over 16 years of age (629), 60.6% or 381 individuals are in the labor force, with 3.1% or 12 of them unemployed. The age group with the highest labor force participation rate is 35 to 44 years, with 95.6% or 108 individuals in the labor force. Within the labor force, the 25 to 29 years age range has the highest percentage of unemployed individuals, with 24.1% or 7 of them being unemployed.
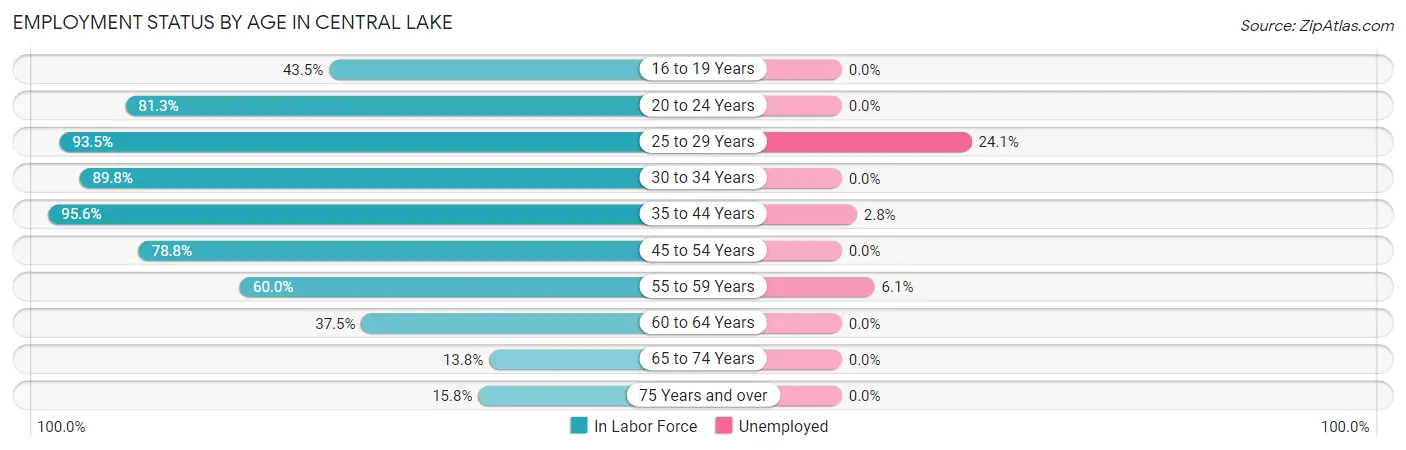
| Age Bracket | In Labor Force | Unemployed |
| 16 to 19 Years | 20 (43.5%) | 0 (0.0%) |
| 20 to 24 Years | 26 (81.3%) | 0 (0.0%) |
| 25 to 29 Years | 29 (93.5%) | 7 (24.1%) |
| 30 to 34 Years | 53 (89.8%) | 0 (0.0%) |
| 35 to 44 Years | 108 (95.6%) | 3 (2.8%) |
| 45 to 54 Years | 78 (78.8%) | 0 (0.0%) |
| 55 to 59 Years | 33 (60.0%) | 2 (6.1%) |
| 60 to 64 Years | 9 (37.5%) | 0 (0.0%) |
| 65 to 74 Years | 13 (13.8%) | 0 (0.0%) |
| 75 Years and over | 12 (15.8%) | 0 (0.0%) |
| Total | 381 (60.6%) | 12 (3.1%) |
Employment Status by Educational Attainment in Central Lake
According to labor force statistics for Central Lake, 81.4% of individuals (310) out of the total population between 25 and 64 years of age (381) are in the labor force, with 3.9% or 12 of them being unemployed. The group with the highest labor force participation rate are those with the educational attainment of college / associate degree, with 95.0% or 96 individuals in the labor force. Within the labor force, individuals with college / associate degree education have the highest percentage of unemployment, with 12.5% or 12 of them being unemployed.
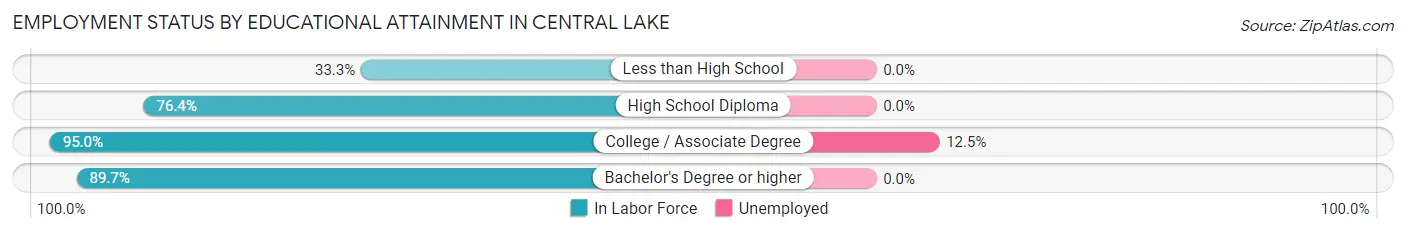
| Educational Attainment | In Labor Force | Unemployed |
| Less than High School | 8 (33.3%) | 0 (0.0%) |
| High School Diploma | 136 (76.4%) | 0 (0.0%) |
| College / Associate Degree | 96 (95.0%) | 13 (12.5%) |
| Bachelor's Degree or higher | 70 (89.7%) | 0 (0.0%) |
| Total | 310 (81.4%) | 15 (3.9%) |
Employment Occupations by Sex in Central Lake
Management, Business, Science and Arts Occupations
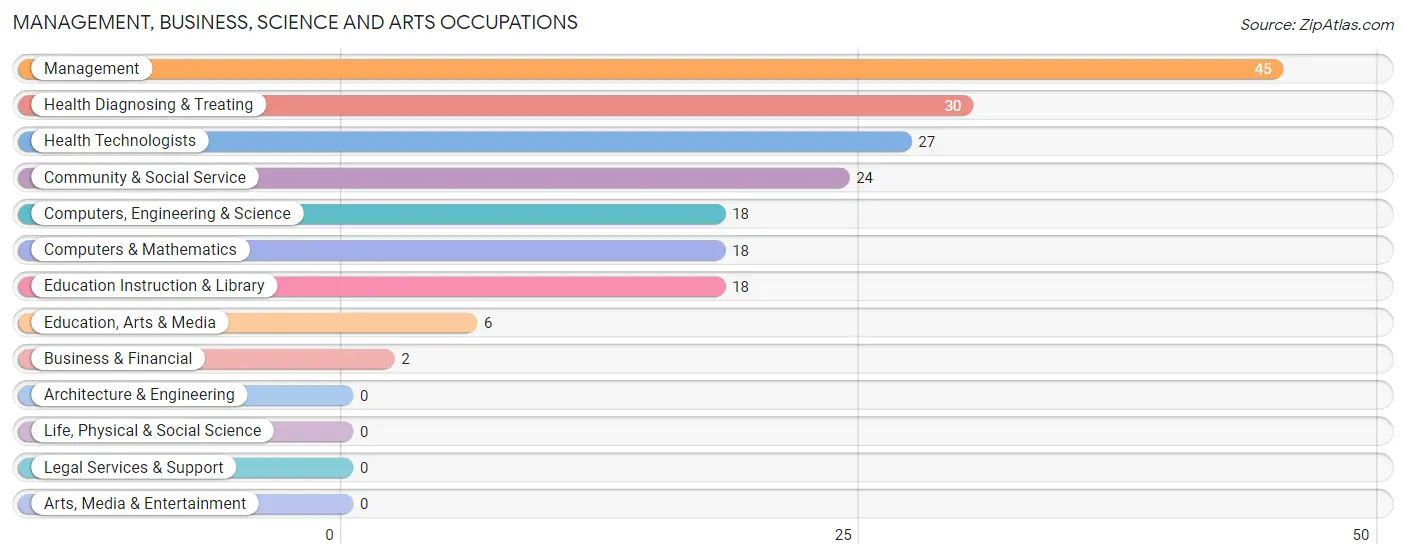
The most common Management, Business, Science and Arts occupations in Central Lake are Management (45 | 12.2%), Health Diagnosing & Treating (30 | 8.1%), Health Technologists (27 | 7.3%), Community & Social Service (24 | 6.5%), and Computers, Engineering & Science (18 | 4.9%).
Management, Business, Science and Arts Occupations by Sex
Within the Management, Business, Science and Arts occupations in Central Lake, the most male-oriented occupations are Computers, Engineering & Science (100.0%), Computers & Mathematics (100.0%), and Health Technologists (55.6%), while the most female-oriented occupations are Business & Financial (100.0%), Management (80.0%), and Education Instruction & Library (72.2%).
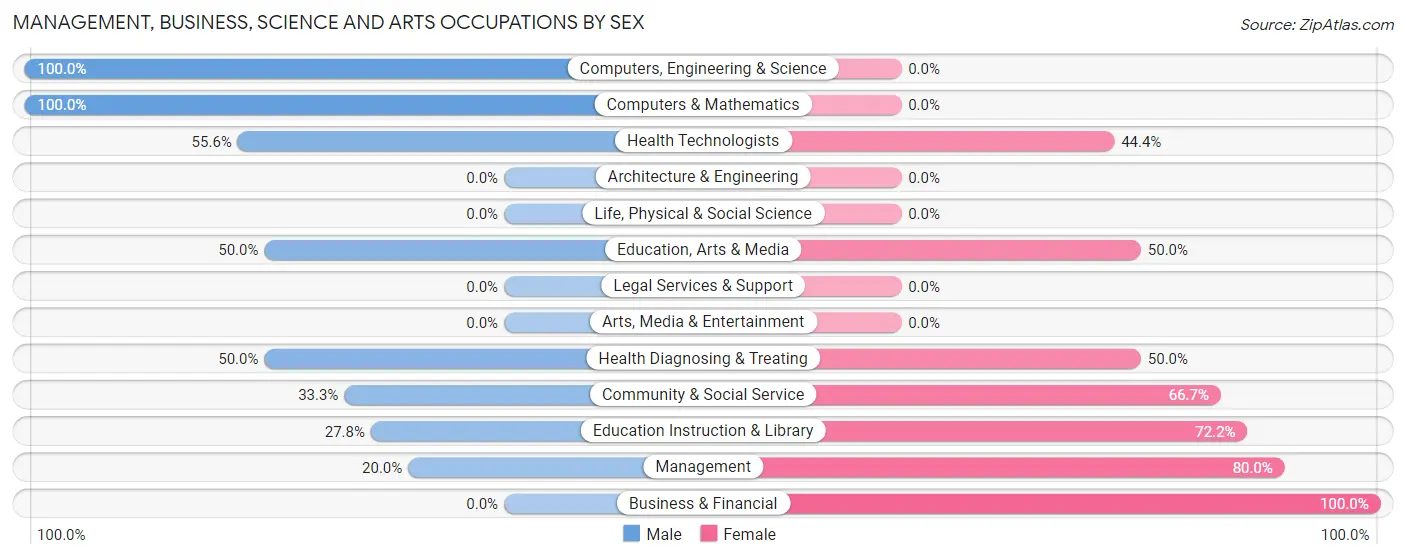
| Occupation | Male | Female |
| Management | 9 (20.0%) | 36 (80.0%) |
| Business & Financial | 0 (0.0%) | 2 (100.0%) |
| Computers, Engineering & Science | 18 (100.0%) | 0 (0.0%) |
| Computers & Mathematics | 18 (100.0%) | 0 (0.0%) |
| Architecture & Engineering | 0 (0.0%) | 0 (0.0%) |
| Life, Physical & Social Science | 0 (0.0%) | 0 (0.0%) |
| Community & Social Service | 8 (33.3%) | 16 (66.7%) |
| Education, Arts & Media | 3 (50.0%) | 3 (50.0%) |
| Legal Services & Support | 0 (0.0%) | 0 (0.0%) |
| Education Instruction & Library | 5 (27.8%) | 13 (72.2%) |
| Arts, Media & Entertainment | 0 (0.0%) | 0 (0.0%) |
| Health Diagnosing & Treating | 15 (50.0%) | 15 (50.0%) |
| Health Technologists | 15 (55.6%) | 12 (44.4%) |
| Total (Category) | 50 (42.0%) | 69 (58.0%) |
| Total (Overall) | 187 (50.7%) | 182 (49.3%) |
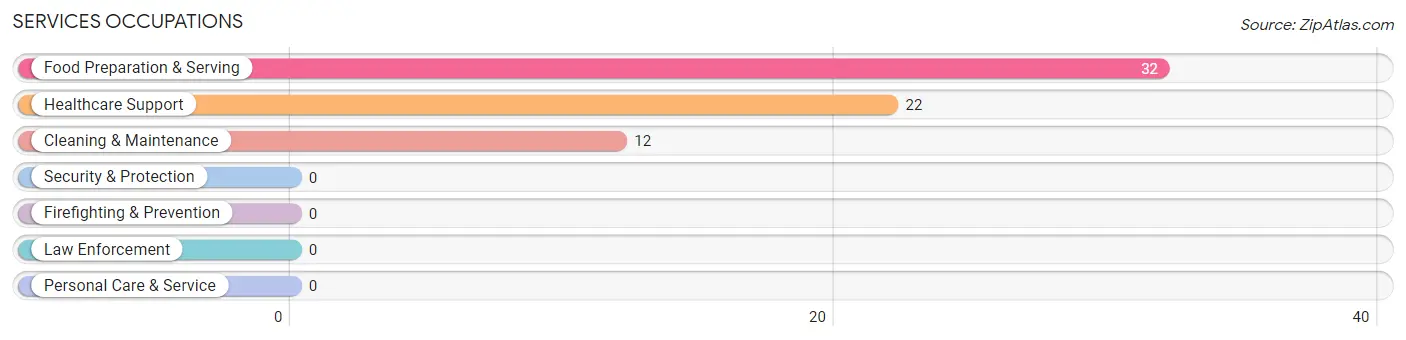
Services Occupations
The most common Services occupations in Central Lake are Food Preparation & Serving (32 | 8.7%), Healthcare Support (22 | 6.0%), and Cleaning & Maintenance (12 | 3.3%).
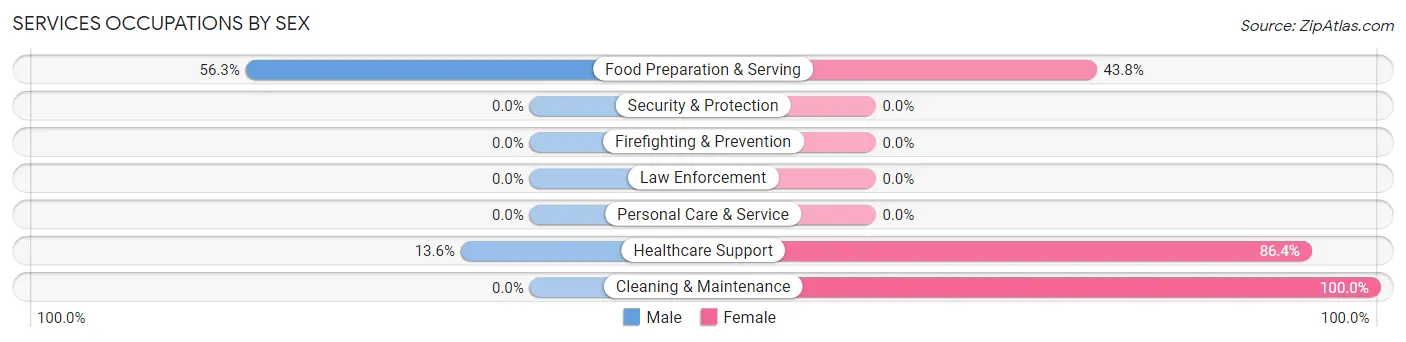
Services Occupations by Sex
Within the Services occupations in Central Lake, the most male-oriented occupations are Food Preparation & Serving (56.2%), and Healthcare Support (13.6%), while the most female-oriented occupations are Cleaning & Maintenance (100.0%), Healthcare Support (86.4%), and Food Preparation & Serving (43.8%).
| Occupation | Male | Female |
| Healthcare Support | 3 (13.6%) | 19 (86.4%) |
| Security & Protection | 0 (0.0%) | 0 (0.0%) |
| Firefighting & Prevention | 0 (0.0%) | 0 (0.0%) |
| Law Enforcement | 0 (0.0%) | 0 (0.0%) |
| Food Preparation & Serving | 18 (56.2%) | 14 (43.8%) |
| Cleaning & Maintenance | 0 (0.0%) | 12 (100.0%) |
| Personal Care & Service | 0 (0.0%) | 0 (0.0%) |
| Total (Category) | 21 (31.8%) | 45 (68.2%) |
| Total (Overall) | 187 (50.7%) | 182 (49.3%) |
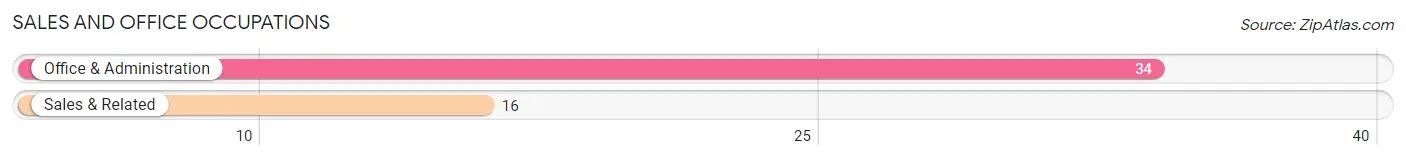
Sales and Office Occupations
The most common Sales and Office occupations in Central Lake are Office & Administration (34 | 9.2%), and Sales & Related (16 | 4.3%).
Sales and Office Occupations by Sex
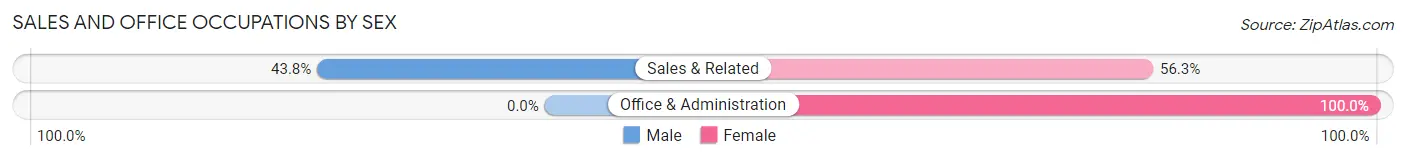
| Occupation | Male | Female |
| Sales & Related | 7 (43.8%) | 9 (56.2%) |
| Office & Administration | 0 (0.0%) | 34 (100.0%) |
| Total (Category) | 7 (14.0%) | 43 (86.0%) |
| Total (Overall) | 187 (50.7%) | 182 (49.3%) |
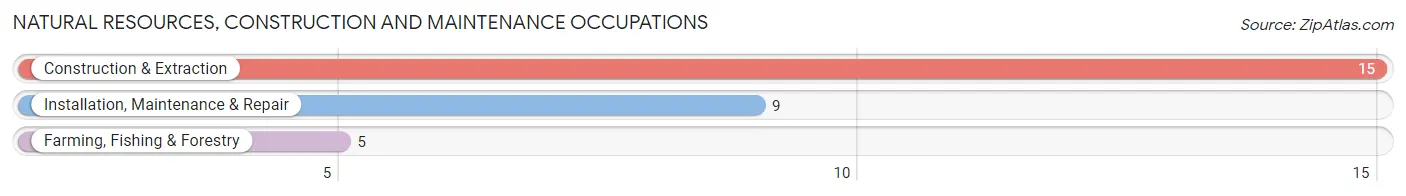
Natural Resources, Construction and Maintenance Occupations
The most common Natural Resources, Construction and Maintenance occupations in Central Lake are Construction & Extraction (15 | 4.1%), Installation, Maintenance & Repair (9 | 2.4%), and Farming, Fishing & Forestry (5 | 1.4%).
Natural Resources, Construction and Maintenance Occupations by Sex
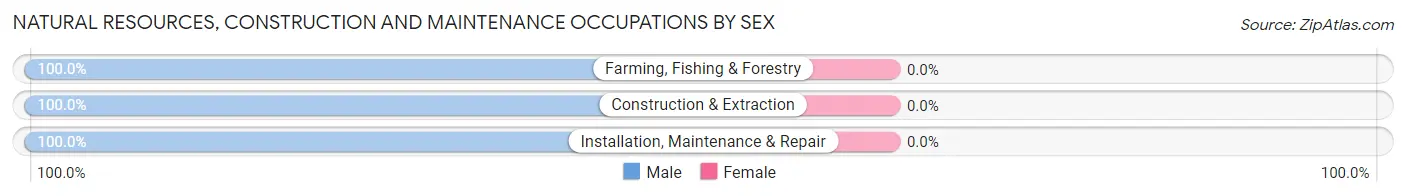
| Occupation | Male | Female |
| Farming, Fishing & Forestry | 5 (100.0%) | 0 (0.0%) |
| Construction & Extraction | 15 (100.0%) | 0 (0.0%) |
| Installation, Maintenance & Repair | 9 (100.0%) | 0 (0.0%) |
| Total (Category) | 29 (100.0%) | 0 (0.0%) |
| Total (Overall) | 187 (50.7%) | 182 (49.3%) |
Production, Transportation and Moving Occupations
The most common Production, Transportation and Moving occupations in Central Lake are Production (89 | 24.1%), Transportation (11 | 3.0%), and Material Moving (5 | 1.4%).
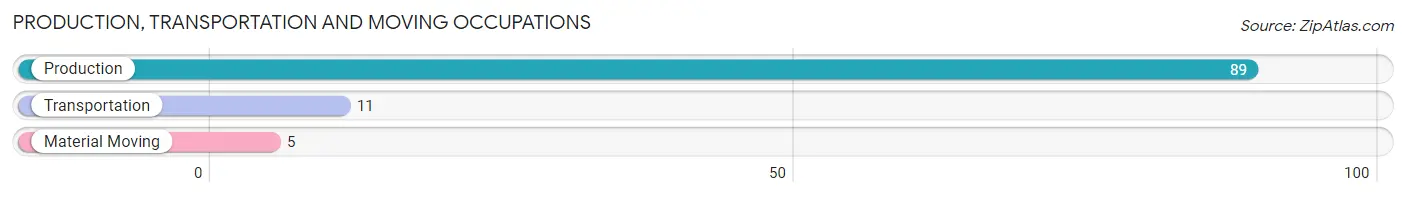
Production, Transportation and Moving Occupations by Sex
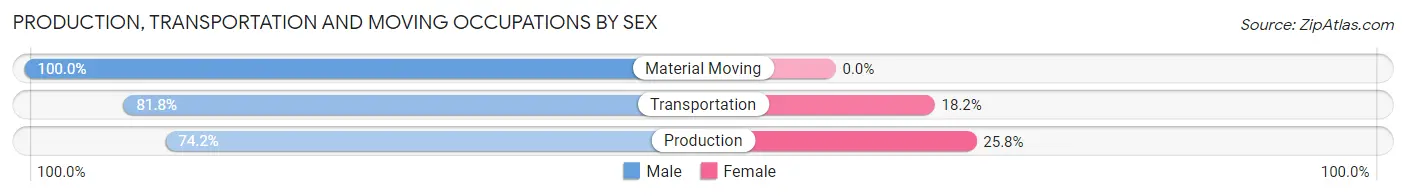
| Occupation | Male | Female |
| Production | 66 (74.2%) | 23 (25.8%) |
| Transportation | 9 (81.8%) | 2 (18.2%) |
| Material Moving | 5 (100.0%) | 0 (0.0%) |
| Total (Category) | 80 (76.2%) | 25 (23.8%) |
| Total (Overall) | 187 (50.7%) | 182 (49.3%) |
Employment Industries by Sex in Central Lake
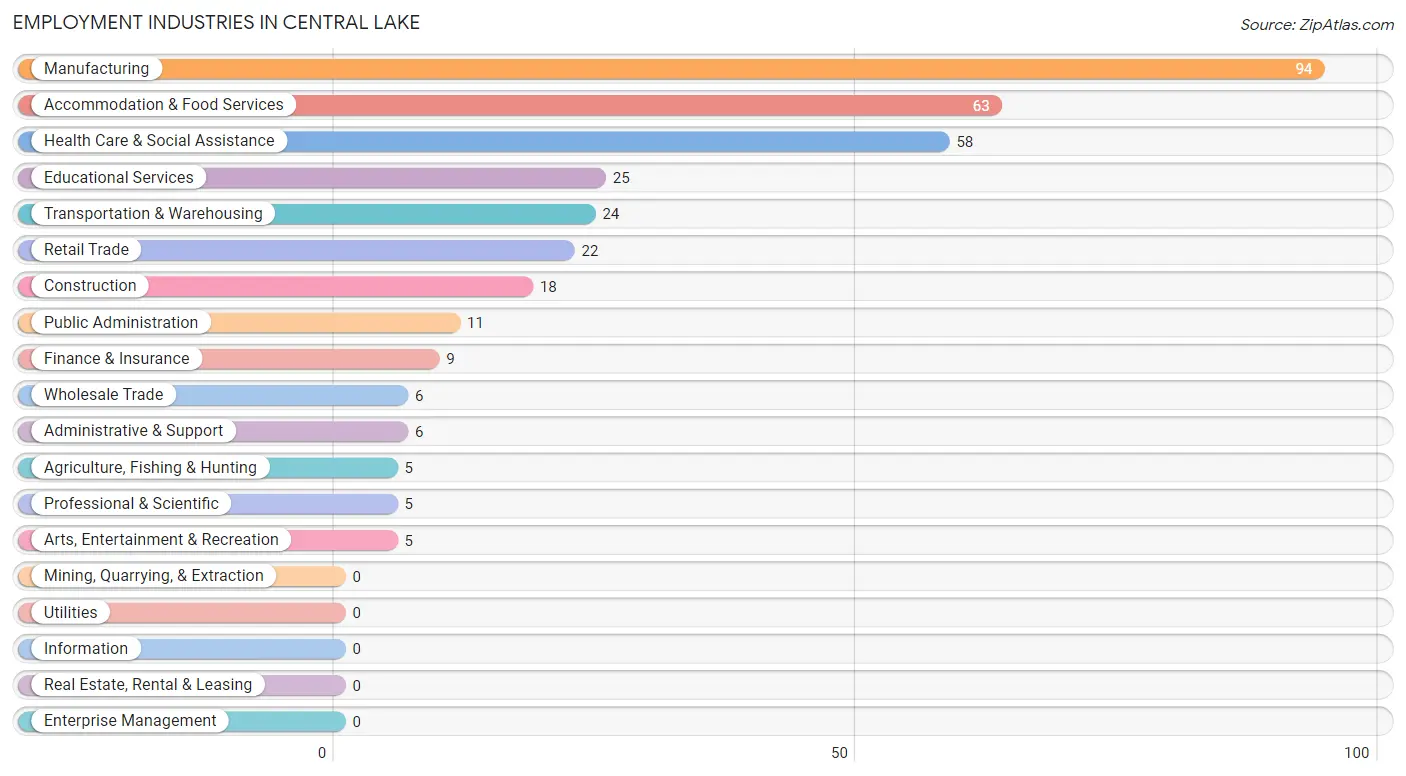
Employment Industries in Central Lake
The major employment industries in Central Lake include Manufacturing (94 | 25.5%), Accommodation & Food Services (63 | 17.1%), Health Care & Social Assistance (58 | 15.7%), Educational Services (25 | 6.8%), and Transportation & Warehousing (24 | 6.5%).
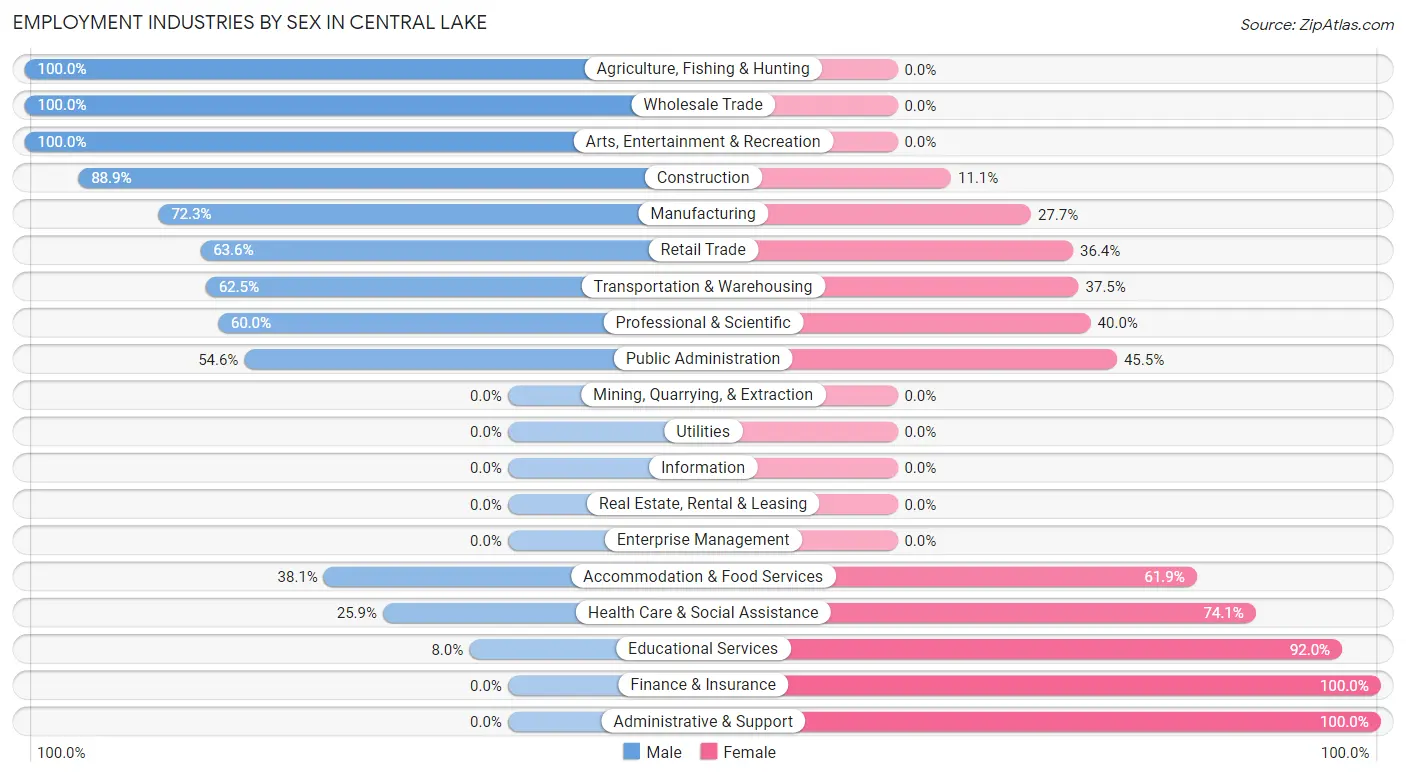
Employment Industries by Sex in Central Lake
The Central Lake industries that see more men than women are Agriculture, Fishing & Hunting (100.0%), Wholesale Trade (100.0%), and Arts, Entertainment & Recreation (100.0%), whereas the industries that tend to have a higher number of women are Finance & Insurance (100.0%), Administrative & Support (100.0%), and Educational Services (92.0%).
| Industry | Male | Female |
| Agriculture, Fishing & Hunting | 5 (100.0%) | 0 (0.0%) |
| Mining, Quarrying, & Extraction | 0 (0.0%) | 0 (0.0%) |
| Construction | 16 (88.9%) | 2 (11.1%) |
| Manufacturing | 68 (72.3%) | 26 (27.7%) |
| Wholesale Trade | 6 (100.0%) | 0 (0.0%) |
| Retail Trade | 14 (63.6%) | 8 (36.4%) |
| Transportation & Warehousing | 15 (62.5%) | 9 (37.5%) |
| Utilities | 0 (0.0%) | 0 (0.0%) |
| Information | 0 (0.0%) | 0 (0.0%) |
| Finance & Insurance | 0 (0.0%) | 9 (100.0%) |
| Real Estate, Rental & Leasing | 0 (0.0%) | 0 (0.0%) |
| Professional & Scientific | 3 (60.0%) | 2 (40.0%) |
| Enterprise Management | 0 (0.0%) | 0 (0.0%) |
| Administrative & Support | 0 (0.0%) | 6 (100.0%) |
| Educational Services | 2 (8.0%) | 23 (92.0%) |
| Health Care & Social Assistance | 15 (25.9%) | 43 (74.1%) |
| Arts, Entertainment & Recreation | 5 (100.0%) | 0 (0.0%) |
| Accommodation & Food Services | 24 (38.1%) | 39 (61.9%) |
| Public Administration | 6 (54.5%) | 5 (45.5%) |
| Total | 187 (50.7%) | 182 (49.3%) |
Education in Central Lake
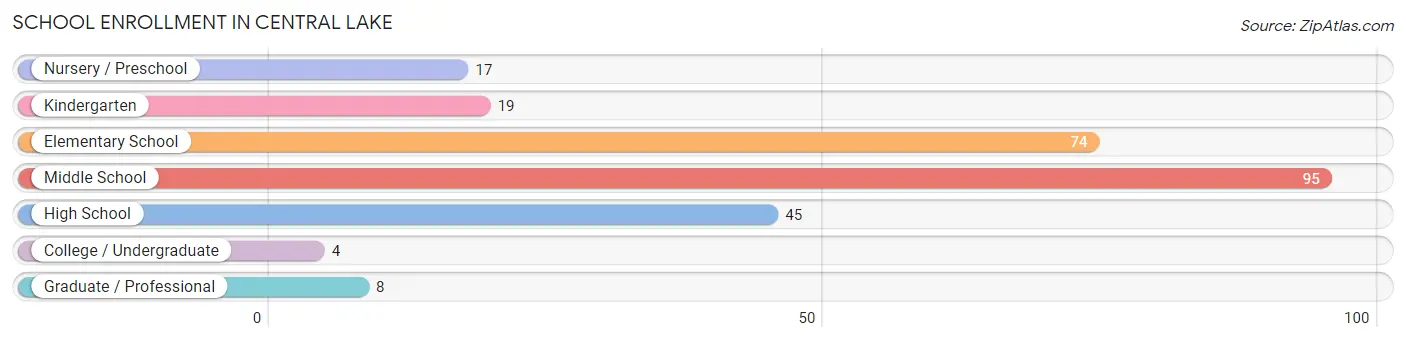
School Enrollment in Central Lake
The most common levels of schooling among the 262 students in Central Lake are middle school (95 | 36.3%), elementary school (74 | 28.2%), and high school (45 | 17.2%).
| School Level | # Students | % Students |
| Nursery / Preschool | 17 | 6.5% |
| Kindergarten | 19 | 7.2% |
| Elementary School | 74 | 28.2% |
| Middle School | 95 | 36.3% |
| High School | 45 | 17.2% |
| College / Undergraduate | 4 | 1.5% |
| Graduate / Professional | 8 | 3.0% |
| Total | 262 | 100.0% |
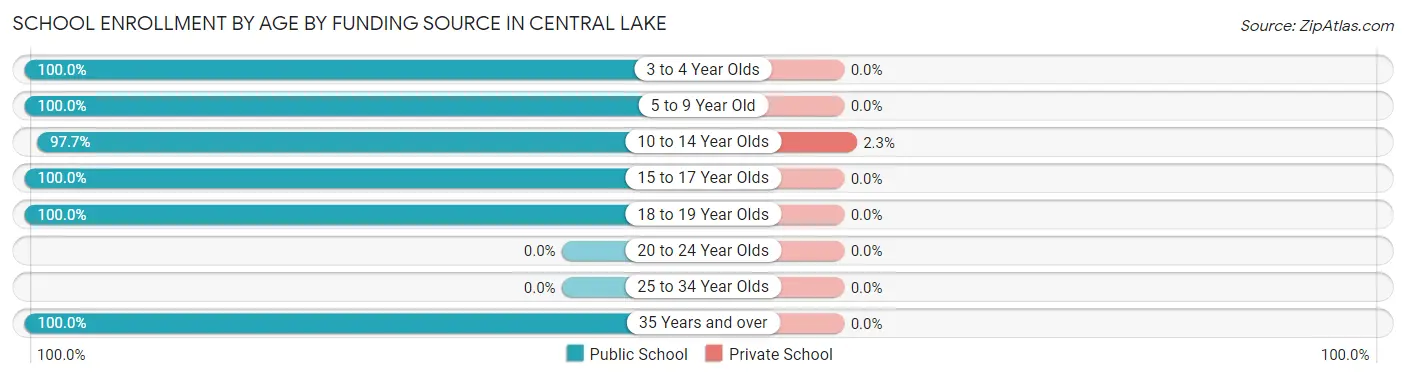
School Enrollment by Age by Funding Source in Central Lake
Out of a total of 262 students who are enrolled in schools in Central Lake, 3 (1.1%) attend a private institution, while the remaining 259 (98.9%) are enrolled in public schools. The age group of 10 to 14 year olds has the highest likelihood of being enrolled in private schools, with 3 (2.3% in the age bracket) enrolled. Conversely, the age group of 3 to 4 year olds has the lowest likelihood of being enrolled in a private school, with 17 (100.0% in the age bracket) attending a public institution.
| Age Bracket | Public School | Private School |
| 3 to 4 Year Olds | 17 (100.0%) | 0 (0.0%) |
| 5 to 9 Year Old | 60 (100.0%) | 0 (0.0%) |
| 10 to 14 Year Olds | 125 (97.7%) | 3 (2.3%) |
| 15 to 17 Year Olds | 33 (100.0%) | 0 (0.0%) |
| 18 to 19 Year Olds | 16 (100.0%) | 0 (0.0%) |
| 20 to 24 Year Olds | 0 (0.0%) | 0 (0.0%) |
| 25 to 34 Year Olds | 0 (0.0%) | 0 (0.0%) |
| 35 Years and over | 8 (100.0%) | 0 (0.0%) |
| Total | 259 (98.9%) | 3 (1.1%) |
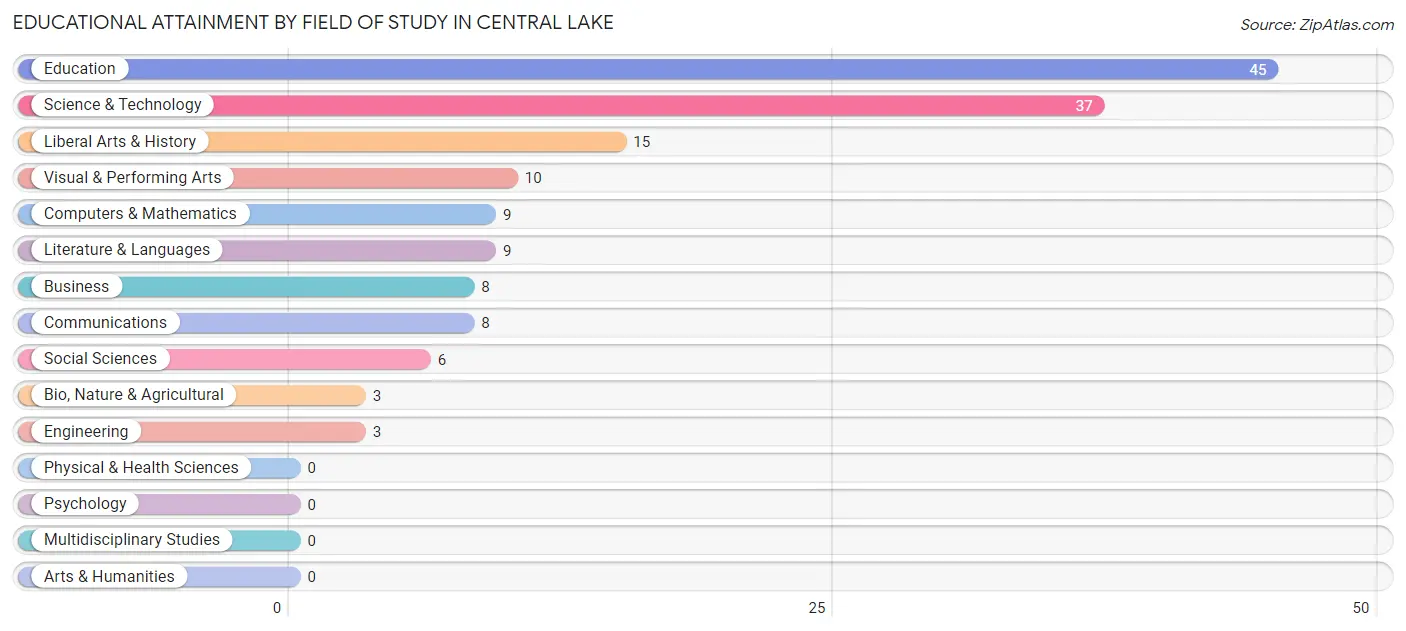
Educational Attainment by Field of Study in Central Lake
Education (45 | 29.4%), science & technology (37 | 24.2%), liberal arts & history (15 | 9.8%), visual & performing arts (10 | 6.5%), and computers & mathematics (9 | 5.9%) are the most common fields of study among 153 individuals in Central Lake who have obtained a bachelor's degree or higher.
| Field of Study | # Graduates | % Graduates |
| Computers & Mathematics | 9 | 5.9% |
| Bio, Nature & Agricultural | 3 | 2.0% |
| Physical & Health Sciences | 0 | 0.0% |
| Psychology | 0 | 0.0% |
| Social Sciences | 6 | 3.9% |
| Engineering | 3 | 2.0% |
| Multidisciplinary Studies | 0 | 0.0% |
| Science & Technology | 37 | 24.2% |
| Business | 8 | 5.2% |
| Education | 45 | 29.4% |
| Literature & Languages | 9 | 5.9% |
| Liberal Arts & History | 15 | 9.8% |
| Visual & Performing Arts | 10 | 6.5% |
| Communications | 8 | 5.2% |
| Arts & Humanities | 0 | 0.0% |
| Total | 153 | 100.0% |
Transportation & Commute in Central Lake
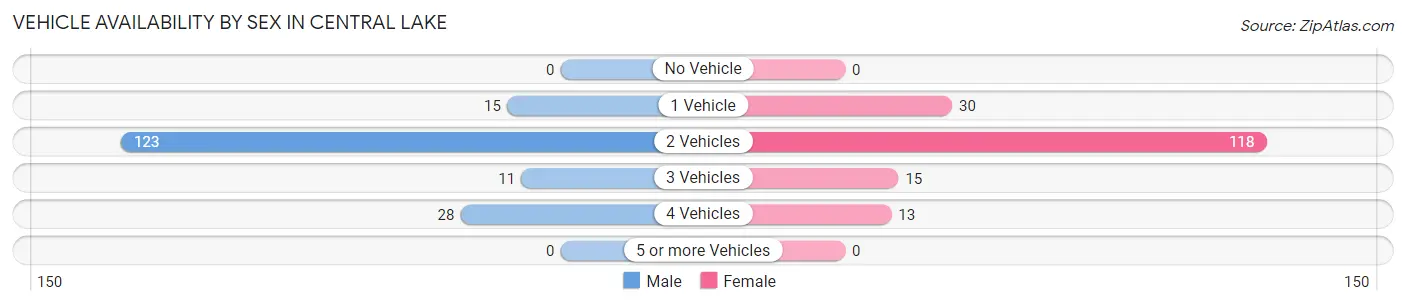
Vehicle Availability by Sex in Central Lake
The most prevalent vehicle ownership categories in Central Lake are males with 2 vehicles (123, accounting for 69.5%) and females with 2 vehicles (118, making up 69.9%).
| Vehicles Available | Male | Female |
| No Vehicle | 0 (0.0%) | 0 (0.0%) |
| 1 Vehicle | 15 (8.5%) | 30 (17.1%) |
| 2 Vehicles | 123 (69.5%) | 118 (67.0%) |
| 3 Vehicles | 11 (6.2%) | 15 (8.5%) |
| 4 Vehicles | 28 (15.8%) | 13 (7.4%) |
| 5 or more Vehicles | 0 (0.0%) | 0 (0.0%) |
| Total | 177 (100.0%) | 176 (100.0%) |
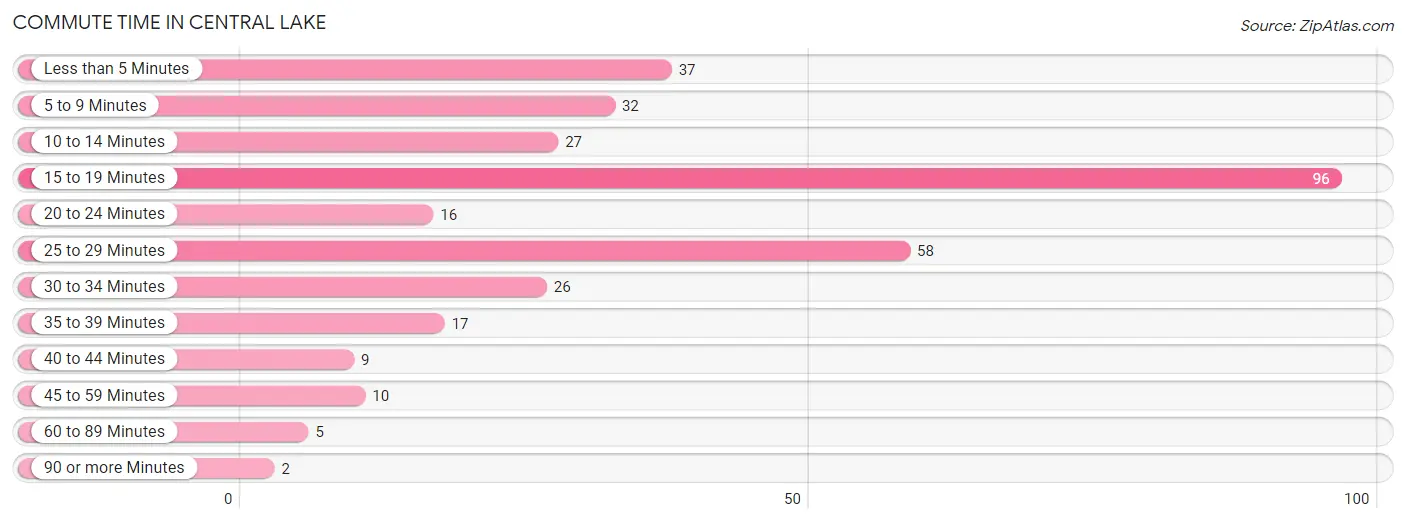
Commute Time in Central Lake
The most frequently occuring commute durations in Central Lake are 15 to 19 minutes (96 commuters, 28.7%), 25 to 29 minutes (58 commuters, 17.3%), and less than 5 minutes (37 commuters, 11.0%).
| Commute Time | # Commuters | % Commuters |
| Less than 5 Minutes | 37 | 11.0% |
| 5 to 9 Minutes | 32 | 9.6% |
| 10 to 14 Minutes | 27 | 8.1% |
| 15 to 19 Minutes | 96 | 28.7% |
| 20 to 24 Minutes | 16 | 4.8% |
| 25 to 29 Minutes | 58 | 17.3% |
| 30 to 34 Minutes | 26 | 7.8% |
| 35 to 39 Minutes | 17 | 5.1% |
| 40 to 44 Minutes | 9 | 2.7% |
| 45 to 59 Minutes | 10 | 3.0% |
| 60 to 89 Minutes | 5 | 1.5% |
| 90 or more Minutes | 2 | 0.6% |
Commute Time by Sex in Central Lake
The most common commute times in Central Lake are 15 to 19 minutes (58 commuters, 34.5%) for males and 15 to 19 minutes (38 commuters, 22.8%) for females.
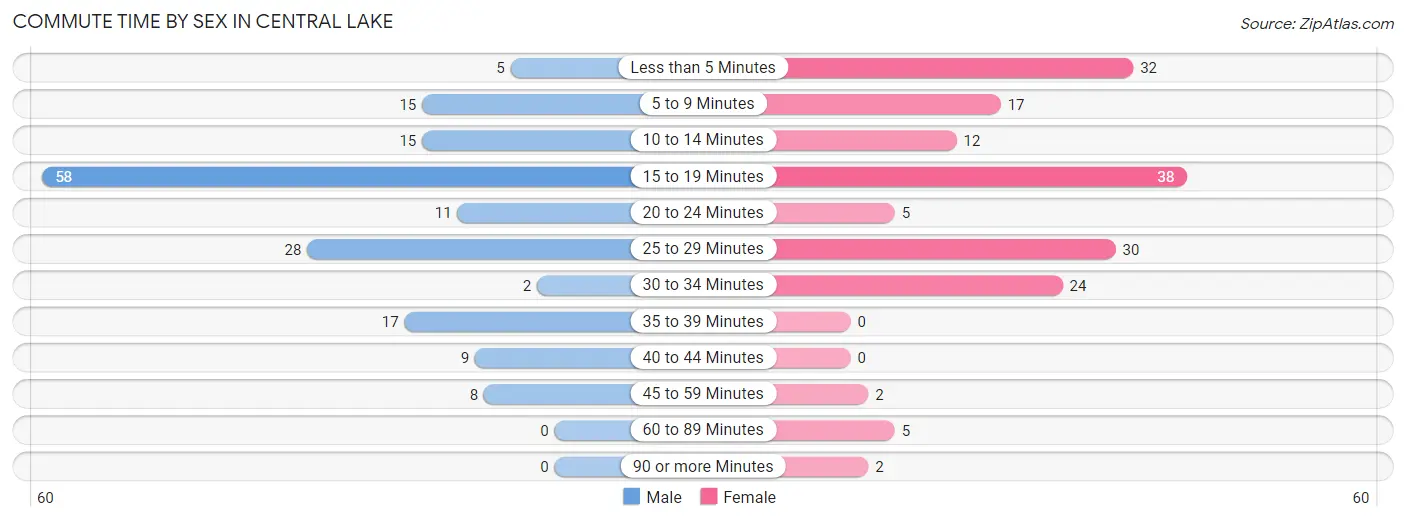
| Commute Time | Male | Female |
| Less than 5 Minutes | 5 (3.0%) | 32 (19.2%) |
| 5 to 9 Minutes | 15 (8.9%) | 17 (10.2%) |
| 10 to 14 Minutes | 15 (8.9%) | 12 (7.2%) |
| 15 to 19 Minutes | 58 (34.5%) | 38 (22.8%) |
| 20 to 24 Minutes | 11 (6.6%) | 5 (3.0%) |
| 25 to 29 Minutes | 28 (16.7%) | 30 (18.0%) |
| 30 to 34 Minutes | 2 (1.2%) | 24 (14.4%) |
| 35 to 39 Minutes | 17 (10.1%) | 0 (0.0%) |
| 40 to 44 Minutes | 9 (5.4%) | 0 (0.0%) |
| 45 to 59 Minutes | 8 (4.8%) | 2 (1.2%) |
| 60 to 89 Minutes | 0 (0.0%) | 5 (3.0%) |
| 90 or more Minutes | 0 (0.0%) | 2 (1.2%) |
Time of Departure to Work by Sex in Central Lake
The most frequent times of departure to work in Central Lake are 4:00 PM to 11:59 PM (36, 21.4%) for males and 7:00 AM to 7:29 AM (35, 21.0%) for females.
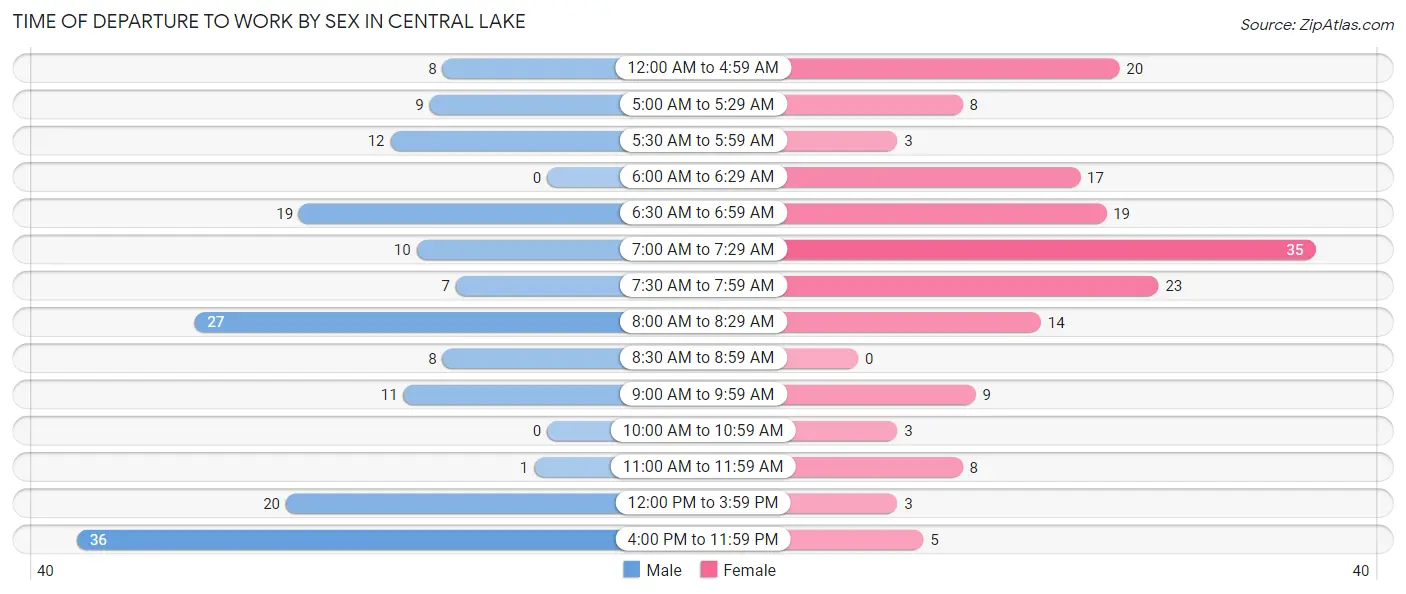
| Time of Departure | Male | Female |
| 12:00 AM to 4:59 AM | 8 (4.8%) | 20 (12.0%) |
| 5:00 AM to 5:29 AM | 9 (5.4%) | 8 (4.8%) |
| 5:30 AM to 5:59 AM | 12 (7.1%) | 3 (1.8%) |
| 6:00 AM to 6:29 AM | 0 (0.0%) | 17 (10.2%) |
| 6:30 AM to 6:59 AM | 19 (11.3%) | 19 (11.4%) |
| 7:00 AM to 7:29 AM | 10 (5.9%) | 35 (21.0%) |
| 7:30 AM to 7:59 AM | 7 (4.2%) | 23 (13.8%) |
| 8:00 AM to 8:29 AM | 27 (16.1%) | 14 (8.4%) |
| 8:30 AM to 8:59 AM | 8 (4.8%) | 0 (0.0%) |
| 9:00 AM to 9:59 AM | 11 (6.6%) | 9 (5.4%) |
| 10:00 AM to 10:59 AM | 0 (0.0%) | 3 (1.8%) |
| 11:00 AM to 11:59 AM | 1 (0.6%) | 8 (4.8%) |
| 12:00 PM to 3:59 PM | 20 (11.9%) | 3 (1.8%) |
| 4:00 PM to 11:59 PM | 36 (21.4%) | 5 (3.0%) |
| Total | 168 (100.0%) | 167 (100.0%) |
Housing Occupancy in Central Lake
Occupancy by Ownership in Central Lake
Of the total 323 dwellings in Central Lake, owner-occupied units account for 261 (80.8%), while renter-occupied units make up 62 (19.2%).
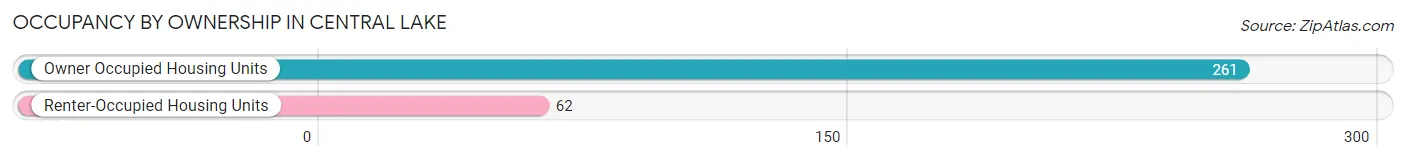
| Occupancy | # Housing Units | % Housing Units |
| Owner Occupied Housing Units | 261 | 80.8% |
| Renter-Occupied Housing Units | 62 | 19.2% |
| Total Occupied Housing Units | 323 | 100.0% |
Occupancy by Household Size in Central Lake
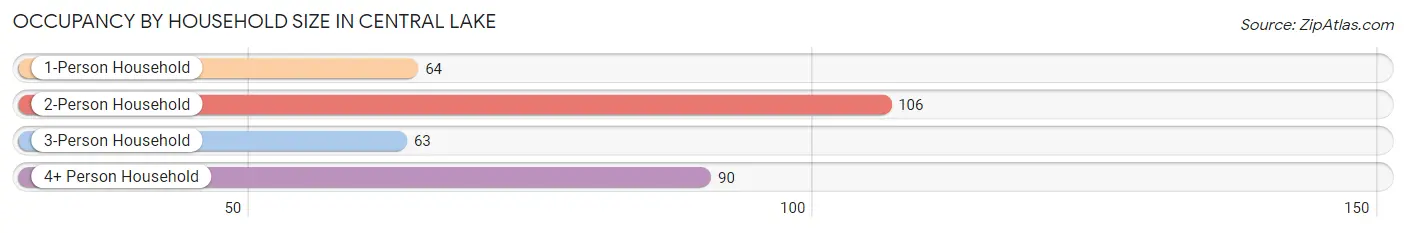
| Household Size | # Housing Units | % Housing Units |
| 1-Person Household | 64 | 19.8% |
| 2-Person Household | 106 | 32.8% |
| 3-Person Household | 63 | 19.5% |
| 4+ Person Household | 90 | 27.9% |
| Total Housing Units | 323 | 100.0% |
Occupancy by Ownership by Household Size in Central Lake
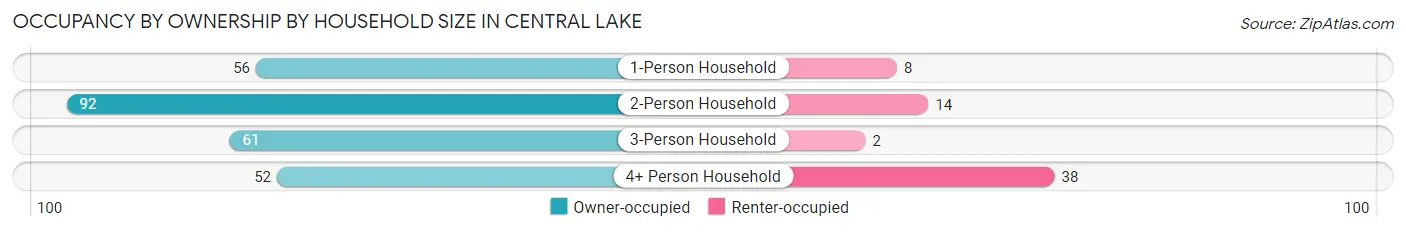
| Household Size | Owner-occupied | Renter-occupied |
| 1-Person Household | 56 (87.5%) | 8 (12.5%) |
| 2-Person Household | 92 (86.8%) | 14 (13.2%) |
| 3-Person Household | 61 (96.8%) | 2 (3.2%) |
| 4+ Person Household | 52 (57.8%) | 38 (42.2%) |
| Total Housing Units | 261 (80.8%) | 62 (19.2%) |
Occupancy by Educational Attainment in Central Lake
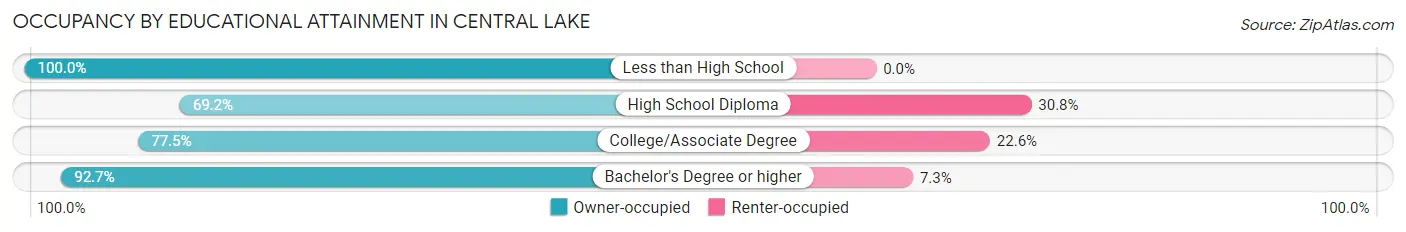
| Household Size | Owner-occupied | Renter-occupied |
| Less than High School | 21 (100.0%) | 0 (0.0%) |
| High School Diploma | 72 (69.2%) | 32 (30.8%) |
| College/Associate Degree | 79 (77.4%) | 23 (22.6%) |
| Bachelor's Degree or higher | 89 (92.7%) | 7 (7.3%) |
Occupancy by Age of Householder in Central Lake

| Age Bracket | # Households | % Households |
| Under 35 Years | 32 | 9.9% |
| 35 to 44 Years | 86 | 26.6% |
| 45 to 54 Years | 45 | 13.9% |
| 55 to 64 Years | 48 | 14.9% |
| 65 to 74 Years | 63 | 19.5% |
| 75 to 84 Years | 34 | 10.5% |
| 85 Years and Over | 15 | 4.6% |
| Total | 323 | 100.0% |
Housing Finances in Central Lake
Median Income by Occupancy in Central Lake
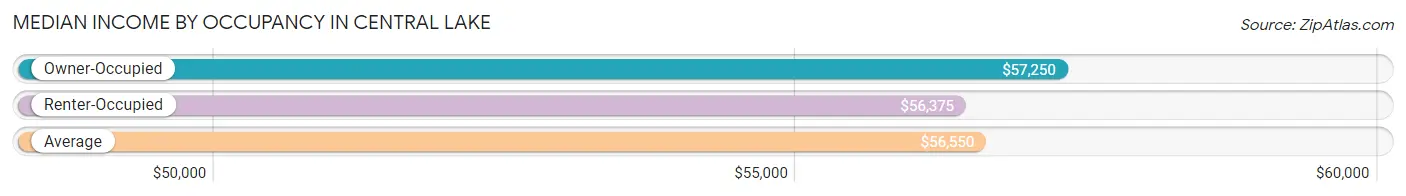
| Occupancy Type | # Households | Median Income |
| Owner-Occupied | 261 (80.8%) | $57,250 |
| Renter-Occupied | 62 (19.2%) | $56,375 |
| Average | 323 (100.0%) | $56,550 |
Occupancy by Householder Income Bracket in Central Lake
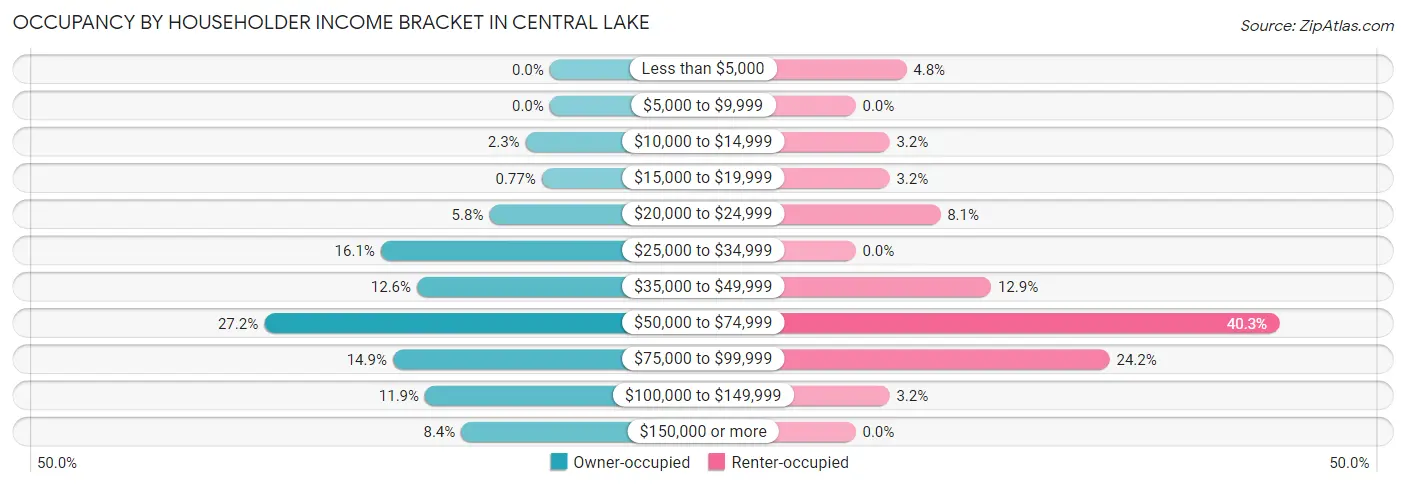
| Income Bracket | Owner-occupied | Renter-occupied |
| Less than $5,000 | 0 (0.0%) | 3 (4.8%) |
| $5,000 to $9,999 | 0 (0.0%) | 0 (0.0%) |
| $10,000 to $14,999 | 6 (2.3%) | 2 (3.2%) |
| $15,000 to $19,999 | 2 (0.8%) | 2 (3.2%) |
| $20,000 to $24,999 | 15 (5.8%) | 5 (8.1%) |
| $25,000 to $34,999 | 42 (16.1%) | 0 (0.0%) |
| $35,000 to $49,999 | 33 (12.6%) | 8 (12.9%) |
| $50,000 to $74,999 | 71 (27.2%) | 25 (40.3%) |
| $75,000 to $99,999 | 39 (14.9%) | 15 (24.2%) |
| $100,000 to $149,999 | 31 (11.9%) | 2 (3.2%) |
| $150,000 or more | 22 (8.4%) | 0 (0.0%) |
| Total | 261 (100.0%) | 62 (100.0%) |
Monthly Housing Cost Tiers in Central Lake
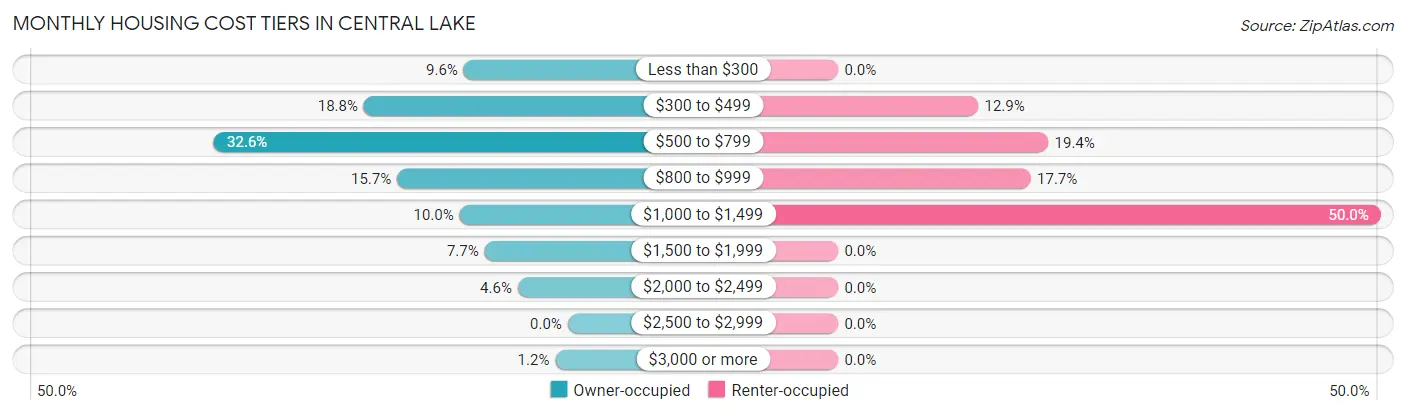
| Monthly Cost | Owner-occupied | Renter-occupied |
| Less than $300 | 25 (9.6%) | 0 (0.0%) |
| $300 to $499 | 49 (18.8%) | 8 (12.9%) |
| $500 to $799 | 85 (32.6%) | 12 (19.4%) |
| $800 to $999 | 41 (15.7%) | 11 (17.7%) |
| $1,000 to $1,499 | 26 (10.0%) | 31 (50.0%) |
| $1,500 to $1,999 | 20 (7.7%) | 0 (0.0%) |
| $2,000 to $2,499 | 12 (4.6%) | 0 (0.0%) |
| $2,500 to $2,999 | 0 (0.0%) | 0 (0.0%) |
| $3,000 or more | 3 (1.1%) | 0 (0.0%) |
| Total | 261 (100.0%) | 62 (100.0%) |
Physical Housing Characteristics in Central Lake
Housing Structures in Central Lake
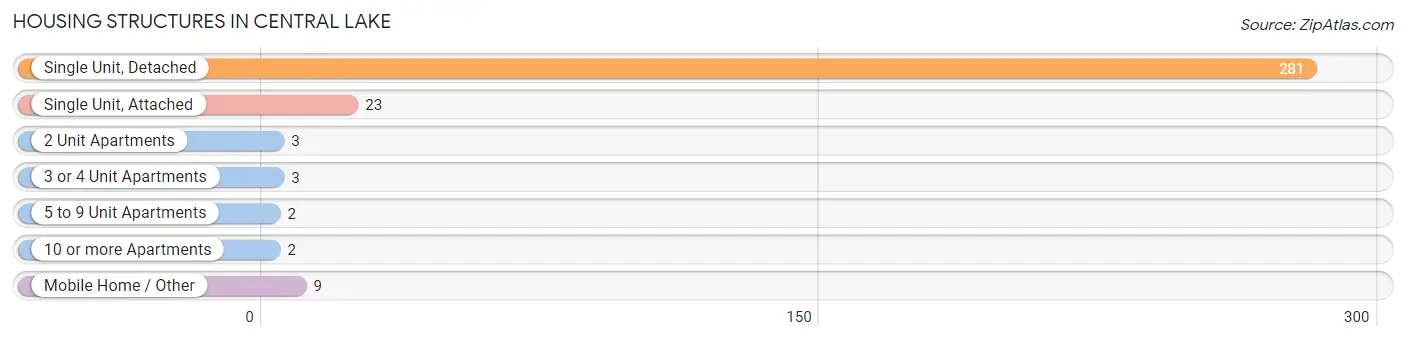
| Structure Type | # Housing Units | % Housing Units |
| Single Unit, Detached | 281 | 87.0% |
| Single Unit, Attached | 23 | 7.1% |
| 2 Unit Apartments | 3 | 0.9% |
| 3 or 4 Unit Apartments | 3 | 0.9% |
| 5 to 9 Unit Apartments | 2 | 0.6% |
| 10 or more Apartments | 2 | 0.6% |
| Mobile Home / Other | 9 | 2.8% |
| Total | 323 | 100.0% |
Housing Structures by Occupancy in Central Lake

| Structure Type | Owner-occupied | Renter-occupied |
| Single Unit, Detached | 224 (79.7%) | 57 (20.3%) |
| Single Unit, Attached | 23 (100.0%) | 0 (0.0%) |
| 2 Unit Apartments | 3 (100.0%) | 0 (0.0%) |
| 3 or 4 Unit Apartments | 2 (66.7%) | 1 (33.3%) |
| 5 to 9 Unit Apartments | 0 (0.0%) | 2 (100.0%) |
| 10 or more Apartments | 0 (0.0%) | 2 (100.0%) |
| Mobile Home / Other | 9 (100.0%) | 0 (0.0%) |
| Total | 261 (80.8%) | 62 (19.2%) |
Housing Structures by Number of Rooms in Central Lake
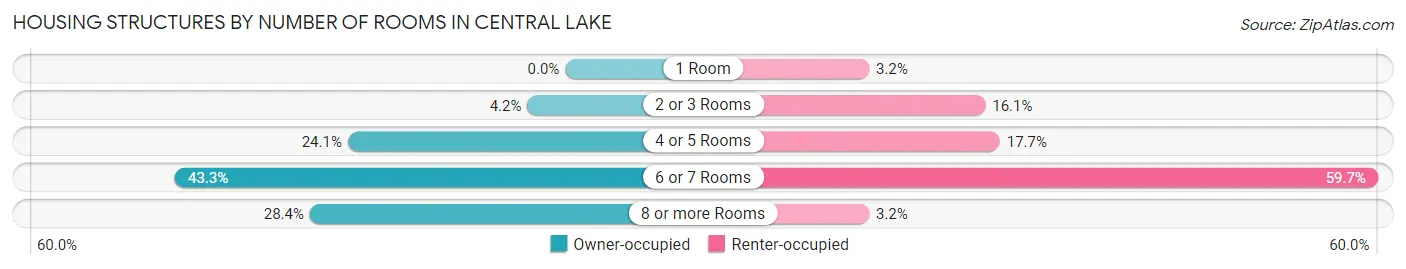
| Number of Rooms | Owner-occupied | Renter-occupied |
| 1 Room | 0 (0.0%) | 2 (3.2%) |
| 2 or 3 Rooms | 11 (4.2%) | 10 (16.1%) |
| 4 or 5 Rooms | 63 (24.1%) | 11 (17.7%) |
| 6 or 7 Rooms | 113 (43.3%) | 37 (59.7%) |
| 8 or more Rooms | 74 (28.3%) | 2 (3.2%) |
| Total | 261 (100.0%) | 62 (100.0%) |
Housing Structure by Heating Type in Central Lake
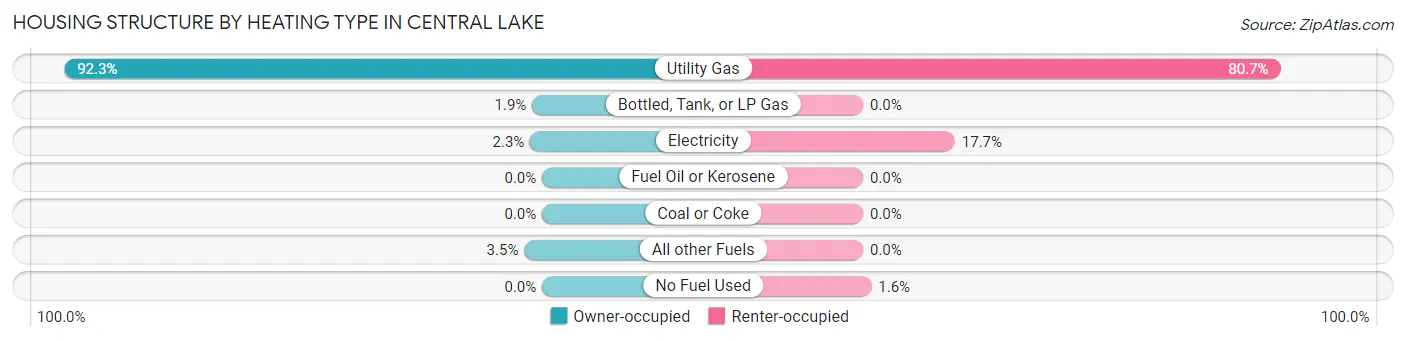
| Heating Type | Owner-occupied | Renter-occupied |
| Utility Gas | 241 (92.3%) | 50 (80.6%) |
| Bottled, Tank, or LP Gas | 5 (1.9%) | 0 (0.0%) |
| Electricity | 6 (2.3%) | 11 (17.7%) |
| Fuel Oil or Kerosene | 0 (0.0%) | 0 (0.0%) |
| Coal or Coke | 0 (0.0%) | 0 (0.0%) |
| All other Fuels | 9 (3.5%) | 0 (0.0%) |
| No Fuel Used | 0 (0.0%) | 1 (1.6%) |
| Total | 261 (100.0%) | 62 (100.0%) |
Household Vehicle Usage in Central Lake
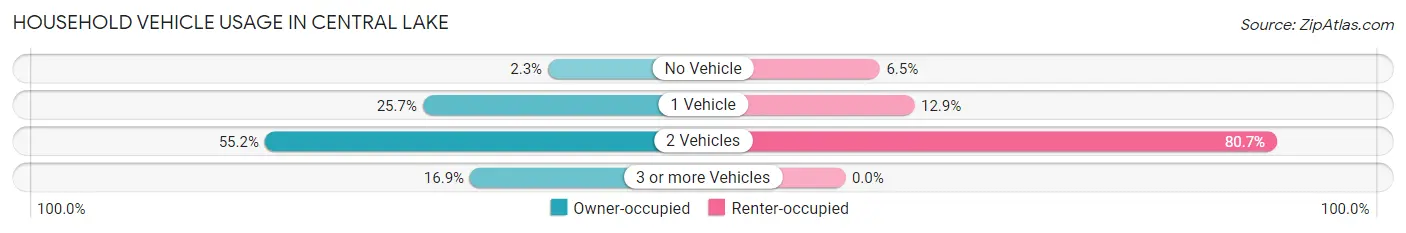
| Vehicles per Household | Owner-occupied | Renter-occupied |
| No Vehicle | 6 (2.3%) | 4 (6.5%) |
| 1 Vehicle | 67 (25.7%) | 8 (12.9%) |
| 2 Vehicles | 144 (55.2%) | 50 (80.6%) |
| 3 or more Vehicles | 44 (16.9%) | 0 (0.0%) |
| Total | 261 (100.0%) | 62 (100.0%) |
Real Estate & Mortgages in Central Lake
Real Estate and Mortgage Overview in Central Lake
| Characteristic | Without Mortgage | With Mortgage |
| Housing Units | 123 | 138 |
| Median Property Value | $103,900 | $153,800 |
| Median Household Income | $41,625 | $6 |
| Monthly Housing Costs | $450 | $3 |
| Real Estate Taxes | $1,433 | $10 |
Property Value by Mortgage Status in Central Lake
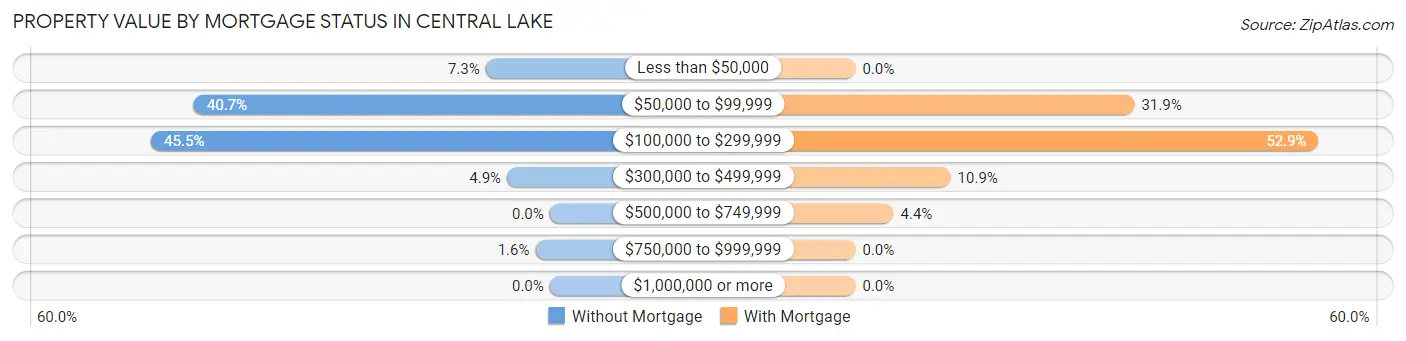
| Property Value | Without Mortgage | With Mortgage |
| Less than $50,000 | 9 (7.3%) | 0 (0.0%) |
| $50,000 to $99,999 | 50 (40.6%) | 44 (31.9%) |
| $100,000 to $299,999 | 56 (45.5%) | 73 (52.9%) |
| $300,000 to $499,999 | 6 (4.9%) | 15 (10.9%) |
| $500,000 to $749,999 | 0 (0.0%) | 6 (4.3%) |
| $750,000 to $999,999 | 2 (1.6%) | 0 (0.0%) |
| $1,000,000 or more | 0 (0.0%) | 0 (0.0%) |
| Total | 123 (100.0%) | 138 (100.0%) |
Household Income by Mortgage Status in Central Lake
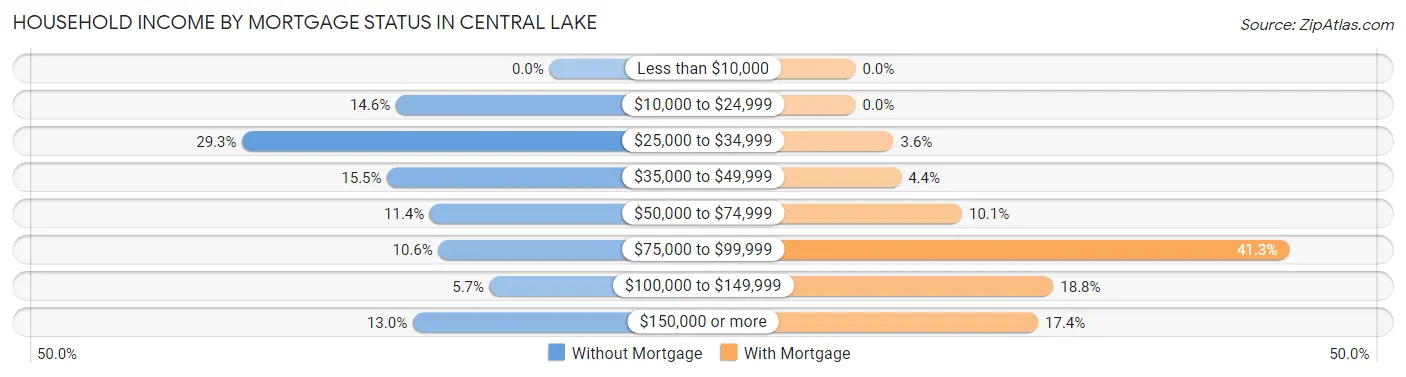
| Household Income | Without Mortgage | With Mortgage |
| Less than $10,000 | 0 (0.0%) | 0 (0.0%) |
| $10,000 to $24,999 | 18 (14.6%) | 0 (0.0%) |
| $25,000 to $34,999 | 36 (29.3%) | 5 (3.6%) |
| $35,000 to $49,999 | 19 (15.4%) | 6 (4.3%) |
| $50,000 to $74,999 | 14 (11.4%) | 14 (10.1%) |
| $75,000 to $99,999 | 13 (10.6%) | 57 (41.3%) |
| $100,000 to $149,999 | 7 (5.7%) | 26 (18.8%) |
| $150,000 or more | 16 (13.0%) | 24 (17.4%) |
| Total | 123 (100.0%) | 138 (100.0%) |
Property Value to Household Income Ratio in Central Lake
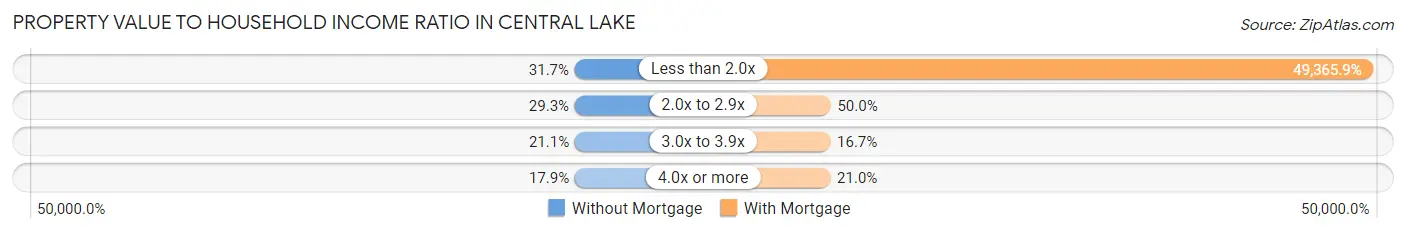
| Value-to-Income Ratio | Without Mortgage | With Mortgage |
| Less than 2.0x | 39 (31.7%) | 68,125 (49,365.9%) |
| 2.0x to 2.9x | 36 (29.3%) | 69 (50.0%) |
| 3.0x to 3.9x | 26 (21.1%) | 23 (16.7%) |
| 4.0x or more | 22 (17.9%) | 29 (21.0%) |
| Total | 123 (100.0%) | 138 (100.0%) |
Real Estate Taxes by Mortgage Status in Central Lake
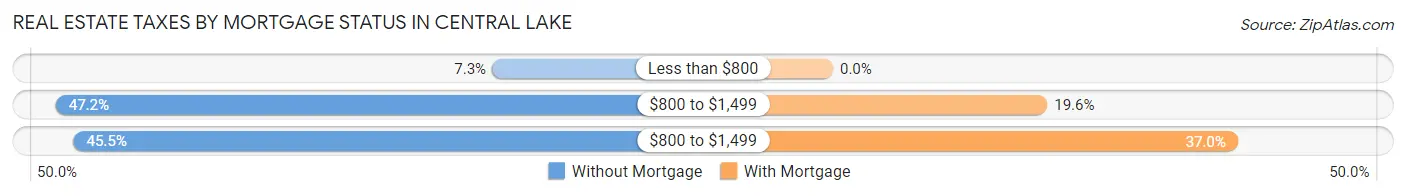
| Property Taxes | Without Mortgage | With Mortgage |
| Less than $800 | 9 (7.3%) | 0 (0.0%) |
| $800 to $1,499 | 58 (47.1%) | 27 (19.6%) |
| $800 to $1,499 | 56 (45.5%) | 51 (37.0%) |
| Total | 123 (100.0%) | 138 (100.0%) |
Health & Disability in Central Lake
Health Insurance Coverage by Age in Central Lake
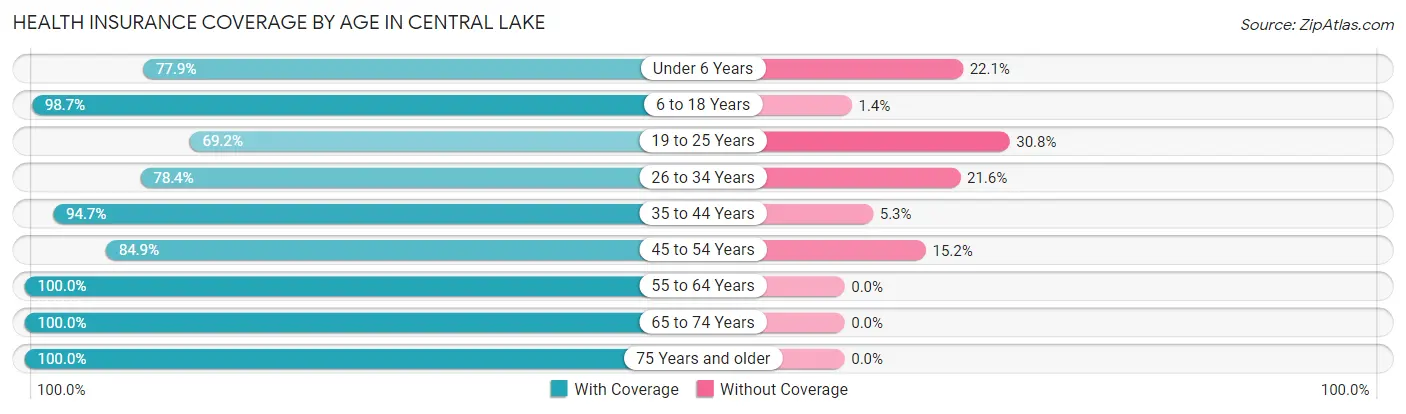
| Age Bracket | With Coverage | Without Coverage |
| Under 6 Years | 60 (77.9%) | 17 (22.1%) |
| 6 to 18 Years | 219 (98.7%) | 3 (1.3%) |
| 19 to 25 Years | 27 (69.2%) | 12 (30.8%) |
| 26 to 34 Years | 69 (78.4%) | 19 (21.6%) |
| 35 to 44 Years | 107 (94.7%) | 6 (5.3%) |
| 45 to 54 Years | 84 (84.9%) | 15 (15.1%) |
| 55 to 64 Years | 79 (100.0%) | 0 (0.0%) |
| 65 to 74 Years | 94 (100.0%) | 0 (0.0%) |
| 75 Years and older | 76 (100.0%) | 0 (0.0%) |
| Total | 815 (91.9%) | 72 (8.1%) |
Health Insurance Coverage by Citizenship Status in Central Lake
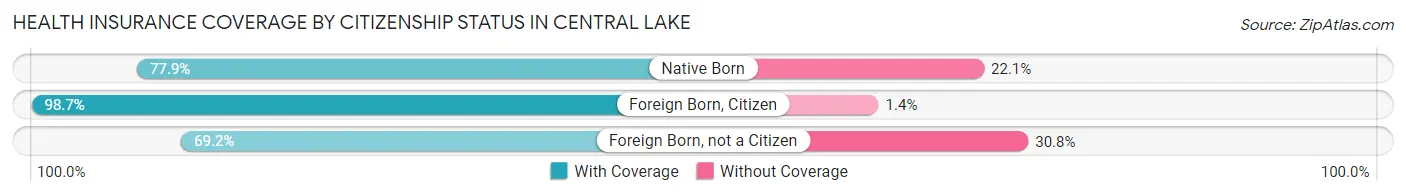
| Citizenship Status | With Coverage | Without Coverage |
| Native Born | 60 (77.9%) | 17 (22.1%) |
| Foreign Born, Citizen | 219 (98.7%) | 3 (1.3%) |
| Foreign Born, not a Citizen | 27 (69.2%) | 12 (30.8%) |
Health Insurance Coverage by Household Income in Central Lake
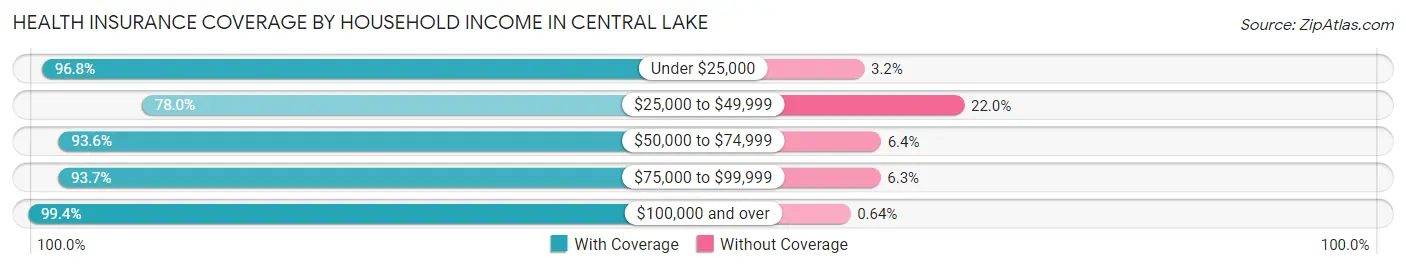
| Household Income | With Coverage | Without Coverage |
| Under $25,000 | 60 (96.8%) | 2 (3.2%) |
| $25,000 to $49,999 | 135 (78.0%) | 38 (22.0%) |
| $50,000 to $74,999 | 309 (93.6%) | 21 (6.4%) |
| $75,000 to $99,999 | 149 (93.7%) | 10 (6.3%) |
| $100,000 and over | 155 (99.4%) | 1 (0.6%) |
Public vs Private Health Insurance Coverage by Age in Central Lake
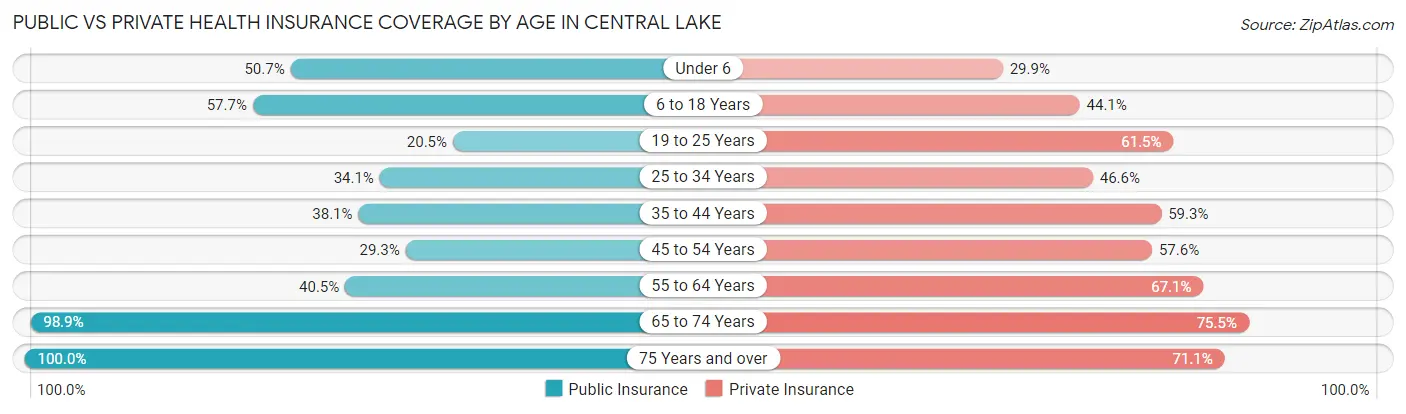
| Age Bracket | Public Insurance | Private Insurance |
| Under 6 | 39 (50.6%) | 23 (29.9%) |
| 6 to 18 Years | 128 (57.7%) | 98 (44.1%) |
| 19 to 25 Years | 8 (20.5%) | 24 (61.5%) |
| 25 to 34 Years | 30 (34.1%) | 41 (46.6%) |
| 35 to 44 Years | 43 (38.1%) | 67 (59.3%) |
| 45 to 54 Years | 29 (29.3%) | 57 (57.6%) |
| 55 to 64 Years | 32 (40.5%) | 53 (67.1%) |
| 65 to 74 Years | 93 (98.9%) | 71 (75.5%) |
| 75 Years and over | 76 (100.0%) | 54 (71.1%) |
| Total | 478 (53.9%) | 488 (55.0%) |
Disability Status by Sex by Age in Central Lake
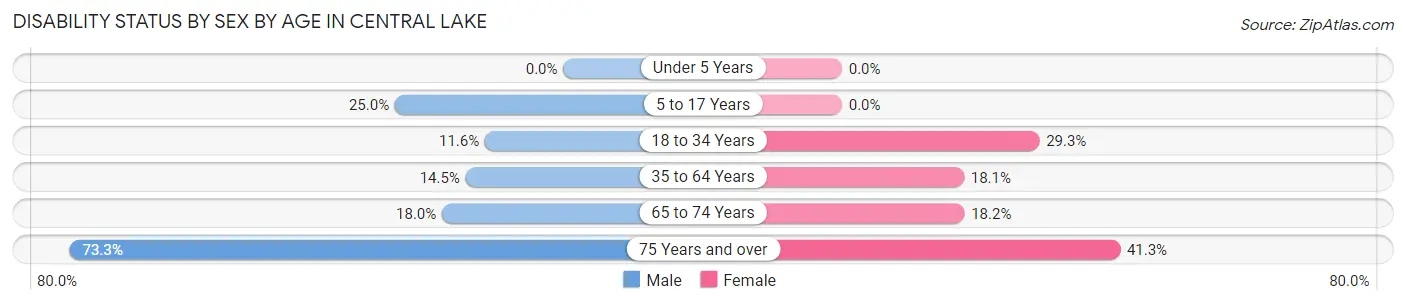
| Age Bracket | Male | Female |
| Under 5 Years | 0 (0.0%) | 0 (0.0%) |
| 5 to 17 Years | 32 (25.0%) | 0 (0.0%) |
| 18 to 34 Years | 10 (11.6%) | 17 (29.3%) |
| 35 to 64 Years | 19 (14.5%) | 29 (18.1%) |
| 65 to 74 Years | 9 (18.0%) | 8 (18.2%) |
| 75 Years and over | 22 (73.3%) | 19 (41.3%) |
Disability Class by Sex by Age in Central Lake
Disability Class: Hearing Difficulty
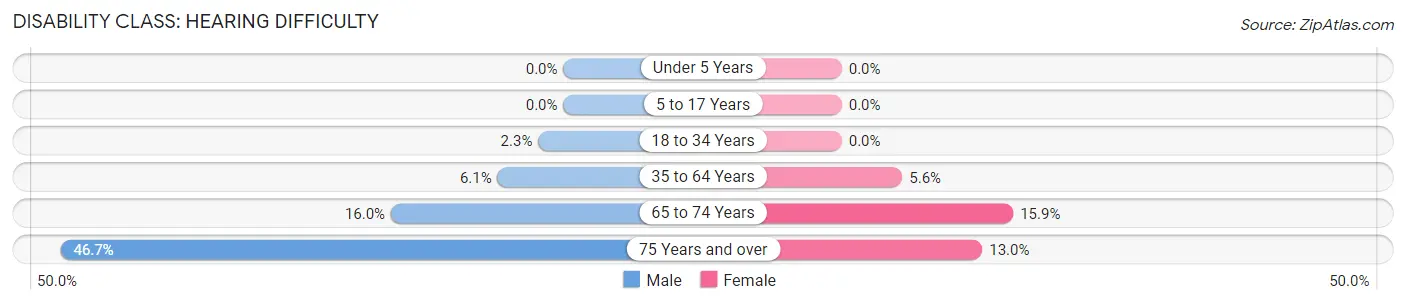
| Age Bracket | Male | Female |
| Under 5 Years | 0 (0.0%) | 0 (0.0%) |
| 5 to 17 Years | 0 (0.0%) | 0 (0.0%) |
| 18 to 34 Years | 2 (2.3%) | 0 (0.0%) |
| 35 to 64 Years | 8 (6.1%) | 9 (5.6%) |
| 65 to 74 Years | 8 (16.0%) | 7 (15.9%) |
| 75 Years and over | 14 (46.7%) | 6 (13.0%) |
Disability Class: Vision Difficulty
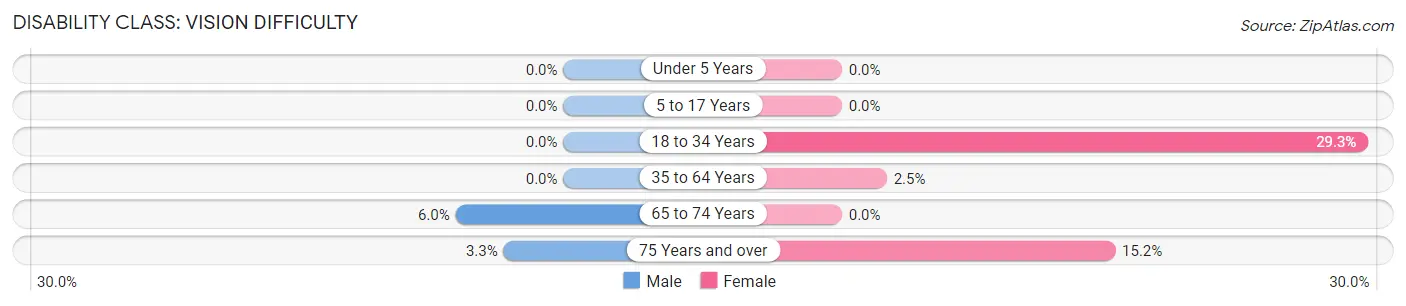
| Age Bracket | Male | Female |
| Under 5 Years | 0 (0.0%) | 0 (0.0%) |
| 5 to 17 Years | 0 (0.0%) | 0 (0.0%) |
| 18 to 34 Years | 0 (0.0%) | 17 (29.3%) |
| 35 to 64 Years | 0 (0.0%) | 4 (2.5%) |
| 65 to 74 Years | 3 (6.0%) | 0 (0.0%) |
| 75 Years and over | 1 (3.3%) | 7 (15.2%) |
Disability Class: Cognitive Difficulty
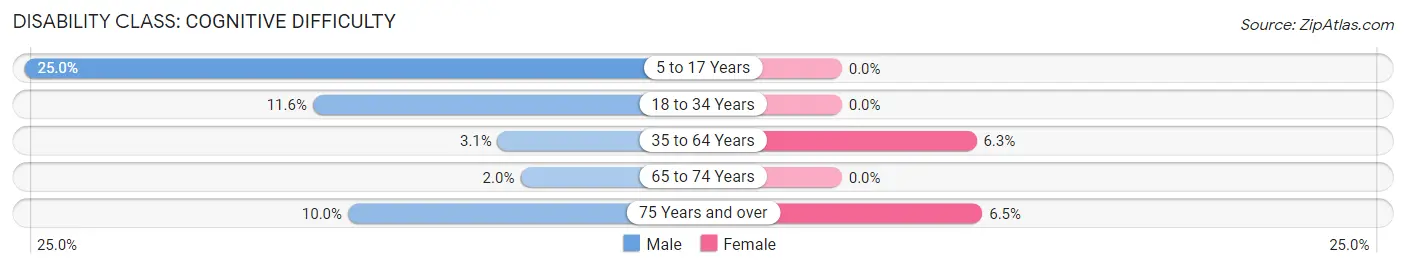
| Age Bracket | Male | Female |
| 5 to 17 Years | 32 (25.0%) | 0 (0.0%) |
| 18 to 34 Years | 10 (11.6%) | 0 (0.0%) |
| 35 to 64 Years | 4 (3.0%) | 10 (6.2%) |
| 65 to 74 Years | 1 (2.0%) | 0 (0.0%) |
| 75 Years and over | 3 (10.0%) | 3 (6.5%) |
Disability Class: Ambulatory Difficulty
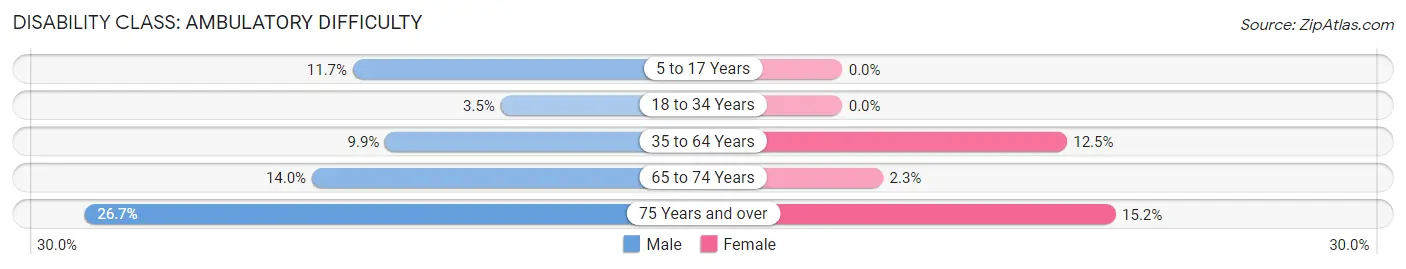
| Age Bracket | Male | Female |
| 5 to 17 Years | 15 (11.7%) | 0 (0.0%) |
| 18 to 34 Years | 3 (3.5%) | 0 (0.0%) |
| 35 to 64 Years | 13 (9.9%) | 20 (12.5%) |
| 65 to 74 Years | 7 (14.0%) | 1 (2.3%) |
| 75 Years and over | 8 (26.7%) | 7 (15.2%) |
Disability Class: Self-Care Difficulty
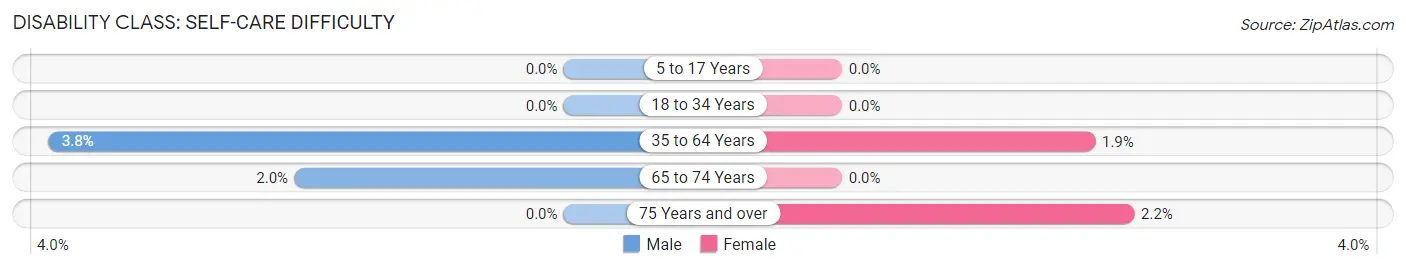
| Age Bracket | Male | Female |
| 5 to 17 Years | 0 (0.0%) | 0 (0.0%) |
| 18 to 34 Years | 0 (0.0%) | 0 (0.0%) |
| 35 to 64 Years | 5 (3.8%) | 3 (1.9%) |
| 65 to 74 Years | 1 (2.0%) | 0 (0.0%) |
| 75 Years and over | 0 (0.0%) | 1 (2.2%) |
Technology Access in Central Lake
Computing Device Access in Central Lake
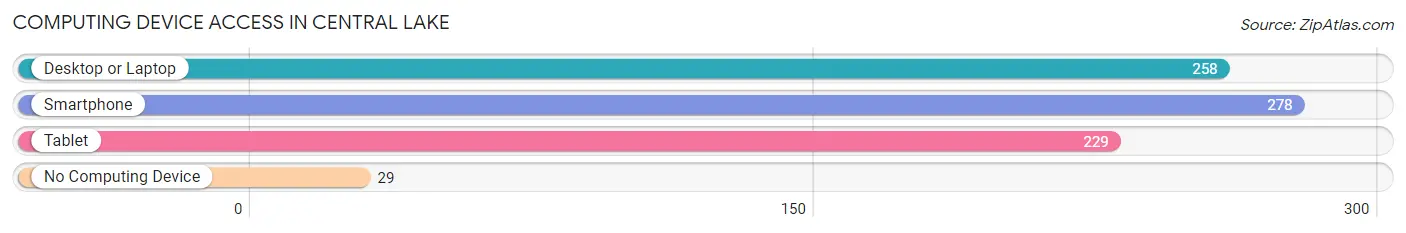
| Device Type | # Households | % Households |
| Desktop or Laptop | 258 | 79.9% |
| Smartphone | 278 | 86.1% |
| Tablet | 229 | 70.9% |
| No Computing Device | 29 | 9.0% |
| Total | 323 | 100.0% |
Internet Access in Central Lake
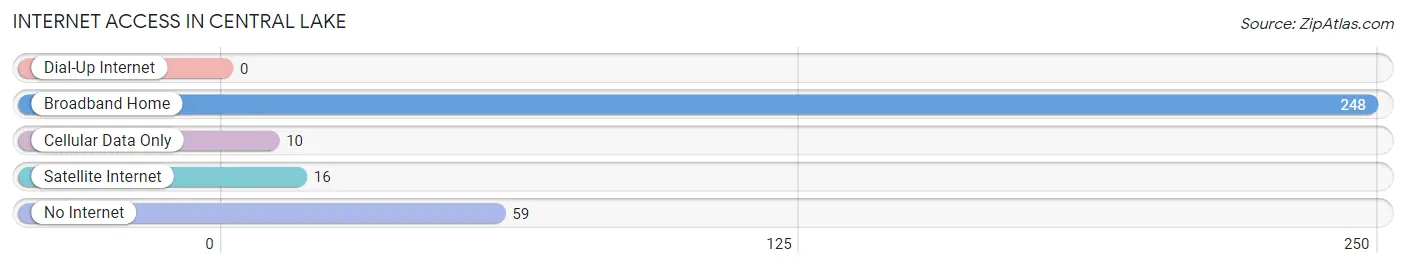
| Internet Type | # Households | % Households |
| Dial-Up Internet | 0 | 0.0% |
| Broadband Home | 248 | 76.8% |
| Cellular Data Only | 10 | 3.1% |
| Satellite Internet | 16 | 5.0% |
| No Internet | 59 | 18.3% |
| Total | 323 | 100.0% |
Central Lake Summary
Central Lake is a small village located in Antrim County, Michigan. It is situated on the northern shore of Torch Lake, a large lake in the northern part of the state. The village is located about 20 miles northeast of Traverse City and about 30 miles southwest of Charlevoix. The population of Central Lake was 1,072 at the 2010 census.
History
Central Lake was first settled in 1871 by a group of settlers from Ohio. The village was originally known as "Central Station" because it was the central point of the Grand Rapids and Indiana Railroad. The name was changed to Central Lake in 1881.
The village was incorporated in 1891 and the first mayor was elected in 1892. The village was a popular tourist destination in the early 1900s, with many visitors coming to enjoy the lake and the surrounding area.
Geography
Central Lake is located at the northern end of Torch Lake, which is part of the Chain of Lakes. The village is situated on the east side of the lake, with the village of Ellsworth located on the west side. The village is surrounded by rolling hills and forests.
The village is located in the northwest corner of Antrim County, about 20 miles northeast of Traverse City and about 30 miles southwest of Charlevoix. The nearest major highway is US-131, which runs through the village.
Economy
The economy of Central Lake is largely based on tourism. The village is a popular destination for boaters, fishermen, and other outdoor enthusiasts. There are several marinas and boat launches in the area, as well as several restaurants and other businesses catering to tourists.
The village is also home to several small businesses, including a grocery store, a hardware store, and a few other retail stores. The village is also home to a few manufacturing companies, including a furniture manufacturer and a metal fabrication company.
Demographics
As of the 2010 census, the population of Central Lake was 1,072. The racial makeup of the village was 97.2% White, 0.7% African American, 0.3% Native American, 0.3% Asian, 0.2% from other races, and 1.5% from two or more races. Hispanic or Latino of any race were 1.2% of the population.
The median income for a household in the village was $37,500, and the median income for a family was $45,000. The per capita income for the village was $20,845. About 10.2% of families and 13.2% of the population were below the poverty line, including 17.2% of those under age 18 and 8.3% of those age 65 or over.
Common Questions
What is Per Capita Income in Central Lake?
Per Capita income in Central Lake is $23,834.
What is the Median Family Income in Central Lake?
Median Family Income in Central Lake is $59,167.
What is the Median Household income in Central Lake?
Median Household Income in Central Lake is $56,550.
What is Income or Wage Gap in Central Lake?
Income or Wage Gap in Central Lake is 8.7%.
Women in Central Lake earn 91.3 cents for every dollar earned by a man.
What is Inequality or Gini Index in Central Lake?
Inequality or Gini Index in Central Lake is 0.35.
What is the Total Population of Central Lake?
Total Population of Central Lake is 887.
What is the Total Male Population of Central Lake?
Total Male Population of Central Lake is 473.
What is the Total Female Population of Central Lake?
Total Female Population of Central Lake is 414.
What is the Ratio of Males per 100 Females in Central Lake?
There are 114.25 Males per 100 Females in Central Lake.
What is the Ratio of Females per 100 Males in Central Lake?
There are 87.53 Females per 100 Males in Central Lake.
What is the Median Population Age in Central Lake?
Median Population Age in Central Lake is 35.5 Years.
What is the Average Family Size in Central Lake
Average Family Size in Central Lake is 3.2 People.
What is the Average Household Size in Central Lake
Average Household Size in Central Lake is 2.7 People.
How Large is the Labor Force in Central Lake?
There are 381 People in the Labor Forcein in Central Lake.
What is the Percentage of People in the Labor Force in Central Lake?
60.6% of People are in the Labor Force in Central Lake.
What is the Unemployment Rate in Central Lake?
Unemployment Rate in Central Lake is 3.1%.