Baldwin, MI Map & Demographics
Baldwin Map
Baldwin Overview
$14,507
PER CAPITA INCOME
$24,712
AVG FAMILY INCOME
$25,587
AVG HOUSEHOLD INCOME
33.3%
WAGE / INCOME GAP [ % ]
66.7¢/ $1
WAGE / INCOME GAP [ $ ]
0.43
INEQUALITY / GINI INDEX
1,030
TOTAL POPULATION
535
MALE POPULATION
495
FEMALE POPULATION
108.08
MALES / 100 FEMALES
92.52
FEMALES / 100 MALES
43.8
MEDIAN AGE
3.4
AVG FAMILY SIZE
1.9
AVG HOUSEHOLD SIZE
267
LABOR FORCE [ PEOPLE ]
29.6%
PERCENT IN LABOR FORCE
6.4%
UNEMPLOYMENT RATE
Baldwin Zip Codes
Baldwin Area Codes
Income in Baldwin
Income Overview in Baldwin
Per Capita Income in Baldwin is $14,507, while median incomes of families and households are $24,712 and $25,587 respectively.
| Characteristic | Number | Measure |
| Per Capita Income | 1,030 | $14,507 |
| Median Family Income | 127 | $24,712 |
| Mean Family Income | 127 | $44,559 |
| Median Household Income | 405 | $25,587 |
| Mean Household Income | 405 | $29,510 |
| Income Deficit | 127 | $0 |
| Wage / Income Gap (%) | 1,030 | 33.33% |
| Wage / Income Gap ($) | 1,030 | 66.67¢ per $1 |
| Gini / Inequality Index | 1,030 | 0.43 |
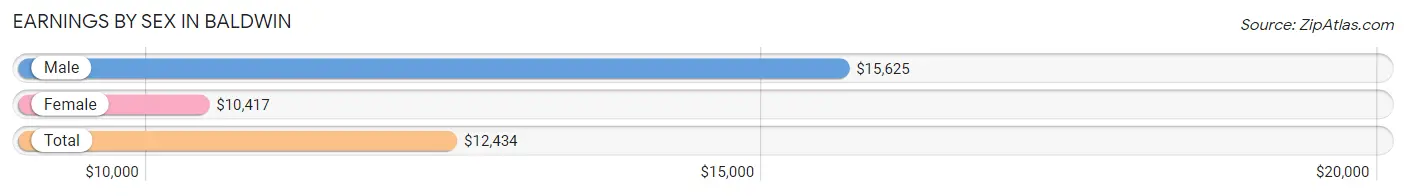
Earnings by Sex in Baldwin
Average Earnings in Baldwin are $12,434, $15,625 for men and $10,417 for women, a difference of 33.3%.
| Sex | Number | Average Earnings |
| Male | 225 (55.8%) | $15,625 |
| Female | 178 (44.2%) | $10,417 |
| Total | 403 (100.0%) | $12,434 |
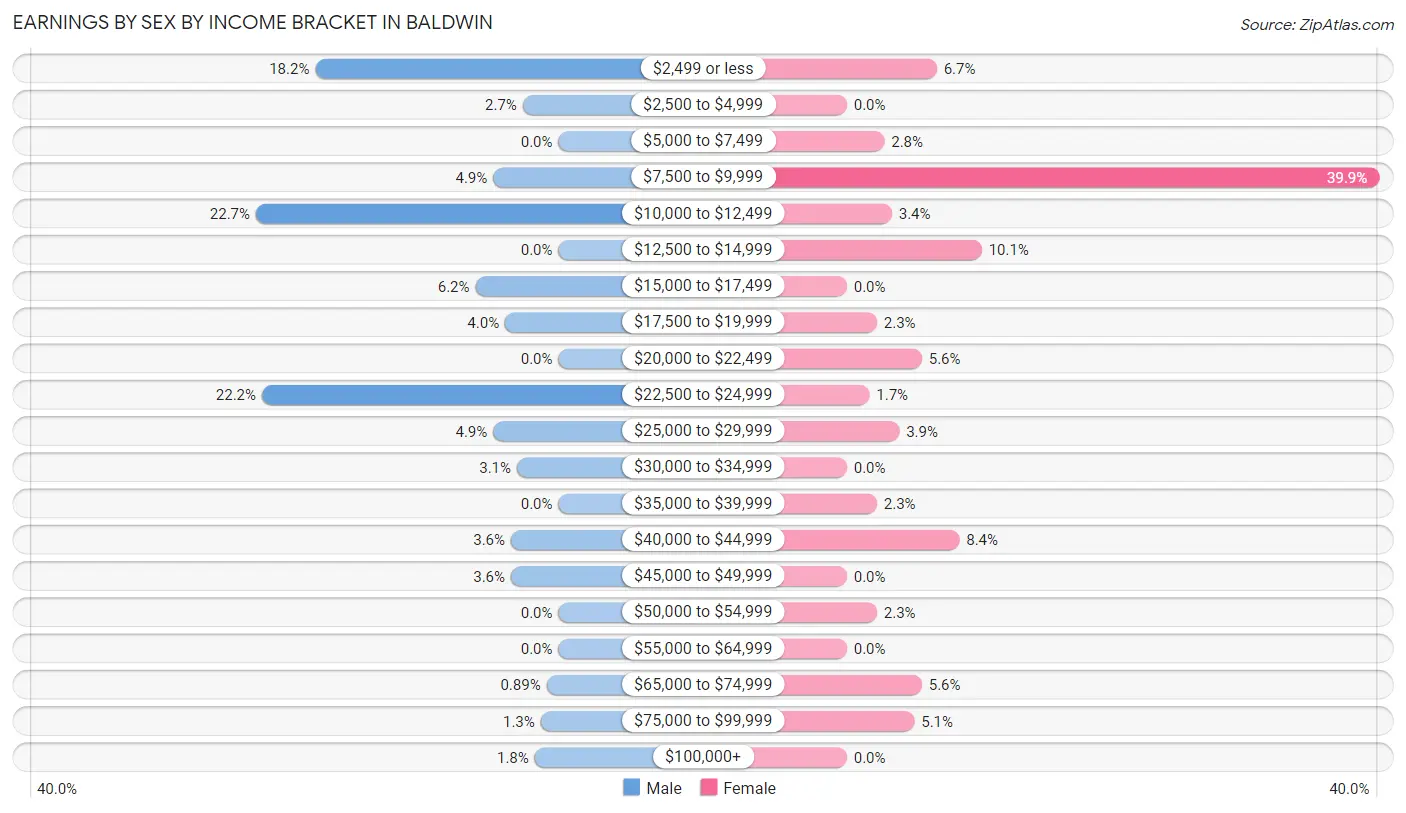
Earnings by Sex by Income Bracket in Baldwin
The most common earnings brackets in Baldwin are $10,000 to $12,499 for men (51 | 22.7%) and $7,500 to $9,999 for women (71 | 39.9%).
| Income | Male | Female |
| $2,499 or less | 41 (18.2%) | 12 (6.7%) |
| $2,500 to $4,999 | 6 (2.7%) | 0 (0.0%) |
| $5,000 to $7,499 | 0 (0.0%) | 5 (2.8%) |
| $7,500 to $9,999 | 11 (4.9%) | 71 (39.9%) |
| $10,000 to $12,499 | 51 (22.7%) | 6 (3.4%) |
| $12,500 to $14,999 | 0 (0.0%) | 18 (10.1%) |
| $15,000 to $17,499 | 14 (6.2%) | 0 (0.0%) |
| $17,500 to $19,999 | 9 (4.0%) | 4 (2.2%) |
| $20,000 to $22,499 | 0 (0.0%) | 10 (5.6%) |
| $22,500 to $24,999 | 50 (22.2%) | 3 (1.7%) |
| $25,000 to $29,999 | 11 (4.9%) | 7 (3.9%) |
| $30,000 to $34,999 | 7 (3.1%) | 0 (0.0%) |
| $35,000 to $39,999 | 0 (0.0%) | 4 (2.2%) |
| $40,000 to $44,999 | 8 (3.6%) | 15 (8.4%) |
| $45,000 to $49,999 | 8 (3.6%) | 0 (0.0%) |
| $50,000 to $54,999 | 0 (0.0%) | 4 (2.2%) |
| $55,000 to $64,999 | 0 (0.0%) | 0 (0.0%) |
| $65,000 to $74,999 | 2 (0.9%) | 10 (5.6%) |
| $75,000 to $99,999 | 3 (1.3%) | 9 (5.1%) |
| $100,000+ | 4 (1.8%) | 0 (0.0%) |
| Total | 225 (100.0%) | 178 (100.0%) |
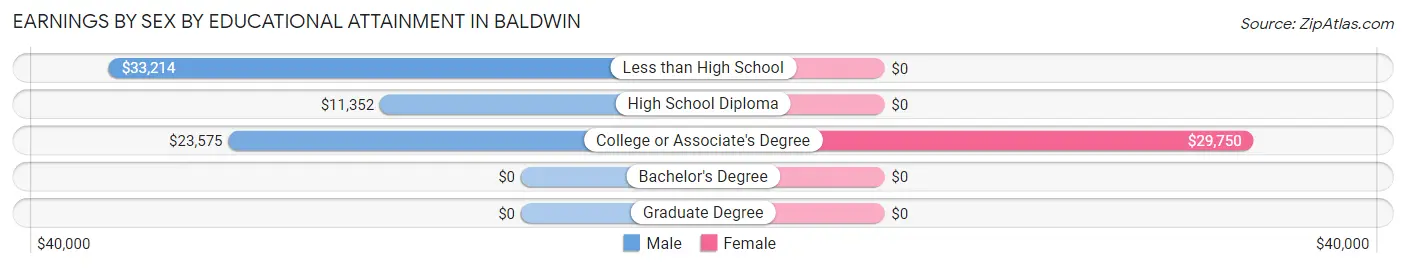
Earnings by Sex by Educational Attainment in Baldwin
Average earnings in Baldwin are $19,722 for men and $9,918 for women, a difference of 49.7%. Men with an educational attainment of less than high school enjoy the highest average annual earnings of $33,214, while those with high school diploma education earn the least with $11,352. Women with an educational attainment of college or associate's degree earn the most with the average annual earnings of $29,750, while those with college or associate's degree education have the smallest earnings of $29,750.
| Educational Attainment | Male Income | Female Income |
| Less than High School | $33,214 | $0 |
| High School Diploma | $11,352 | $0 |
| College or Associate's Degree | $23,575 | $29,750 |
| Bachelor's Degree | - | - |
| Graduate Degree | - | - |
| Total | $19,722 | $9,918 |
Family Income in Baldwin
Family Income Brackets in Baldwin
According to the Baldwin family income data, there are 41 families falling into the $15,000 to $24,999 income range, which is the most common income bracket and makes up 32.3% of all families.
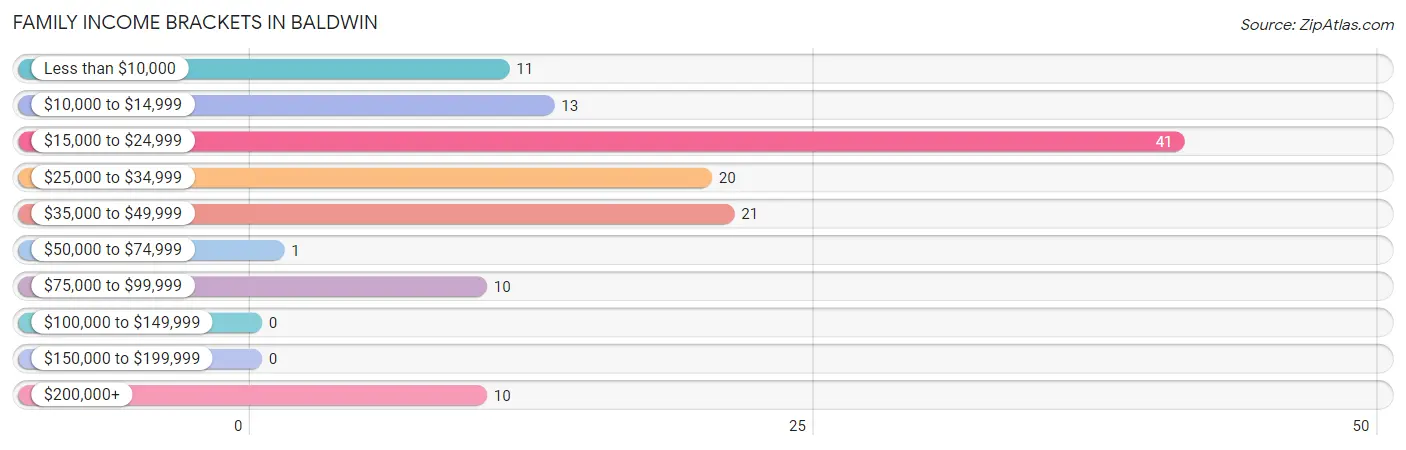
| Income Bracket | # Families | % Families |
| Less than $10,000 | 11 | 8.7% |
| $10,000 to $14,999 | 13 | 10.2% |
| $15,000 to $24,999 | 41 | 32.3% |
| $25,000 to $34,999 | 20 | 15.7% |
| $35,000 to $49,999 | 21 | 16.5% |
| $50,000 to $74,999 | 1 | 0.8% |
| $75,000 to $99,999 | 10 | 7.9% |
| $100,000 to $149,999 | 0 | 0.0% |
| $150,000 to $199,999 | 0 | 0.0% |
| $200,000+ | 10 | 7.9% |
Family Income by Famaliy Size in Baldwin
2-person families (83 | 65.3%) account for the highest median family income in Baldwin with $21,083 per family, while 2-person families (83 | 65.3%) have the highest median income of $10,542 per family member.
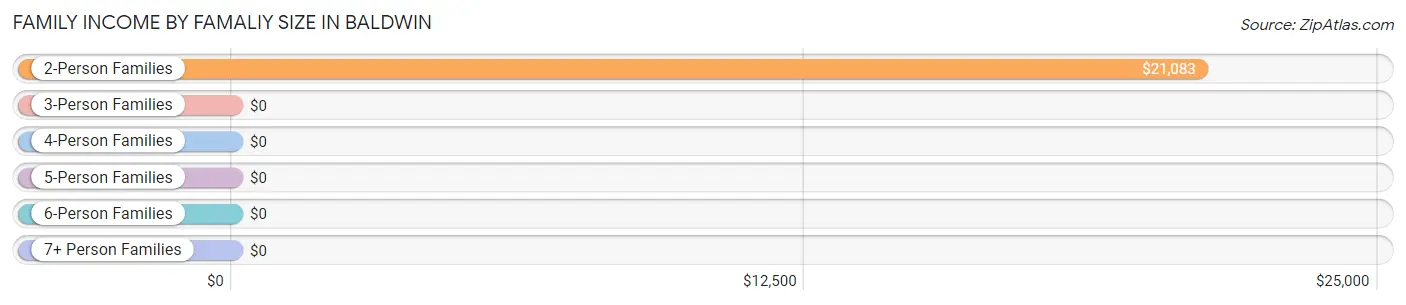
| Income Bracket | # Families | Median Income |
| 2-Person Families | 83 (65.3%) | $21,083 |
| 3-Person Families | 17 (13.4%) | $0 |
| 4-Person Families | 17 (13.4%) | $0 |
| 5-Person Families | 0 (0.0%) | $0 |
| 6-Person Families | 10 (7.9%) | $0 |
| 7+ Person Families | 0 (0.0%) | $0 |
| Total | 127 (100.0%) | $24,712 |
Family Income by Number of Earners in Baldwin
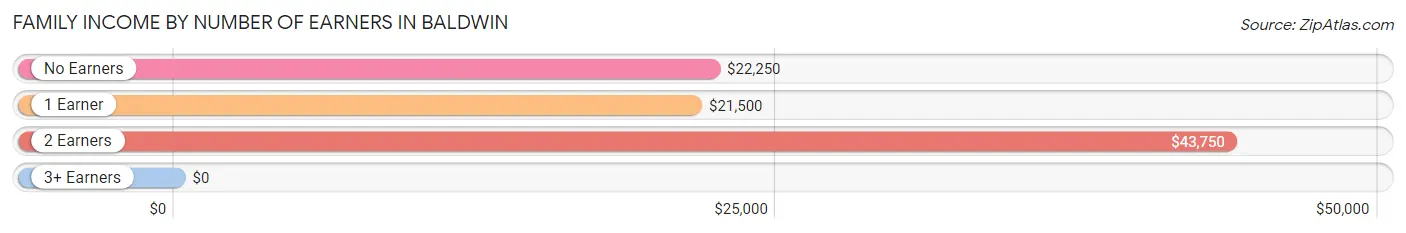
| Number of Earners | # Families | Median Income |
| No Earners | 53 (41.7%) | $22,250 |
| 1 Earner | 38 (29.9%) | $21,500 |
| 2 Earners | 28 (22.1%) | $43,750 |
| 3+ Earners | 8 (6.3%) | $0 |
| Total | 127 (100.0%) | $24,712 |
Household Income in Baldwin
Household Income Brackets in Baldwin
With 148 households falling in the category, the $25,000 to $34,999 income range is the most frequent in Baldwin, accounting for 36.5% of all households.
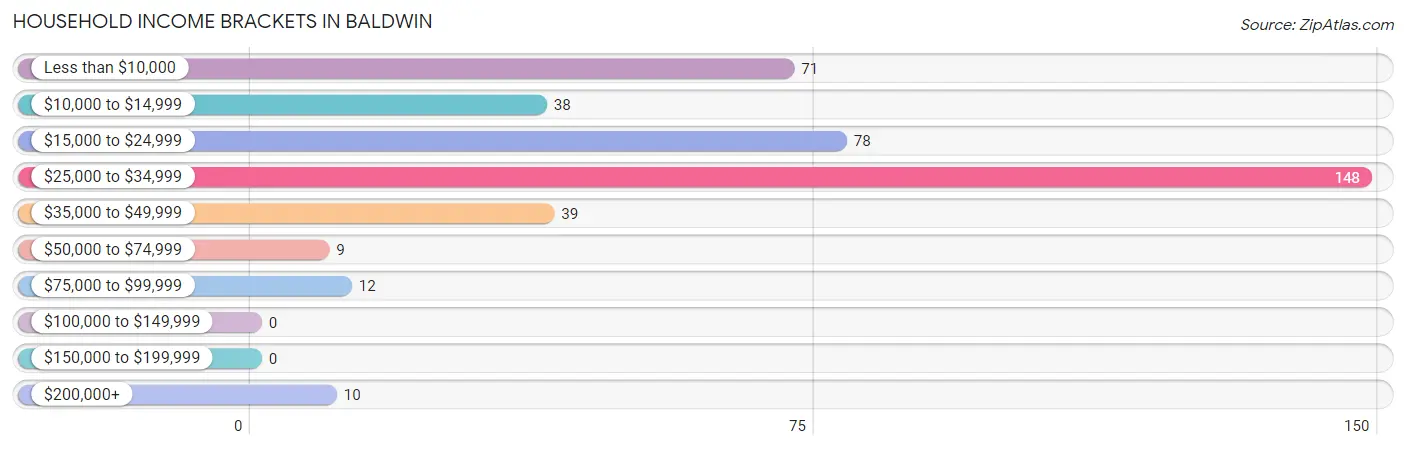
| Income Bracket | # Households | % Households |
| Less than $10,000 | 71 | 17.5% |
| $10,000 to $14,999 | 38 | 9.4% |
| $15,000 to $24,999 | 78 | 19.3% |
| $25,000 to $34,999 | 148 | 36.5% |
| $35,000 to $49,999 | 39 | 9.6% |
| $50,000 to $74,999 | 9 | 2.2% |
| $75,000 to $99,999 | 12 | 3.0% |
| $100,000 to $149,999 | 0 | 0.0% |
| $150,000 to $199,999 | 0 | 0.0% |
| $200,000+ | 10 | 2.5% |
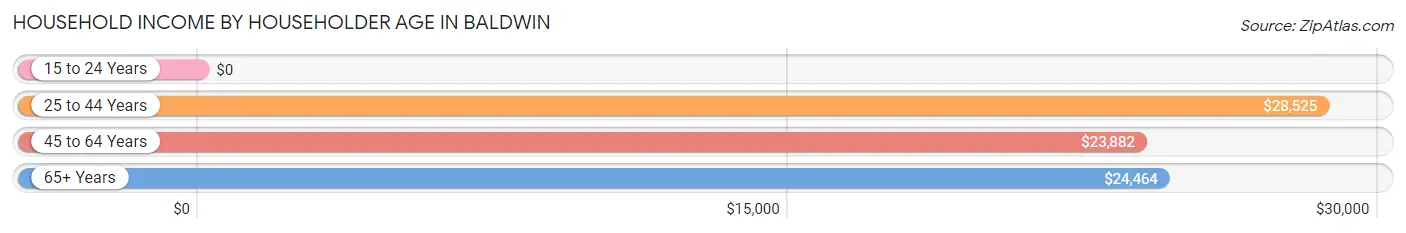
Household Income by Householder Age in Baldwin
The median household income in Baldwin is $25,587, with the highest median household income of $28,525 found in the 25 to 44 years age bracket for the primary householder. A total of 107 households (26.4%) fall into this category. Meanwhile, the 15 to 24 years age bracket for the primary householder has the lowest median household income of $0, with 10 households (2.5%) in this group.
| Income Bracket | # Households | Median Income |
| 15 to 24 Years | 10 (2.5%) | $0 |
| 25 to 44 Years | 107 (26.4%) | $28,525 |
| 45 to 64 Years | 129 (31.9%) | $23,882 |
| 65+ Years | 159 (39.3%) | $24,464 |
| Total | 405 (100.0%) | $25,587 |
Poverty in Baldwin
Income Below Poverty by Sex and Age in Baldwin
With 52.1% poverty level for males and 28.4% for females among the residents of Baldwin, 5 year old males and 12 to 14 year old females are the most vulnerable to poverty, with 7 males (100.0%) and 7 females (100.0%) in their respective age groups living below the poverty level.
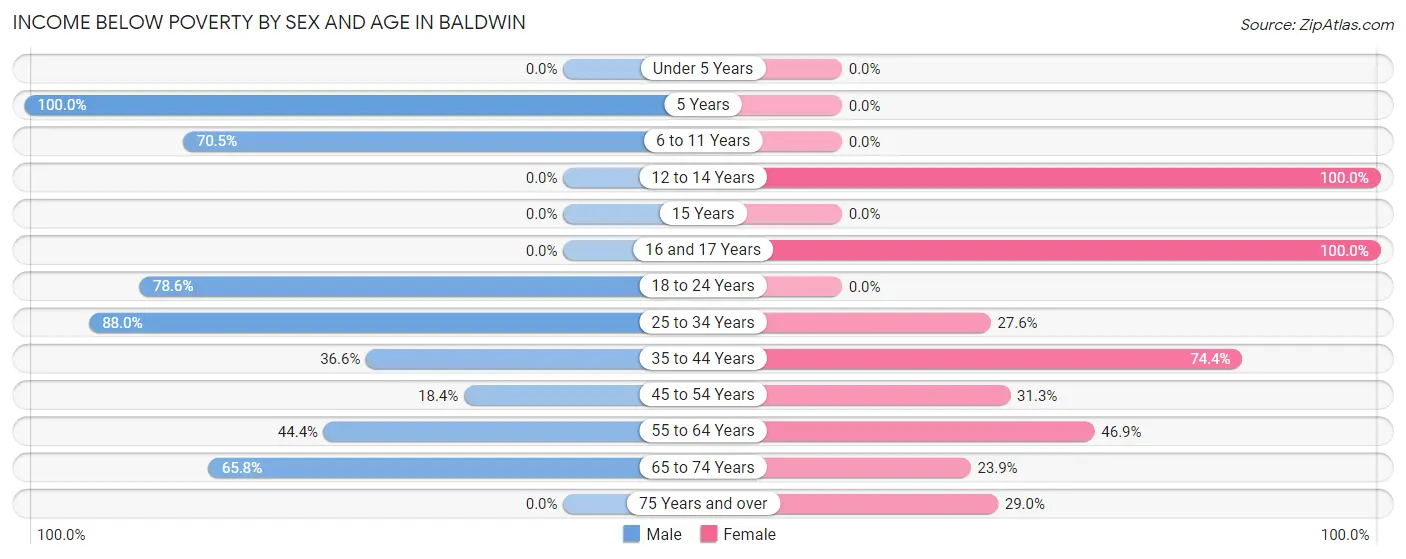
| Age Bracket | Male | Female |
| Under 5 Years | 0 (0.0%) | 0 (0.0%) |
| 5 Years | 7 (100.0%) | 0 (0.0%) |
| 6 to 11 Years | 31 (70.5%) | 0 (0.0%) |
| 12 to 14 Years | 0 (0.0%) | 7 (100.0%) |
| 15 Years | 0 (0.0%) | 0 (0.0%) |
| 16 and 17 Years | 0 (0.0%) | 3 (100.0%) |
| 18 to 24 Years | 22 (78.6%) | 0 (0.0%) |
| 25 to 34 Years | 44 (88.0%) | 8 (27.6%) |
| 35 to 44 Years | 30 (36.6%) | 29 (74.4%) |
| 45 to 54 Years | 7 (18.4%) | 15 (31.2%) |
| 55 to 64 Years | 16 (44.4%) | 15 (46.9%) |
| 65 to 74 Years | 25 (65.8%) | 32 (23.9%) |
| 75 Years and over | 0 (0.0%) | 11 (28.9%) |
| Total | 182 (52.1%) | 120 (28.4%) |
Income Above Poverty by Sex and Age in Baldwin
According to the poverty statistics in Baldwin, males aged under 5 years and females aged under 5 years are the age groups that are most secure financially, with 100.0% of males and 100.0% of females in these age groups living above the poverty line.
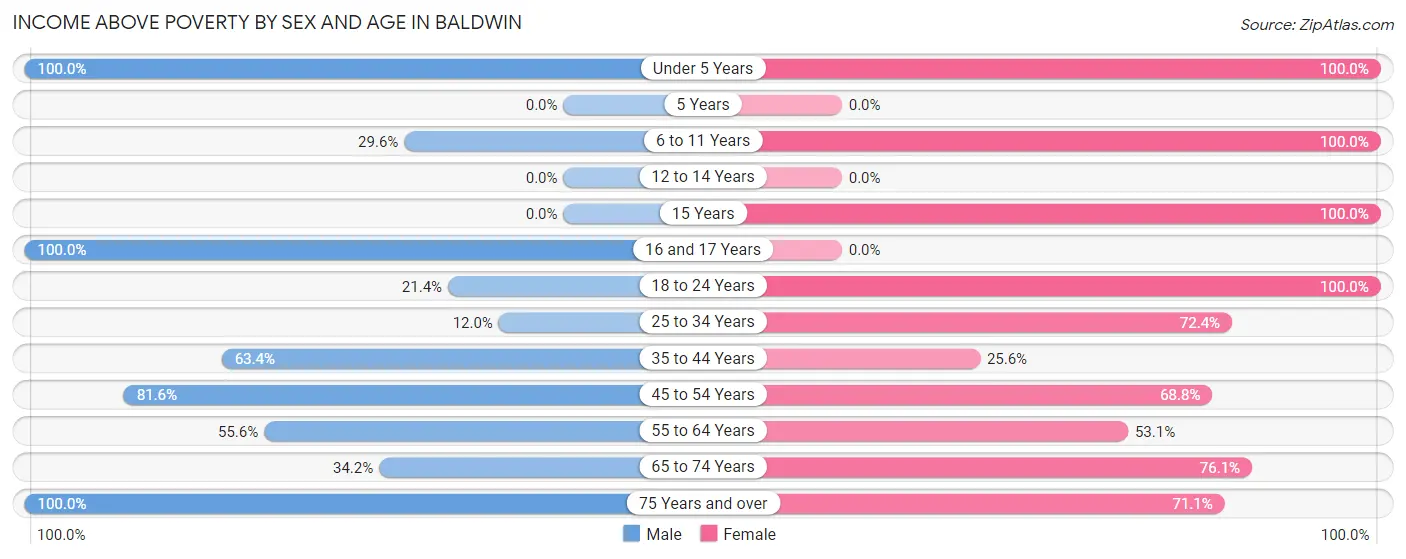
| Age Bracket | Male | Female |
| Under 5 Years | 8 (100.0%) | 55 (100.0%) |
| 5 Years | 0 (0.0%) | 0 (0.0%) |
| 6 to 11 Years | 13 (29.5%) | 5 (100.0%) |
| 12 to 14 Years | 0 (0.0%) | 0 (0.0%) |
| 15 Years | 0 (0.0%) | 3 (100.0%) |
| 16 and 17 Years | 10 (100.0%) | 0 (0.0%) |
| 18 to 24 Years | 6 (21.4%) | 29 (100.0%) |
| 25 to 34 Years | 6 (12.0%) | 21 (72.4%) |
| 35 to 44 Years | 52 (63.4%) | 10 (25.6%) |
| 45 to 54 Years | 31 (81.6%) | 33 (68.8%) |
| 55 to 64 Years | 20 (55.6%) | 17 (53.1%) |
| 65 to 74 Years | 13 (34.2%) | 102 (76.1%) |
| 75 Years and over | 8 (100.0%) | 27 (71.1%) |
| Total | 167 (47.8%) | 302 (71.6%) |
Income Below Poverty Among Married-Couple Families in Baldwin
The poverty statistics for married-couple families in Baldwin show that 24.7% or 18 of the total 73 families live below the poverty line. Families with 3 or 4 children have the highest poverty rate of 50.0%, comprising of 5 families. On the other hand, families with 1 or 2 children have the lowest poverty rate of 0.0%, which includes 0 families.
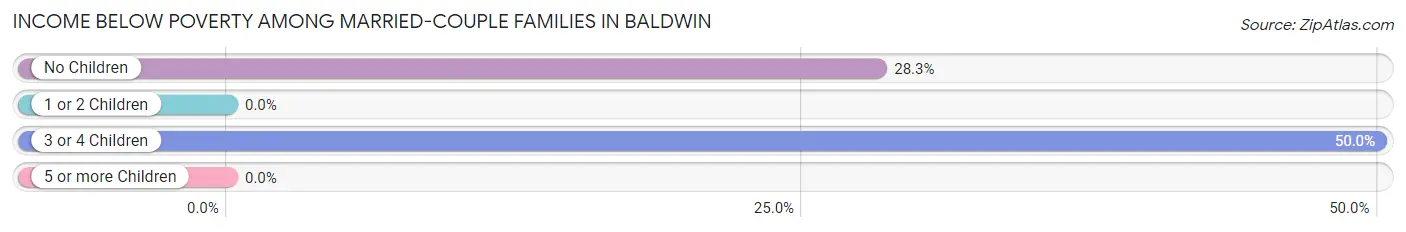
| Children | Above Poverty | Below Poverty |
| No Children | 33 (71.7%) | 13 (28.3%) |
| 1 or 2 Children | 17 (100.0%) | 0 (0.0%) |
| 3 or 4 Children | 5 (50.0%) | 5 (50.0%) |
| 5 or more Children | 0 (0.0%) | 0 (0.0%) |
| Total | 55 (75.3%) | 18 (24.7%) |
Income Below Poverty Among Single-Parent Households in Baldwin
According to the poverty data in Baldwin, 84.6% or 11 single-father households and 31.7% or 13 single-mother households are living below the poverty line. Among single-father households, those with 1 or 2 children have the highest poverty rate, with 6 households (100.0%) experiencing poverty. Likewise, among single-mother households, those with 1 or 2 children have the highest poverty rate, with 13 households (37.1%) falling below the poverty line.
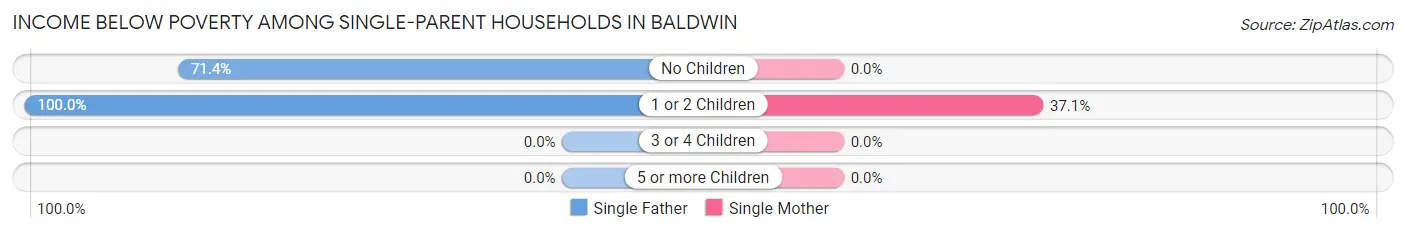
| Children | Single Father | Single Mother |
| No Children | 5 (71.4%) | 0 (0.0%) |
| 1 or 2 Children | 6 (100.0%) | 13 (37.1%) |
| 3 or 4 Children | 0 (0.0%) | 0 (0.0%) |
| 5 or more Children | 0 (0.0%) | 0 (0.0%) |
| Total | 11 (84.6%) | 13 (31.7%) |
Income Below Poverty Among Married-Couple vs Single-Parent Households in Baldwin
The poverty data for Baldwin shows that 18 of the married-couple family households (24.7%) and 24 of the single-parent households (44.4%) are living below the poverty level. Within the married-couple family households, those with 3 or 4 children have the highest poverty rate, with 5 households (50.0%) falling below the poverty line. Among the single-parent households, those with 1 or 2 children have the highest poverty rate, with 19 household (46.3%) living below poverty.
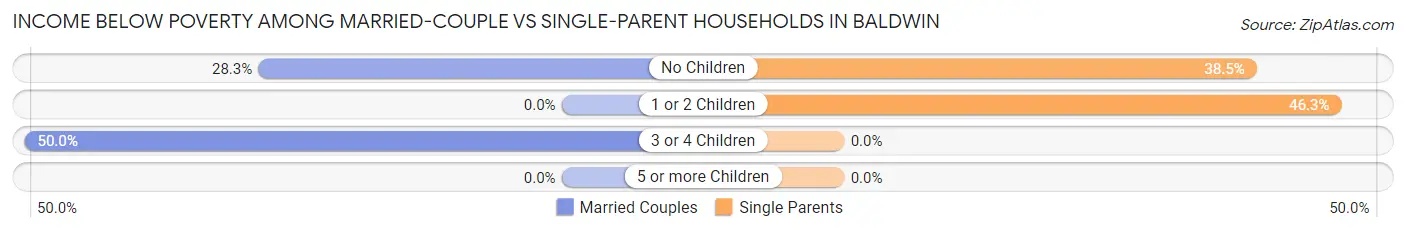
| Children | Married-Couple Families | Single-Parent Households |
| No Children | 13 (28.3%) | 5 (38.5%) |
| 1 or 2 Children | 0 (0.0%) | 19 (46.3%) |
| 3 or 4 Children | 5 (50.0%) | 0 (0.0%) |
| 5 or more Children | 0 (0.0%) | 0 (0.0%) |
| Total | 18 (24.7%) | 24 (44.4%) |
Race in Baldwin
The most populous races in Baldwin are White / Caucasian (700 | 68.0%), Black / African American (256 | 24.8%), and Hispanic or Latino (59 | 5.7%).
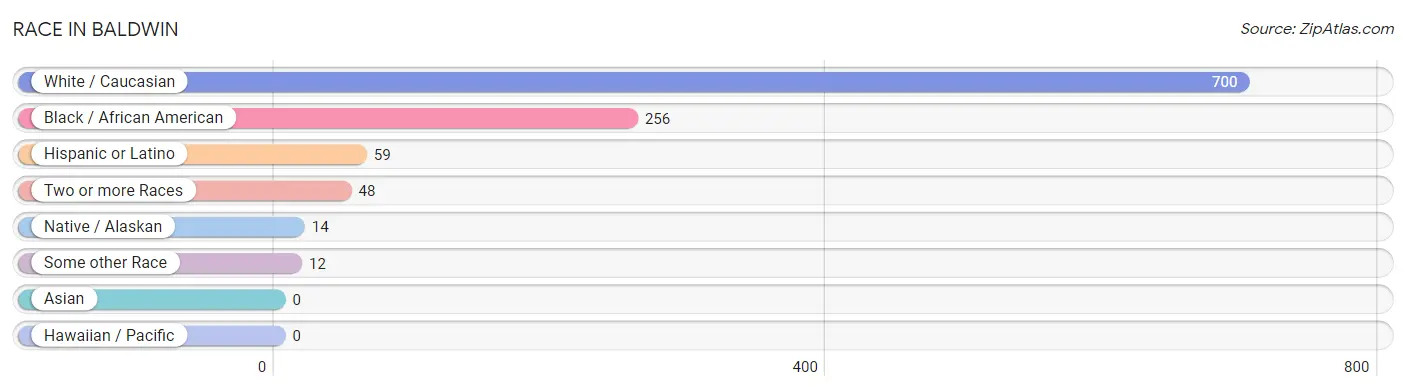
| Race | # Population | % Population |
| Asian | 0 | 0.0% |
| Black / African American | 256 | 24.8% |
| Hawaiian / Pacific | 0 | 0.0% |
| Hispanic or Latino | 59 | 5.7% |
| Native / Alaskan | 14 | 1.4% |
| White / Caucasian | 700 | 68.0% |
| Two or more Races | 48 | 4.7% |
| Some other Race | 12 | 1.2% |
| Total | 1,030 | 100.0% |
Ancestry in Baldwin
The most populous ancestries reported in Baldwin are Irish (121 | 11.7%), Polish (109 | 10.6%), German (85 | 8.3%), Swedish (61 | 5.9%), and Welsh (61 | 5.9%), together accounting for 42.4% of all Baldwin residents.
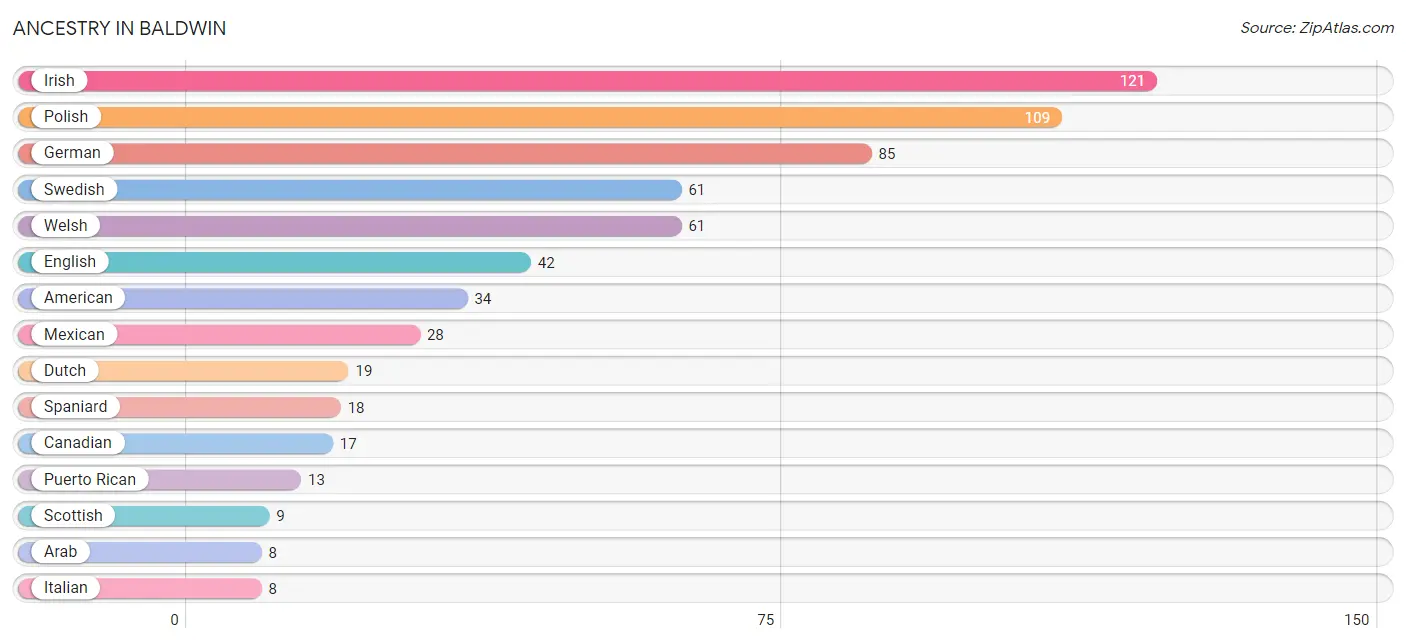
| Ancestry | # Population | % Population |
| American | 34 | 3.3% |
| Arab | 8 | 0.8% |
| Blackfeet | 1 | 0.1% |
| Canadian | 17 | 1.7% |
| Dutch | 19 | 1.8% |
| Eastern European | 2 | 0.2% |
| English | 42 | 4.1% |
| European | 4 | 0.4% |
| Finnish | 1 | 0.1% |
| French | 5 | 0.5% |
| German | 85 | 8.3% |
| Greek | 6 | 0.6% |
| Irish | 121 | 11.7% |
| Italian | 8 | 0.8% |
| Lithuanian | 4 | 0.4% |
| Mexican | 28 | 2.7% |
| Polish | 109 | 10.6% |
| Potawatomi | 3 | 0.3% |
| Puerto Rican | 13 | 1.3% |
| Scotch-Irish | 5 | 0.5% |
| Scottish | 9 | 0.9% |
| Spaniard | 18 | 1.8% |
| Swedish | 61 | 5.9% |
| Syrian | 8 | 0.8% |
| Welsh | 61 | 5.9% | View All 25 Rows |
Immigrants in Baldwin
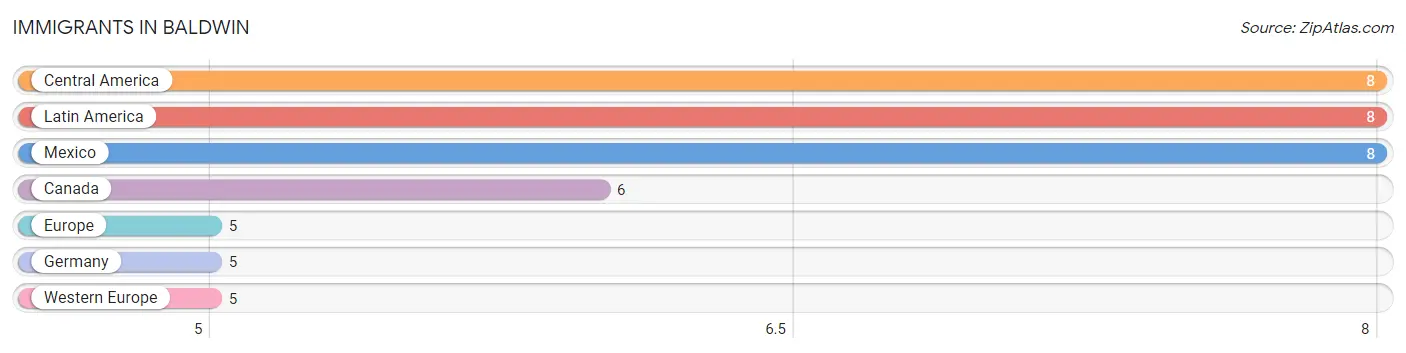
The most numerous immigrant groups reported in Baldwin came from Central America (8 | 0.8%), Latin America (8 | 0.8%), Mexico (8 | 0.8%), Canada (6 | 0.6%), and Europe (5 | 0.5%), together accounting for 3.4% of all Baldwin residents.
| Immigration Origin | # Population | % Population |
| Canada | 6 | 0.6% |
| Central America | 8 | 0.8% |
| Europe | 5 | 0.5% |
| Germany | 5 | 0.5% |
| Latin America | 8 | 0.8% |
| Mexico | 8 | 0.8% |
| Western Europe | 5 | 0.5% | View All 7 Rows |
Sex and Age in Baldwin
Sex and Age in Baldwin
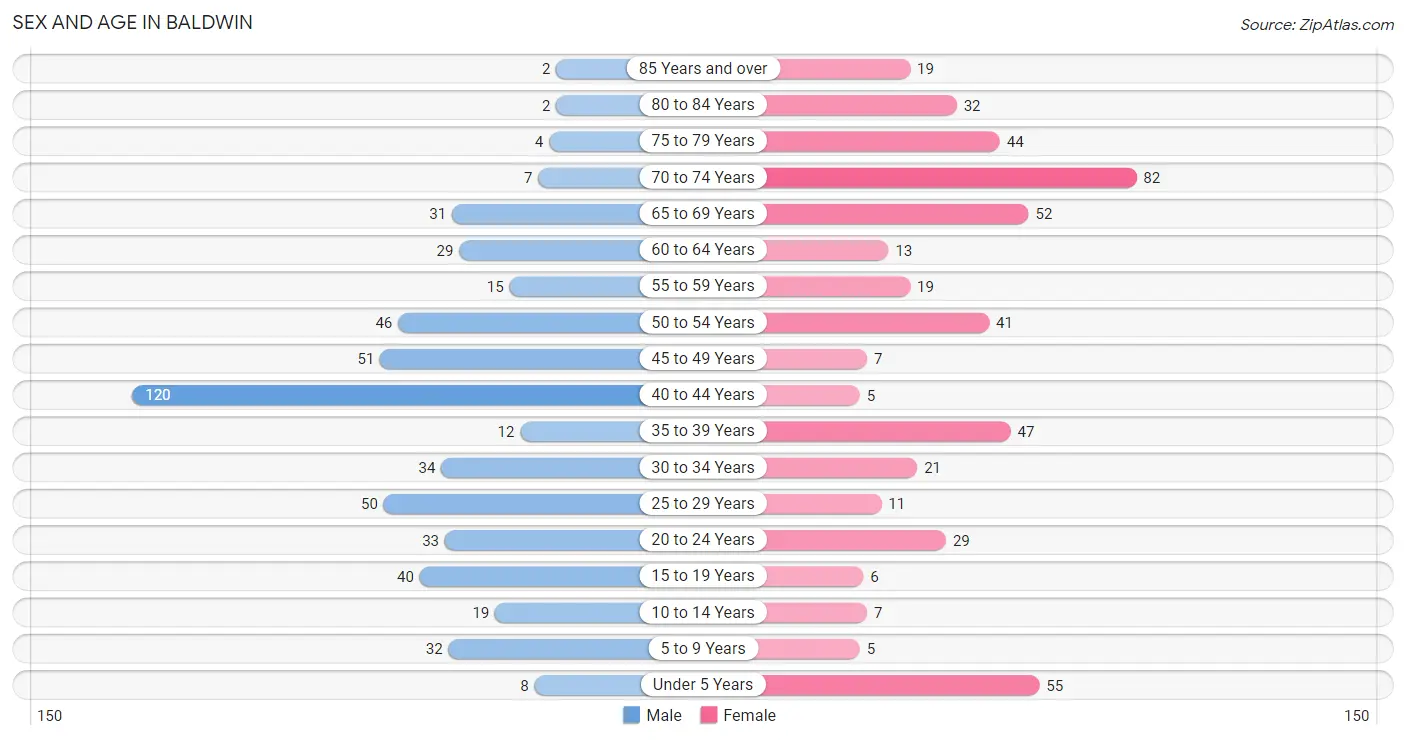
The most populous age groups in Baldwin are 40 to 44 Years (120 | 22.4%) for men and 70 to 74 Years (82 | 16.6%) for women.
| Age Bracket | Male | Female |
| Under 5 Years | 8 (1.5%) | 55 (11.1%) |
| 5 to 9 Years | 32 (6.0%) | 5 (1.0%) |
| 10 to 14 Years | 19 (3.5%) | 7 (1.4%) |
| 15 to 19 Years | 40 (7.5%) | 6 (1.2%) |
| 20 to 24 Years | 33 (6.2%) | 29 (5.9%) |
| 25 to 29 Years | 50 (9.3%) | 11 (2.2%) |
| 30 to 34 Years | 34 (6.4%) | 21 (4.2%) |
| 35 to 39 Years | 12 (2.2%) | 47 (9.5%) |
| 40 to 44 Years | 120 (22.4%) | 5 (1.0%) |
| 45 to 49 Years | 51 (9.5%) | 7 (1.4%) |
| 50 to 54 Years | 46 (8.6%) | 41 (8.3%) |
| 55 to 59 Years | 15 (2.8%) | 19 (3.8%) |
| 60 to 64 Years | 29 (5.4%) | 13 (2.6%) |
| 65 to 69 Years | 31 (5.8%) | 52 (10.5%) |
| 70 to 74 Years | 7 (1.3%) | 82 (16.6%) |
| 75 to 79 Years | 4 (0.7%) | 44 (8.9%) |
| 80 to 84 Years | 2 (0.4%) | 32 (6.5%) |
| 85 Years and over | 2 (0.4%) | 19 (3.8%) |
| Total | 535 (100.0%) | 495 (100.0%) |
Families and Households in Baldwin
Median Family Size in Baldwin
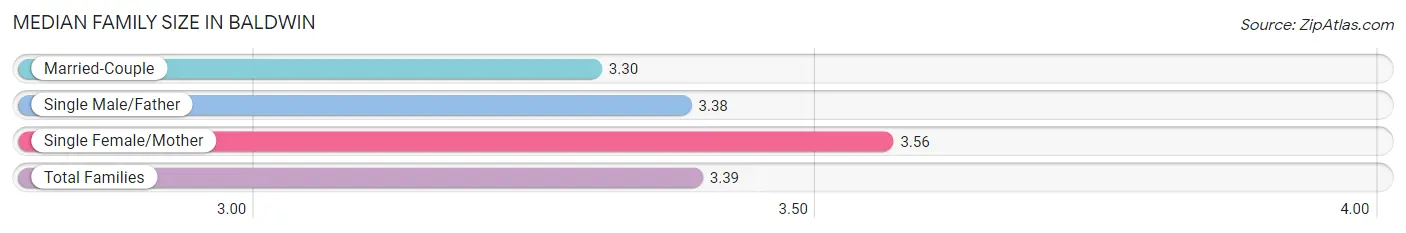
The median family size in Baldwin is 3.39 persons per family, with single female/mother families (41 | 32.3%) accounting for the largest median family size of 3.56 persons per family. On the other hand, married-couple families (73 | 57.5%) represent the smallest median family size with 3.30 persons per family.
| Family Type | # Families | Family Size |
| Married-Couple | 73 (57.5%) | 3.30 |
| Single Male/Father | 13 (10.2%) | 3.38 |
| Single Female/Mother | 41 (32.3%) | 3.56 |
| Total Families | 127 (100.0%) | 3.39 |
Median Household Size in Baldwin
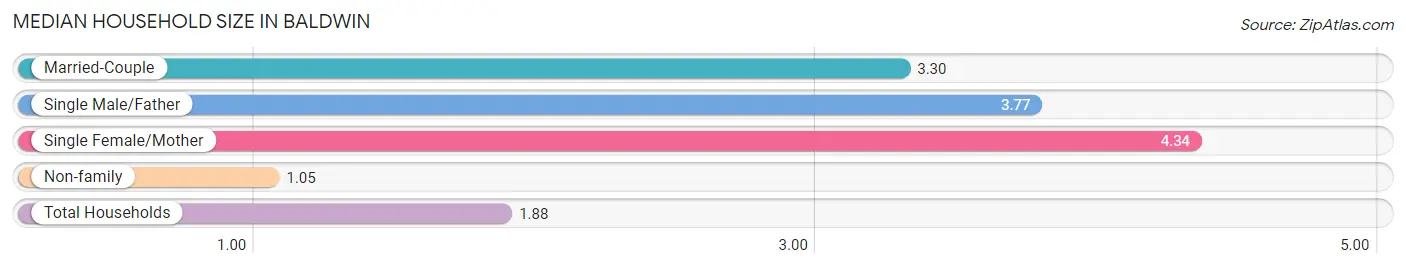
The median household size in Baldwin is 1.88 persons per household, with single female/mother households (41 | 10.1%) accounting for the largest median household size of 4.34 persons per household. non-family households (278 | 68.6%) represent the smallest median household size with 1.05 persons per household.
| Household Type | # Households | Household Size |
| Married-Couple | 73 (18.0%) | 3.30 |
| Single Male/Father | 13 (3.2%) | 3.77 |
| Single Female/Mother | 41 (10.1%) | 4.34 |
| Non-family | 278 (68.6%) | 1.05 |
| Total Households | 405 (100.0%) | 1.88 |
Household Size by Marriage Status in Baldwin
Out of a total of 405 households in Baldwin, 127 (31.4%) are family households, while 278 (68.6%) are nonfamily households. The most numerous type of family households are 2-person households, comprising 67, and the most common type of nonfamily households are 1-person households, comprising 253.
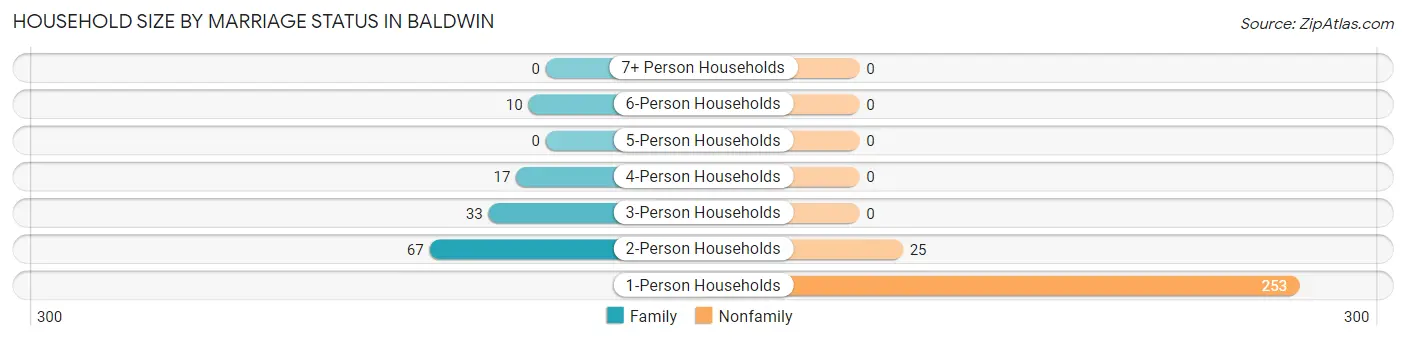
| Household Size | Family Households | Nonfamily Households |
| 1-Person Households | - | 253 (62.5%) |
| 2-Person Households | 67 (16.5%) | 25 (6.2%) |
| 3-Person Households | 33 (8.2%) | 0 (0.0%) |
| 4-Person Households | 17 (4.2%) | 0 (0.0%) |
| 5-Person Households | 0 (0.0%) | 0 (0.0%) |
| 6-Person Households | 10 (2.5%) | 0 (0.0%) |
| 7+ Person Households | 0 (0.0%) | 0 (0.0%) |
| Total | 127 (31.4%) | 278 (68.6%) |
Female Fertility in Baldwin
Fertility by Age in Baldwin
Average fertility rate in Baldwin is 145.0 births per 1,000 women. Women in the age bracket of 20 to 34 years have the highest fertility rate with 262.0 births per 1,000 women. Women in the age bracket of 20 to 34 years acount for 84.2% of all women with births.
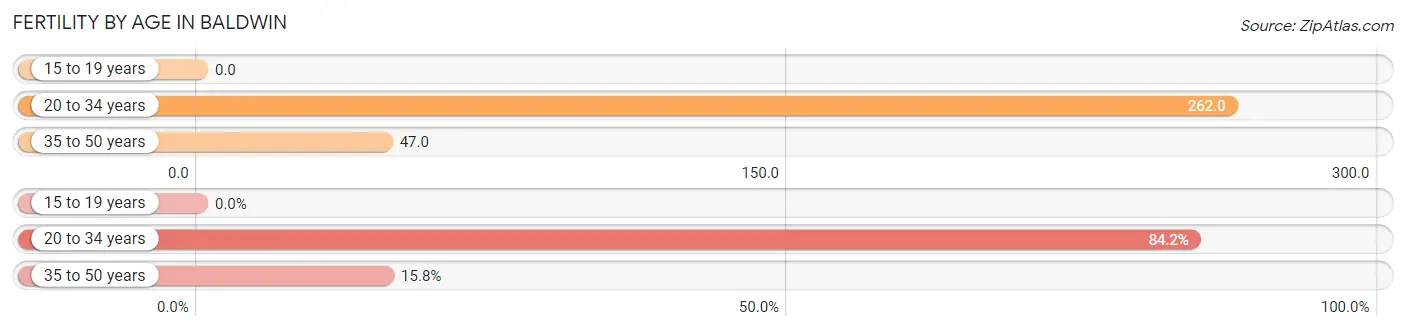
| Age Bracket | Women with Births | Births / 1,000 Women |
| 15 to 19 years | 0 (0.0%) | 0.0 |
| 20 to 34 years | 16 (84.2%) | 262.0 |
| 35 to 50 years | 3 (15.8%) | 47.0 |
| Total | 19 (100.0%) | 145.0 |
Fertility by Age by Marriage Status in Baldwin
26.3% of women with births (19) in Baldwin are married. The highest percentage of unmarried women with births falls into 35 to 50 years age bracket with 100.0% of them unmarried at the time of birth, while the lowest percentage of unmarried women with births belong to 20 to 34 years age bracket with 68.8% of them unmarried.
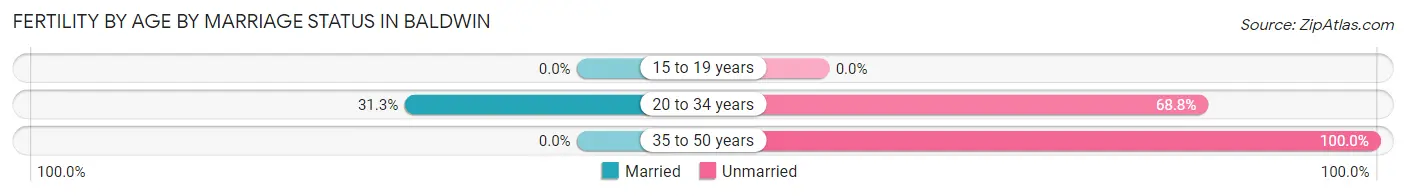
| Age Bracket | Married | Unmarried |
| 15 to 19 years | 0 (0.0%) | 0 (0.0%) |
| 20 to 34 years | 5 (31.2%) | 11 (68.8%) |
| 35 to 50 years | 0 (0.0%) | 3 (100.0%) |
| Total | 5 (26.3%) | 14 (73.7%) |
Fertility by Education in Baldwin
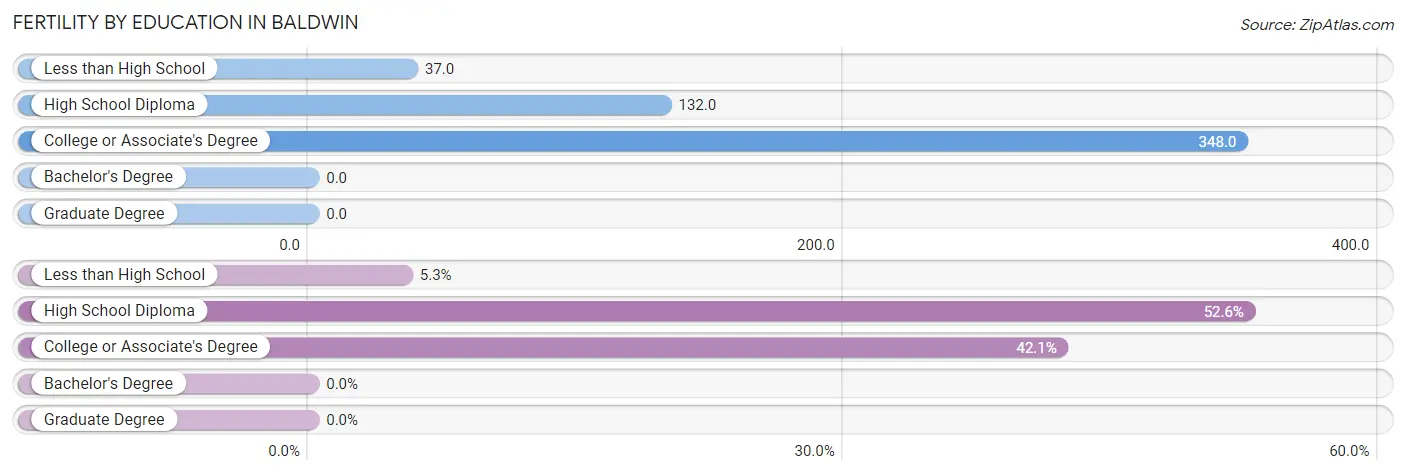
| Educational Attainment | Women with Births | Births / 1,000 Women |
| Less than High School | 1 (5.3%) | 37.0 |
| High School Diploma | 10 (52.6%) | 132.0 |
| College or Associate's Degree | 8 (42.1%) | 348.0 |
| Bachelor's Degree | 0 (0.0%) | 0.0 |
| Graduate Degree | 0 (0.0%) | 0.0 |
| Total | 19 (100.0%) | 145.0 |
Fertility by Education by Marriage Status in Baldwin
73.7% of women with births in Baldwin are unmarried. Women with the educational attainment of college or associate's degree are most likely to be married with 62.5% of them married at childbirth, while women with the educational attainment of less than high school are least likely to be married with 100.0% of them unmarried at childbirth.
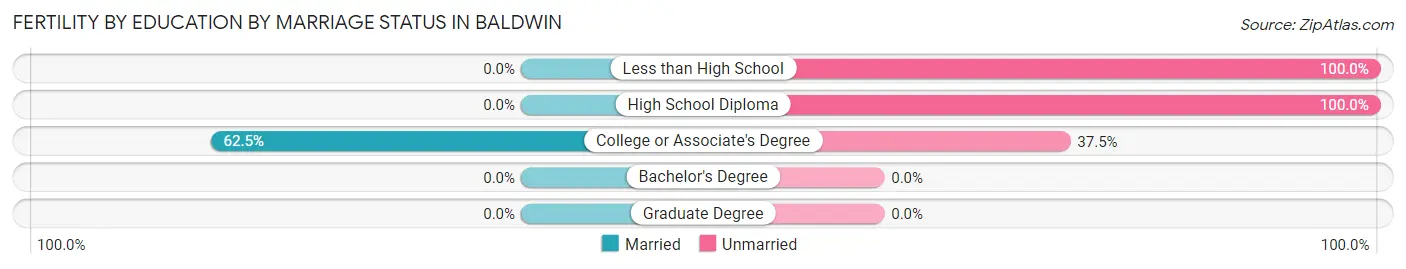
| Educational Attainment | Married | Unmarried |
| Less than High School | 0 (0.0%) | 1 (100.0%) |
| High School Diploma | 0 (0.0%) | 10 (100.0%) |
| College or Associate's Degree | 5 (62.5%) | 3 (37.5%) |
| Bachelor's Degree | 0 (0.0%) | 0 (0.0%) |
| Graduate Degree | 0 (0.0%) | 0 (0.0%) |
| Total | 5 (26.3%) | 14 (73.7%) |
Employment Characteristics in Baldwin
Employment by Class of Employer in Baldwin
Among the 240 employed individuals in Baldwin, private company employees (117 | 48.7%), self-employed (not incorporated) (79 | 32.9%), and local government employees (22 | 9.2%) make up the most common classes of employment.
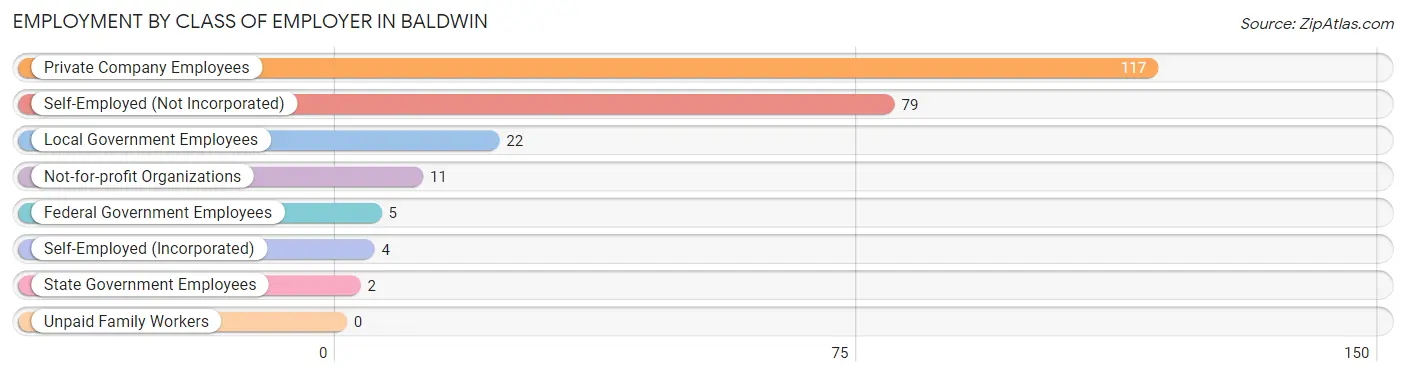
| Employer Class | # Employees | % Employees |
| Private Company Employees | 117 | 48.7% |
| Self-Employed (Incorporated) | 4 | 1.7% |
| Self-Employed (Not Incorporated) | 79 | 32.9% |
| Not-for-profit Organizations | 11 | 4.6% |
| Local Government Employees | 22 | 9.2% |
| State Government Employees | 2 | 0.8% |
| Federal Government Employees | 5 | 2.1% |
| Unpaid Family Workers | 0 | 0.0% |
| Total | 240 | 100.0% |
Employment Status by Age in Baldwin
According to the labor force statistics for Baldwin, out of the total population over 16 years of age (901), 29.6% or 267 individuals are in the labor force, with 6.4% or 17 of them unemployed. The age group with the highest labor force participation rate is 25 to 29 years, with 80.3% or 49 individuals in the labor force. Within the labor force, the 60 to 64 years age range has the highest percentage of unemployed individuals, with 100.0% or 3 of them being unemployed.
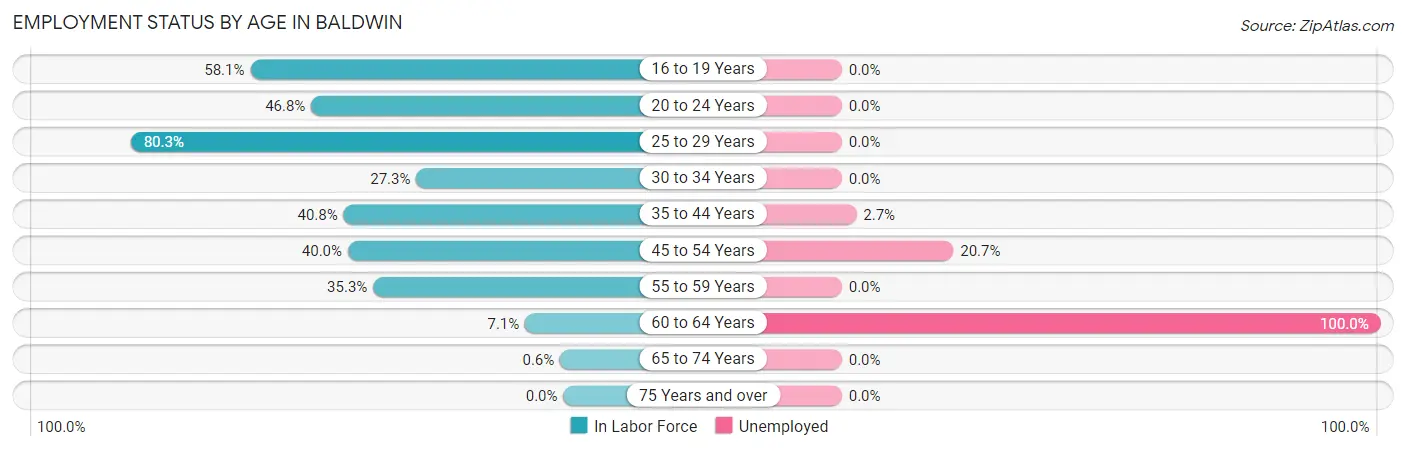
| Age Bracket | In Labor Force | Unemployed |
| 16 to 19 Years | 25 (58.1%) | 0 (0.0%) |
| 20 to 24 Years | 29 (46.8%) | 0 (0.0%) |
| 25 to 29 Years | 49 (80.3%) | 0 (0.0%) |
| 30 to 34 Years | 15 (27.3%) | 0 (0.0%) |
| 35 to 44 Years | 75 (40.8%) | 2 (2.7%) |
| 45 to 54 Years | 58 (40.0%) | 12 (20.7%) |
| 55 to 59 Years | 12 (35.3%) | 0 (0.0%) |
| 60 to 64 Years | 3 (7.1%) | 3 (100.0%) |
| 65 to 74 Years | 1 (0.6%) | 0 (0.0%) |
| 75 Years and over | 0 (0.0%) | 0 (0.0%) |
| Total | 267 (29.6%) | 17 (6.4%) |
Employment Status by Educational Attainment in Baldwin
According to labor force statistics for Baldwin, 40.7% of individuals (212) out of the total population between 25 and 64 years of age (521) are in the labor force, with 8.0% or 17 of them being unemployed. The group with the highest labor force participation rate are those with the educational attainment of bachelor's degree or higher, with 100.0% or 13 individuals in the labor force. Within the labor force, individuals with less than high school education have the highest percentage of unemployment, with 25.8% or 8 of them being unemployed.
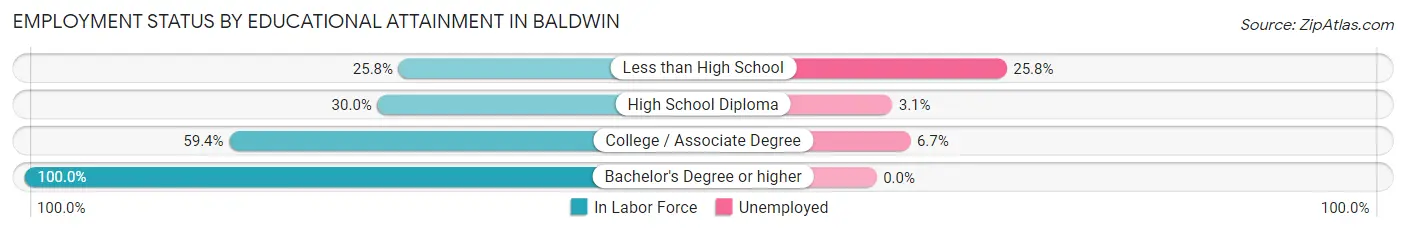
| Educational Attainment | In Labor Force | Unemployed |
| Less than High School | 31 (25.8%) | 31 (25.8%) |
| High School Diploma | 64 (30.0%) | 7 (3.1%) |
| College / Associate Degree | 104 (59.4%) | 12 (6.7%) |
| Bachelor's Degree or higher | 13 (100.0%) | 0 (0.0%) |
| Total | 212 (40.7%) | 42 (8.0%) |
Employment Occupations by Sex in Baldwin
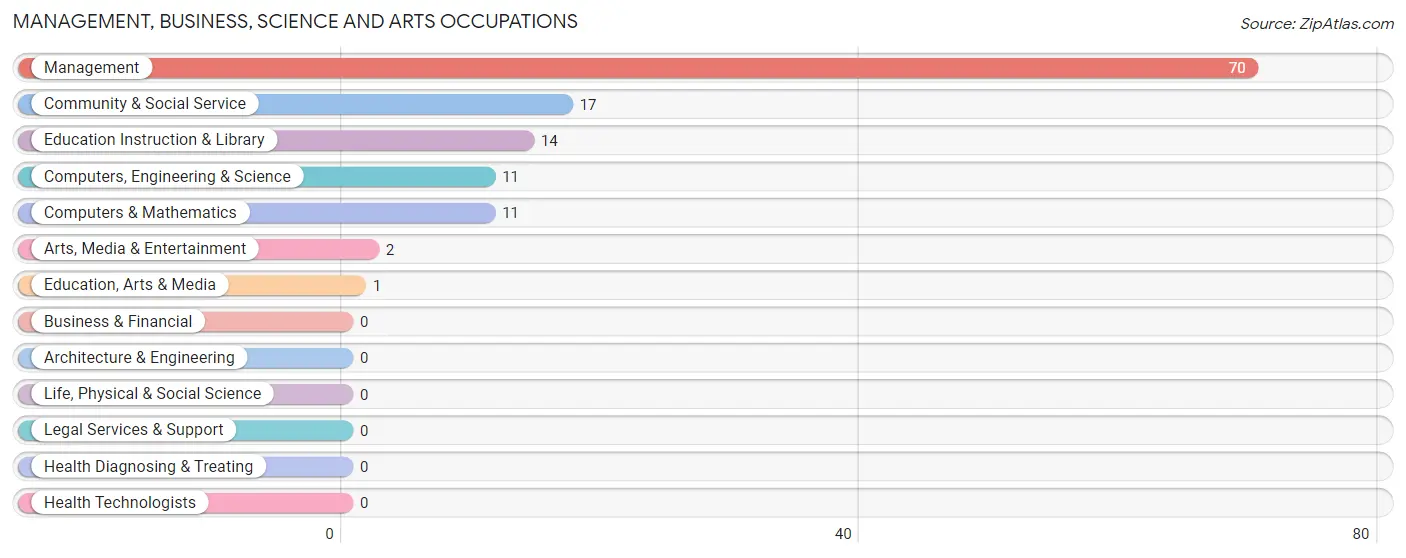
Management, Business, Science and Arts Occupations
The most common Management, Business, Science and Arts occupations in Baldwin are Management (70 | 28.0%), Community & Social Service (17 | 6.8%), Education Instruction & Library (14 | 5.6%), Computers, Engineering & Science (11 | 4.4%), and Computers & Mathematics (11 | 4.4%).
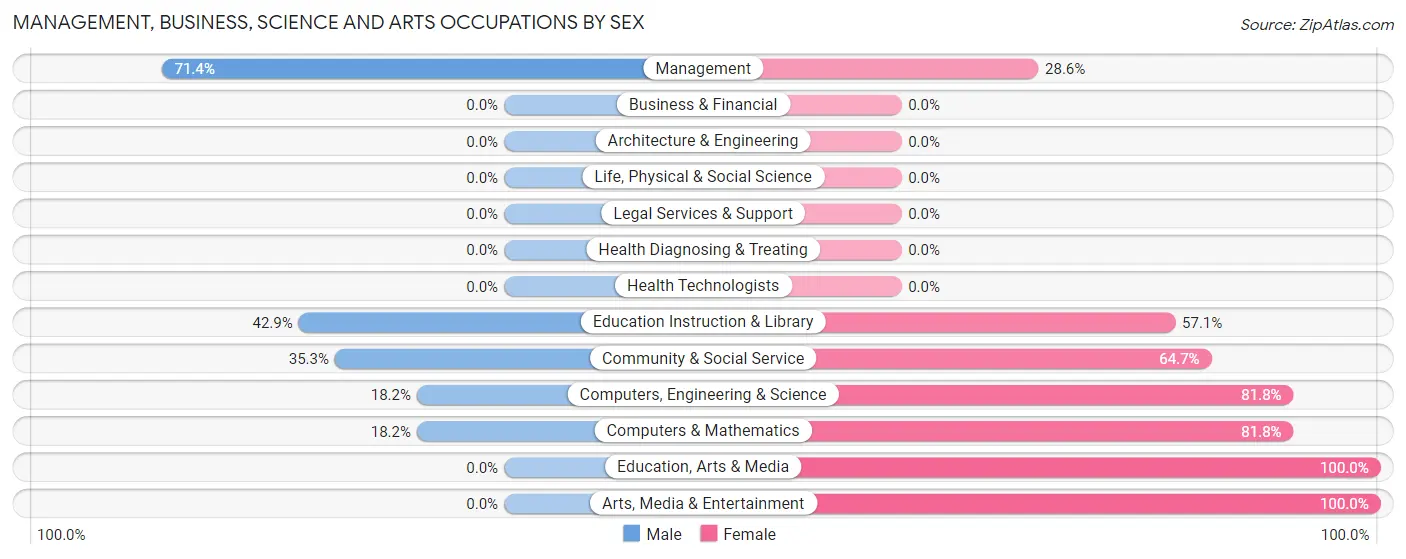
Management, Business, Science and Arts Occupations by Sex
Within the Management, Business, Science and Arts occupations in Baldwin, the most male-oriented occupations are Management (71.4%), Education Instruction & Library (42.9%), and Community & Social Service (35.3%), while the most female-oriented occupations are Education, Arts & Media (100.0%), Arts, Media & Entertainment (100.0%), and Computers, Engineering & Science (81.8%).
| Occupation | Male | Female |
| Management | 50 (71.4%) | 20 (28.6%) |
| Business & Financial | 0 (0.0%) | 0 (0.0%) |
| Computers, Engineering & Science | 2 (18.2%) | 9 (81.8%) |
| Computers & Mathematics | 2 (18.2%) | 9 (81.8%) |
| Architecture & Engineering | 0 (0.0%) | 0 (0.0%) |
| Life, Physical & Social Science | 0 (0.0%) | 0 (0.0%) |
| Community & Social Service | 6 (35.3%) | 11 (64.7%) |
| Education, Arts & Media | 0 (0.0%) | 1 (100.0%) |
| Legal Services & Support | 0 (0.0%) | 0 (0.0%) |
| Education Instruction & Library | 6 (42.9%) | 8 (57.1%) |
| Arts, Media & Entertainment | 0 (0.0%) | 2 (100.0%) |
| Health Diagnosing & Treating | 0 (0.0%) | 0 (0.0%) |
| Health Technologists | 0 (0.0%) | 0 (0.0%) |
| Total (Category) | 58 (59.2%) | 40 (40.8%) |
| Total (Overall) | 141 (56.4%) | 109 (43.6%) |
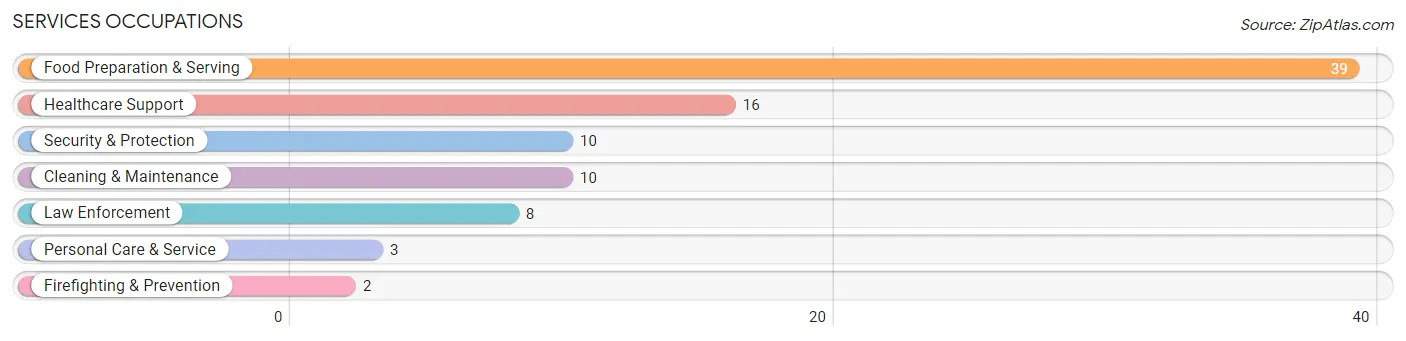
Services Occupations
The most common Services occupations in Baldwin are Food Preparation & Serving (39 | 15.6%), Healthcare Support (16 | 6.4%), Security & Protection (10 | 4.0%), Cleaning & Maintenance (10 | 4.0%), and Law Enforcement (8 | 3.2%).
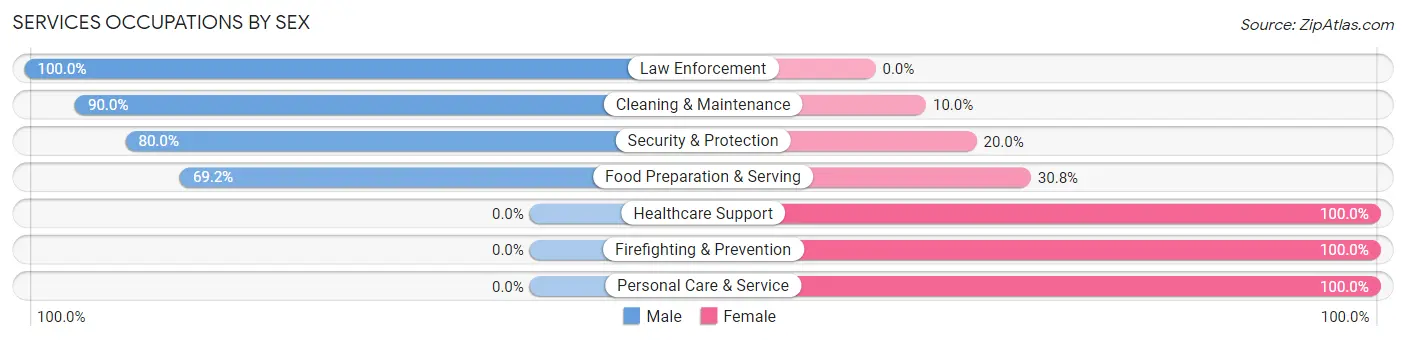
Services Occupations by Sex
Within the Services occupations in Baldwin, the most male-oriented occupations are Law Enforcement (100.0%), Cleaning & Maintenance (90.0%), and Security & Protection (80.0%), while the most female-oriented occupations are Healthcare Support (100.0%), Firefighting & Prevention (100.0%), and Personal Care & Service (100.0%).
| Occupation | Male | Female |
| Healthcare Support | 0 (0.0%) | 16 (100.0%) |
| Security & Protection | 8 (80.0%) | 2 (20.0%) |
| Firefighting & Prevention | 0 (0.0%) | 2 (100.0%) |
| Law Enforcement | 8 (100.0%) | 0 (0.0%) |
| Food Preparation & Serving | 27 (69.2%) | 12 (30.8%) |
| Cleaning & Maintenance | 9 (90.0%) | 1 (10.0%) |
| Personal Care & Service | 0 (0.0%) | 3 (100.0%) |
| Total (Category) | 44 (56.4%) | 34 (43.6%) |
| Total (Overall) | 141 (56.4%) | 109 (43.6%) |
Sales and Office Occupations
The most common Sales and Office occupations in Baldwin are , and Office & Administration (17 | 6.8%).
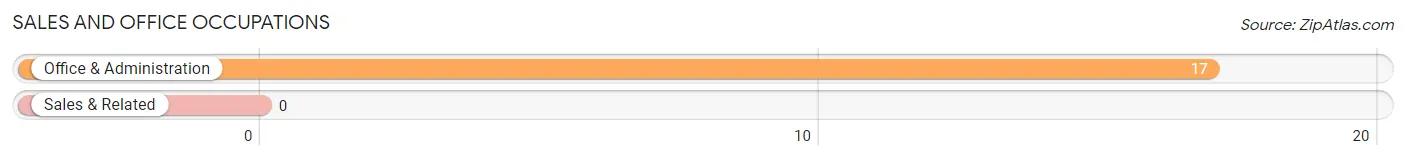
Sales and Office Occupations by Sex

| Occupation | Male | Female |
| Sales & Related | 0 (0.0%) | 0 (0.0%) |
| Office & Administration | 0 (0.0%) | 17 (100.0%) |
| Total (Category) | 0 (0.0%) | 17 (100.0%) |
| Total (Overall) | 141 (56.4%) | 109 (43.6%) |
Natural Resources, Construction and Maintenance Occupations
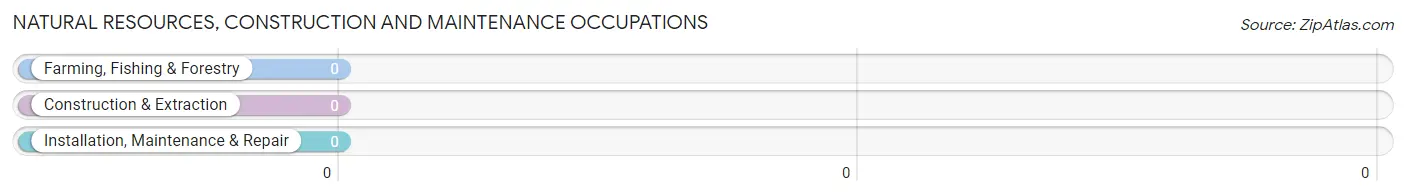
Natural Resources, Construction and Maintenance Occupations by Sex
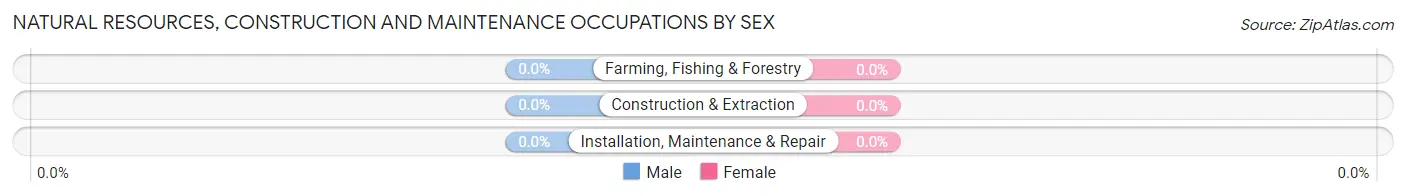
| Occupation | Male | Female |
| Farming, Fishing & Forestry | 0 (0.0%) | 0 (0.0%) |
| Construction & Extraction | 0 (0.0%) | 0 (0.0%) |
| Installation, Maintenance & Repair | 0 (0.0%) | 0 (0.0%) |
| Total (Category) | 0 (0.0%) | 0 (0.0%) |
| Total (Overall) | 141 (56.4%) | 109 (43.6%) |
Production, Transportation and Moving Occupations
The most common Production, Transportation and Moving occupations in Baldwin are Material Moving (49 | 19.6%), Transportation (5 | 2.0%), and Production (3 | 1.2%).
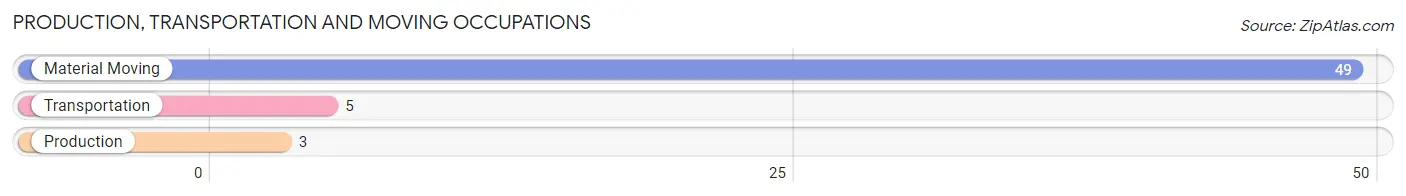
Production, Transportation and Moving Occupations by Sex
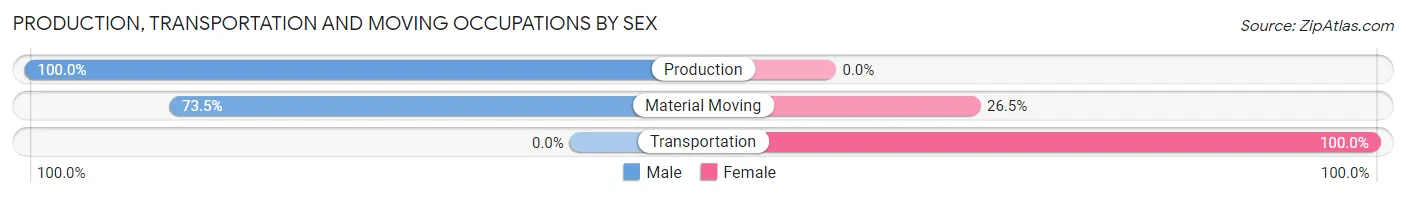
| Occupation | Male | Female |
| Production | 3 (100.0%) | 0 (0.0%) |
| Transportation | 0 (0.0%) | 5 (100.0%) |
| Material Moving | 36 (73.5%) | 13 (26.5%) |
| Total (Category) | 39 (68.4%) | 18 (31.6%) |
| Total (Overall) | 141 (56.4%) | 109 (43.6%) |
Employment Industries by Sex in Baldwin
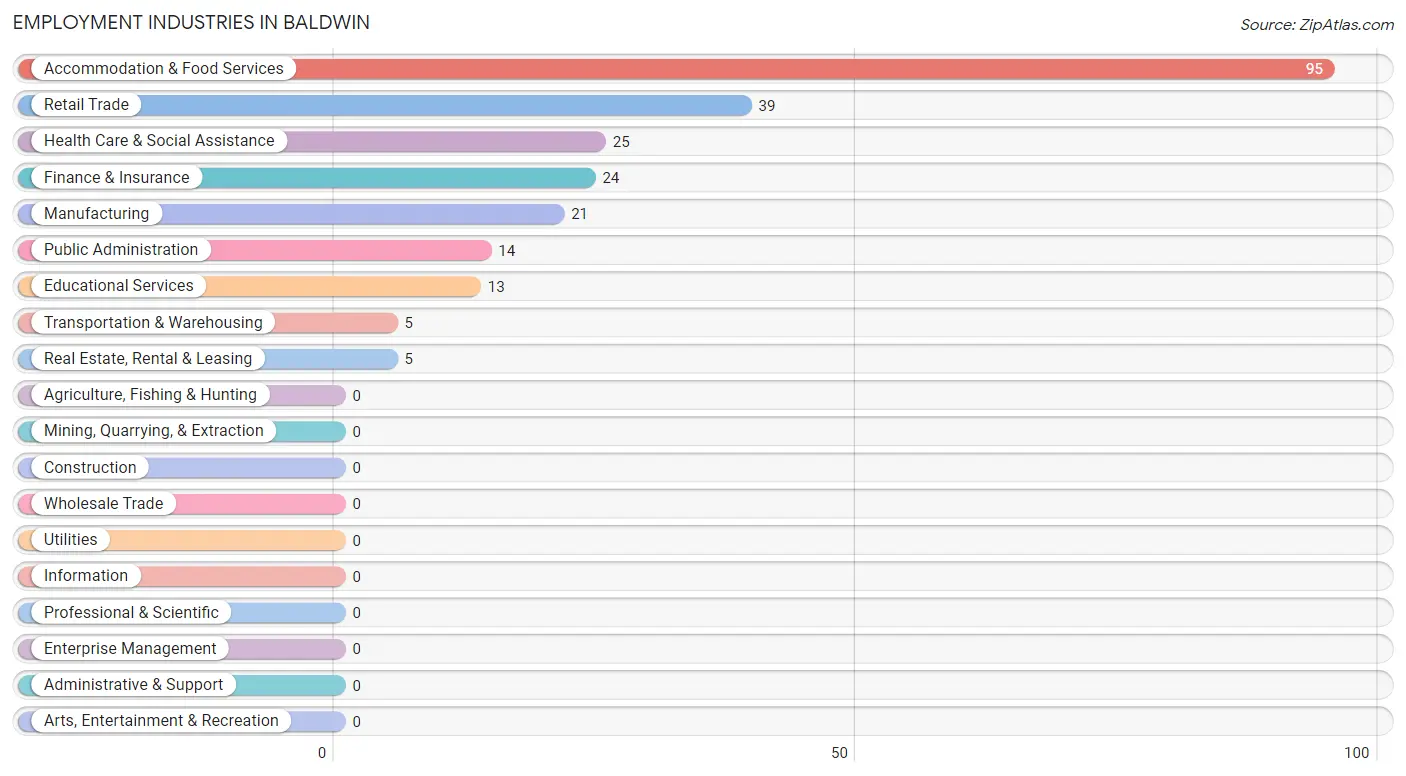
Employment Industries in Baldwin
The major employment industries in Baldwin include Accommodation & Food Services (95 | 38.0%), Retail Trade (39 | 15.6%), Health Care & Social Assistance (25 | 10.0%), Finance & Insurance (24 | 9.6%), and Manufacturing (21 | 8.4%).
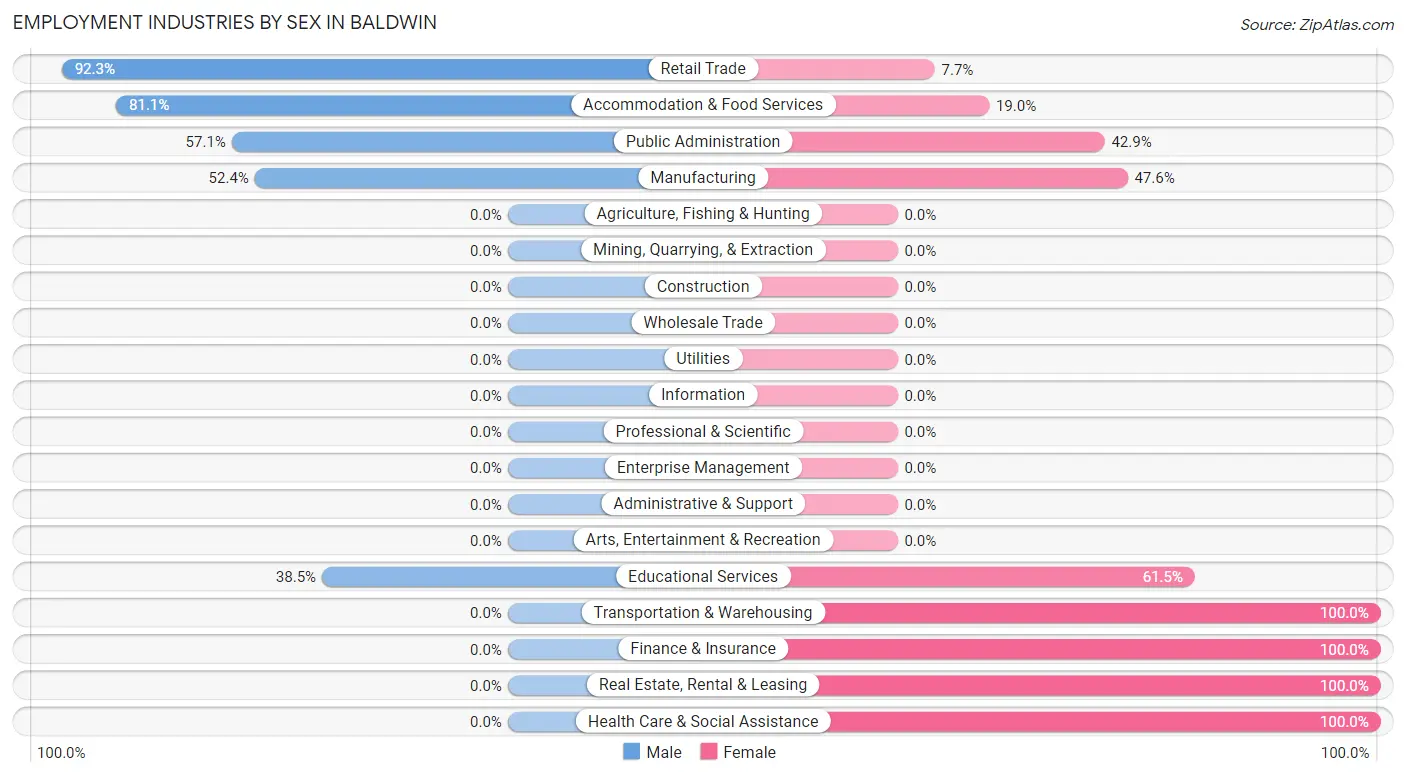
Employment Industries by Sex in Baldwin
The Baldwin industries that see more men than women are Retail Trade (92.3%), Accommodation & Food Services (81.0%), and Public Administration (57.1%), whereas the industries that tend to have a higher number of women are Transportation & Warehousing (100.0%), Finance & Insurance (100.0%), and Real Estate, Rental & Leasing (100.0%).
| Industry | Male | Female |
| Agriculture, Fishing & Hunting | 0 (0.0%) | 0 (0.0%) |
| Mining, Quarrying, & Extraction | 0 (0.0%) | 0 (0.0%) |
| Construction | 0 (0.0%) | 0 (0.0%) |
| Manufacturing | 11 (52.4%) | 10 (47.6%) |
| Wholesale Trade | 0 (0.0%) | 0 (0.0%) |
| Retail Trade | 36 (92.3%) | 3 (7.7%) |
| Transportation & Warehousing | 0 (0.0%) | 5 (100.0%) |
| Utilities | 0 (0.0%) | 0 (0.0%) |
| Information | 0 (0.0%) | 0 (0.0%) |
| Finance & Insurance | 0 (0.0%) | 24 (100.0%) |
| Real Estate, Rental & Leasing | 0 (0.0%) | 5 (100.0%) |
| Professional & Scientific | 0 (0.0%) | 0 (0.0%) |
| Enterprise Management | 0 (0.0%) | 0 (0.0%) |
| Administrative & Support | 0 (0.0%) | 0 (0.0%) |
| Educational Services | 5 (38.5%) | 8 (61.5%) |
| Health Care & Social Assistance | 0 (0.0%) | 25 (100.0%) |
| Arts, Entertainment & Recreation | 0 (0.0%) | 0 (0.0%) |
| Accommodation & Food Services | 77 (81.0%) | 18 (19.0%) |
| Public Administration | 8 (57.1%) | 6 (42.9%) |
| Total | 141 (56.4%) | 109 (43.6%) |
Education in Baldwin
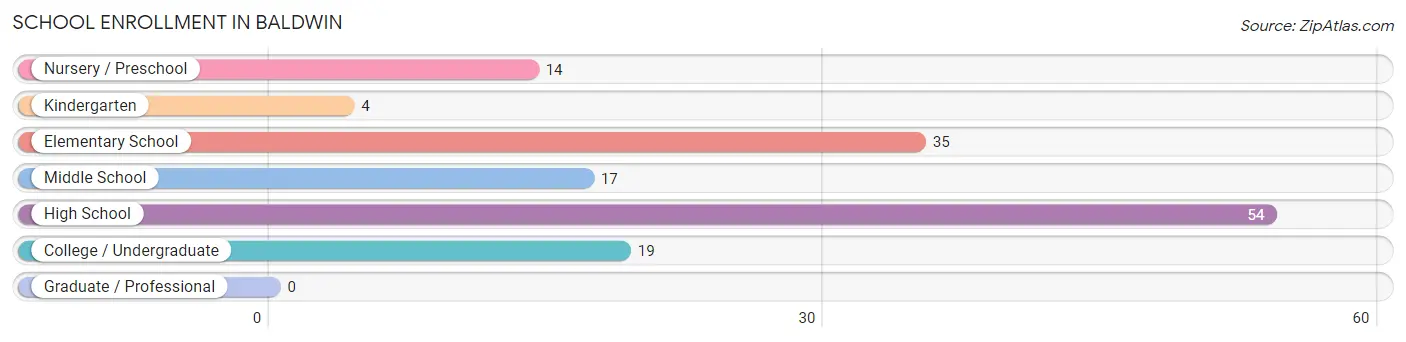
School Enrollment in Baldwin
The most common levels of schooling among the 143 students in Baldwin are high school (54 | 37.8%), elementary school (35 | 24.5%), and college / undergraduate (19 | 13.3%).
| School Level | # Students | % Students |
| Nursery / Preschool | 14 | 9.8% |
| Kindergarten | 4 | 2.8% |
| Elementary School | 35 | 24.5% |
| Middle School | 17 | 11.9% |
| High School | 54 | 37.8% |
| College / Undergraduate | 19 | 13.3% |
| Graduate / Professional | 0 | 0.0% |
| Total | 143 | 100.0% |
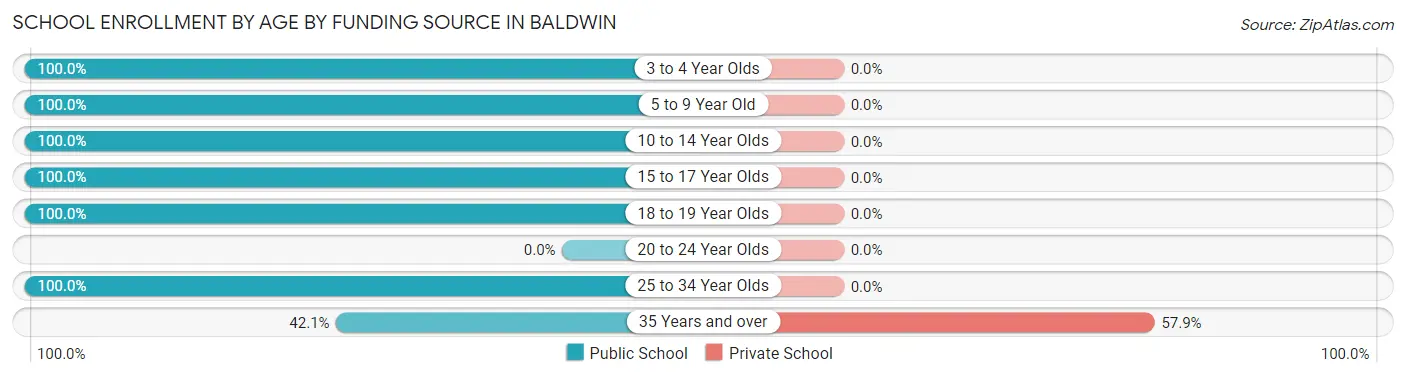
School Enrollment by Age by Funding Source in Baldwin
Out of a total of 143 students who are enrolled in schools in Baldwin, 11 (7.7%) attend a private institution, while the remaining 132 (92.3%) are enrolled in public schools. The age group of 35 years and over has the highest likelihood of being enrolled in private schools, with 11 (57.9% in the age bracket) enrolled. Conversely, the age group of 3 to 4 year olds has the lowest likelihood of being enrolled in a private school, with 7 (100.0% in the age bracket) attending a public institution.
| Age Bracket | Public School | Private School |
| 3 to 4 Year Olds | 7 (100.0%) | 0 (0.0%) |
| 5 to 9 Year Old | 37 (100.0%) | 0 (0.0%) |
| 10 to 14 Year Olds | 26 (100.0%) | 0 (0.0%) |
| 15 to 17 Year Olds | 16 (100.0%) | 0 (0.0%) |
| 18 to 19 Year Olds | 30 (100.0%) | 0 (0.0%) |
| 20 to 24 Year Olds | 0 (0.0%) | 0 (0.0%) |
| 25 to 34 Year Olds | 8 (100.0%) | 0 (0.0%) |
| 35 Years and over | 8 (42.1%) | 11 (57.9%) |
| Total | 132 (92.3%) | 11 (7.7%) |
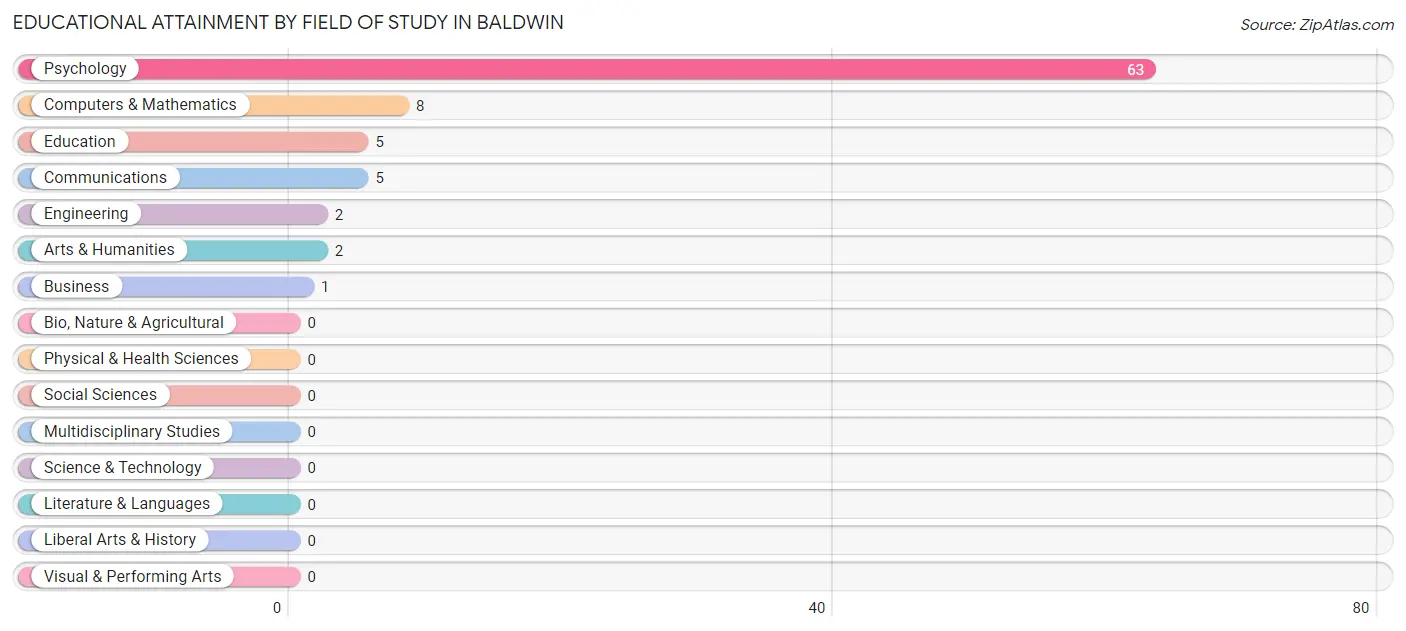
Educational Attainment by Field of Study in Baldwin
Psychology (63 | 73.3%), computers & mathematics (8 | 9.3%), education (5 | 5.8%), communications (5 | 5.8%), and engineering (2 | 2.3%) are the most common fields of study among 86 individuals in Baldwin who have obtained a bachelor's degree or higher.
| Field of Study | # Graduates | % Graduates |
| Computers & Mathematics | 8 | 9.3% |
| Bio, Nature & Agricultural | 0 | 0.0% |
| Physical & Health Sciences | 0 | 0.0% |
| Psychology | 63 | 73.3% |
| Social Sciences | 0 | 0.0% |
| Engineering | 2 | 2.3% |
| Multidisciplinary Studies | 0 | 0.0% |
| Science & Technology | 0 | 0.0% |
| Business | 1 | 1.2% |
| Education | 5 | 5.8% |
| Literature & Languages | 0 | 0.0% |
| Liberal Arts & History | 0 | 0.0% |
| Visual & Performing Arts | 0 | 0.0% |
| Communications | 5 | 5.8% |
| Arts & Humanities | 2 | 2.3% |
| Total | 86 | 100.0% |
Transportation & Commute in Baldwin
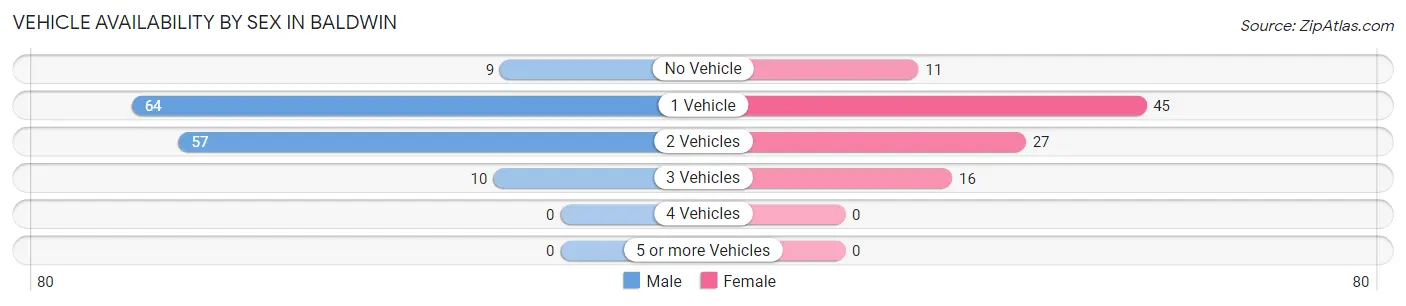
Vehicle Availability by Sex in Baldwin
The most prevalent vehicle ownership categories in Baldwin are males with 1 vehicle (64, accounting for 45.7%) and females with 1 vehicle (45, making up 64.6%).
| Vehicles Available | Male | Female |
| No Vehicle | 9 (6.4%) | 11 (11.1%) |
| 1 Vehicle | 64 (45.7%) | 45 (45.5%) |
| 2 Vehicles | 57 (40.7%) | 27 (27.3%) |
| 3 Vehicles | 10 (7.1%) | 16 (16.2%) |
| 4 Vehicles | 0 (0.0%) | 0 (0.0%) |
| 5 or more Vehicles | 0 (0.0%) | 0 (0.0%) |
| Total | 140 (100.0%) | 99 (100.0%) |
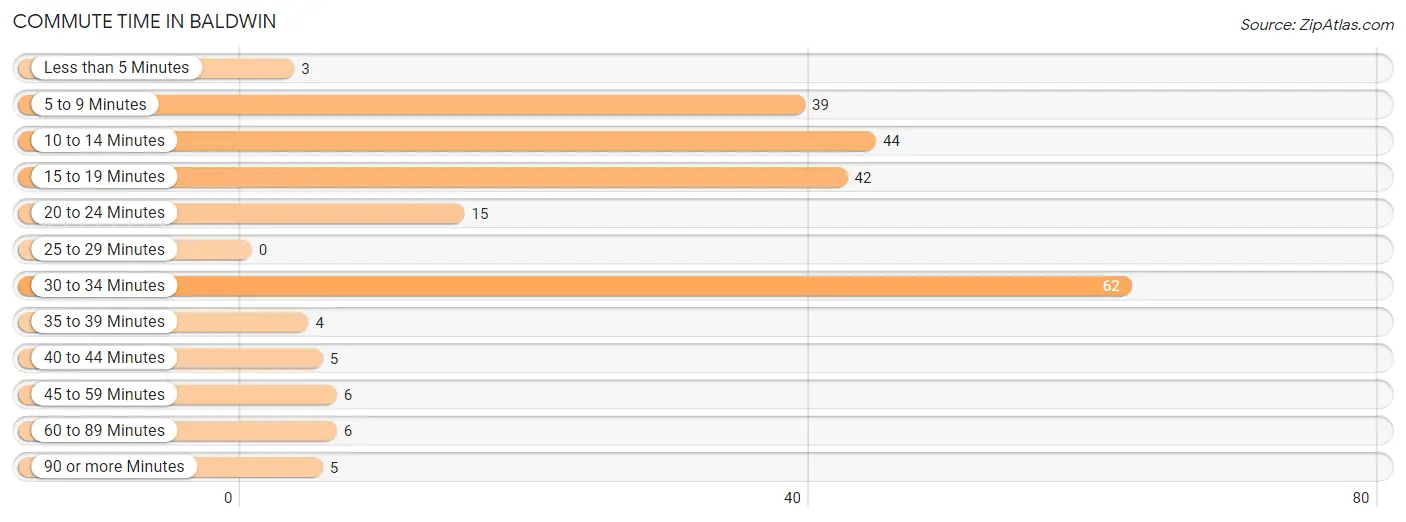
Commute Time in Baldwin
The most frequently occuring commute durations in Baldwin are 30 to 34 minutes (62 commuters, 26.8%), 10 to 14 minutes (44 commuters, 19.1%), and 15 to 19 minutes (42 commuters, 18.2%).
| Commute Time | # Commuters | % Commuters |
| Less than 5 Minutes | 3 | 1.3% |
| 5 to 9 Minutes | 39 | 16.9% |
| 10 to 14 Minutes | 44 | 19.1% |
| 15 to 19 Minutes | 42 | 18.2% |
| 20 to 24 Minutes | 15 | 6.5% |
| 25 to 29 Minutes | 0 | 0.0% |
| 30 to 34 Minutes | 62 | 26.8% |
| 35 to 39 Minutes | 4 | 1.7% |
| 40 to 44 Minutes | 5 | 2.2% |
| 45 to 59 Minutes | 6 | 2.6% |
| 60 to 89 Minutes | 6 | 2.6% |
| 90 or more Minutes | 5 | 2.2% |
Commute Time by Sex in Baldwin
The most common commute times in Baldwin are 30 to 34 minutes (50 commuters, 35.5%) for males and 5 to 9 minutes (29 commuters, 32.2%) for females.
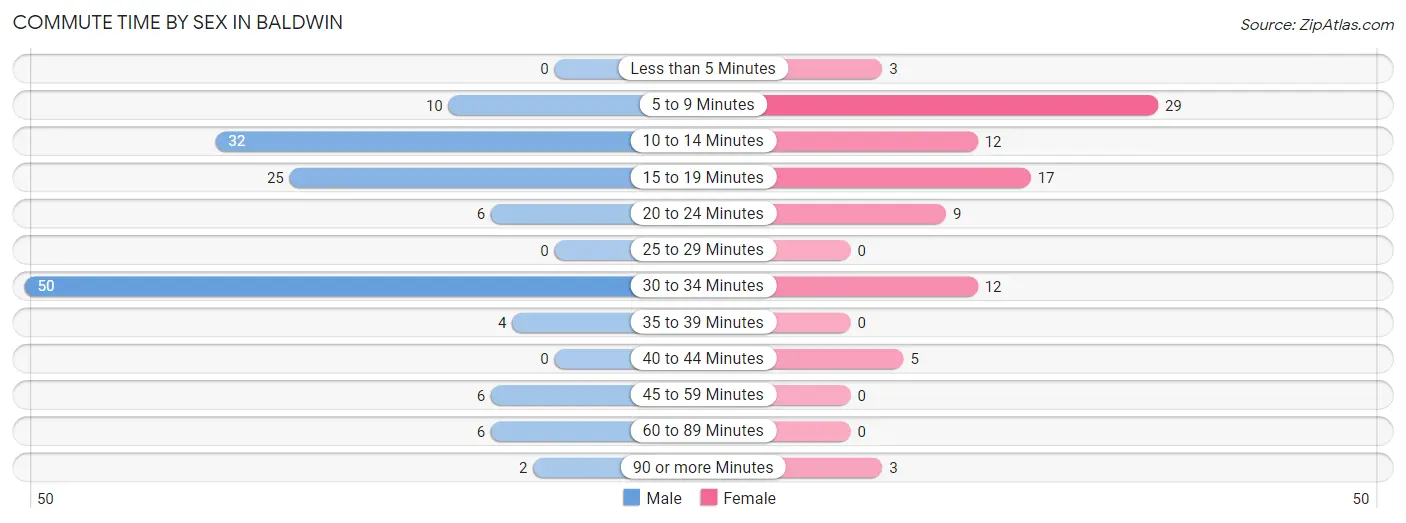
| Commute Time | Male | Female |
| Less than 5 Minutes | 0 (0.0%) | 3 (3.3%) |
| 5 to 9 Minutes | 10 (7.1%) | 29 (32.2%) |
| 10 to 14 Minutes | 32 (22.7%) | 12 (13.3%) |
| 15 to 19 Minutes | 25 (17.7%) | 17 (18.9%) |
| 20 to 24 Minutes | 6 (4.3%) | 9 (10.0%) |
| 25 to 29 Minutes | 0 (0.0%) | 0 (0.0%) |
| 30 to 34 Minutes | 50 (35.5%) | 12 (13.3%) |
| 35 to 39 Minutes | 4 (2.8%) | 0 (0.0%) |
| 40 to 44 Minutes | 0 (0.0%) | 5 (5.6%) |
| 45 to 59 Minutes | 6 (4.3%) | 0 (0.0%) |
| 60 to 89 Minutes | 6 (4.3%) | 0 (0.0%) |
| 90 or more Minutes | 2 (1.4%) | 3 (3.3%) |
Time of Departure to Work by Sex in Baldwin
The most frequent times of departure to work in Baldwin are 8:30 AM to 8:59 AM (50, 35.5%) for males and 7:00 AM to 7:29 AM (22, 24.4%) for females.
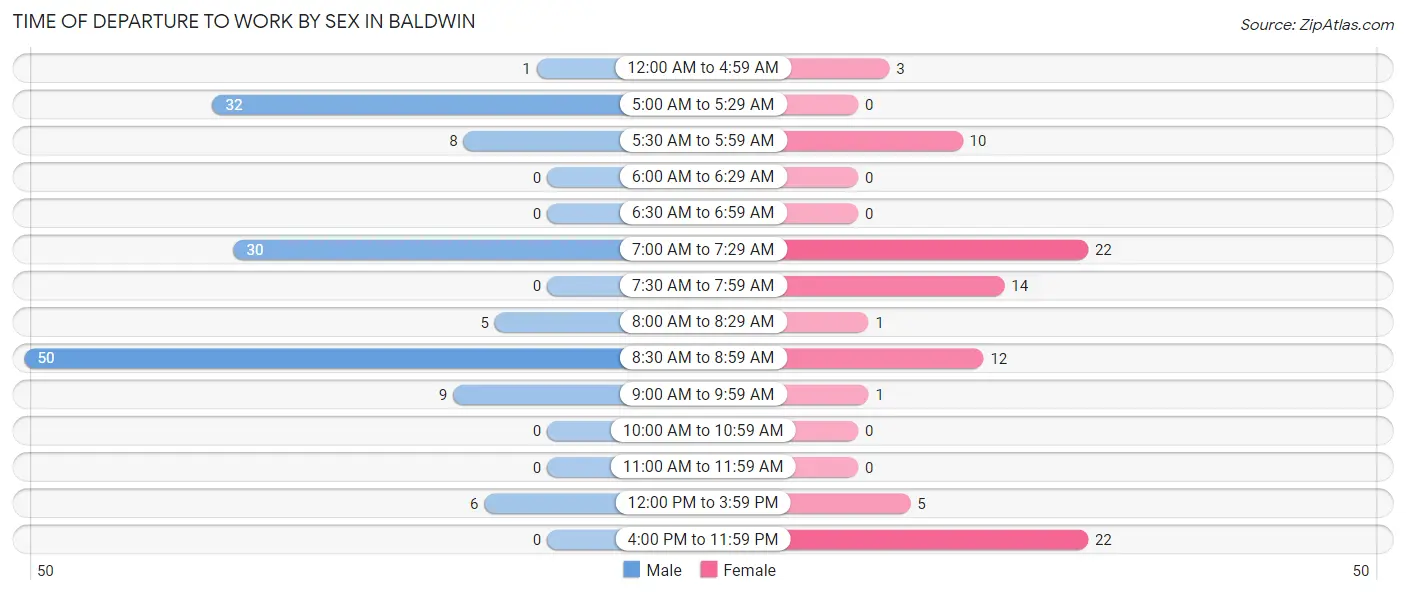
| Time of Departure | Male | Female |
| 12:00 AM to 4:59 AM | 1 (0.7%) | 3 (3.3%) |
| 5:00 AM to 5:29 AM | 32 (22.7%) | 0 (0.0%) |
| 5:30 AM to 5:59 AM | 8 (5.7%) | 10 (11.1%) |
| 6:00 AM to 6:29 AM | 0 (0.0%) | 0 (0.0%) |
| 6:30 AM to 6:59 AM | 0 (0.0%) | 0 (0.0%) |
| 7:00 AM to 7:29 AM | 30 (21.3%) | 22 (24.4%) |
| 7:30 AM to 7:59 AM | 0 (0.0%) | 14 (15.6%) |
| 8:00 AM to 8:29 AM | 5 (3.5%) | 1 (1.1%) |
| 8:30 AM to 8:59 AM | 50 (35.5%) | 12 (13.3%) |
| 9:00 AM to 9:59 AM | 9 (6.4%) | 1 (1.1%) |
| 10:00 AM to 10:59 AM | 0 (0.0%) | 0 (0.0%) |
| 11:00 AM to 11:59 AM | 0 (0.0%) | 0 (0.0%) |
| 12:00 PM to 3:59 PM | 6 (4.3%) | 5 (5.6%) |
| 4:00 PM to 11:59 PM | 0 (0.0%) | 22 (24.4%) |
| Total | 141 (100.0%) | 90 (100.0%) |
Housing Occupancy in Baldwin
Occupancy by Ownership in Baldwin
Of the total 405 dwellings in Baldwin, owner-occupied units account for 180 (44.4%), while renter-occupied units make up 225 (55.6%).
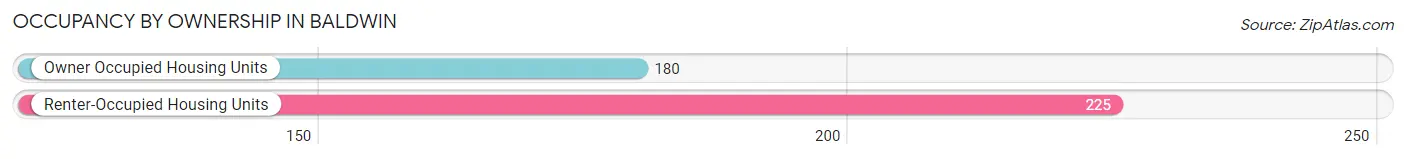
| Occupancy | # Housing Units | % Housing Units |
| Owner Occupied Housing Units | 180 | 44.4% |
| Renter-Occupied Housing Units | 225 | 55.6% |
| Total Occupied Housing Units | 405 | 100.0% |
Occupancy by Household Size in Baldwin
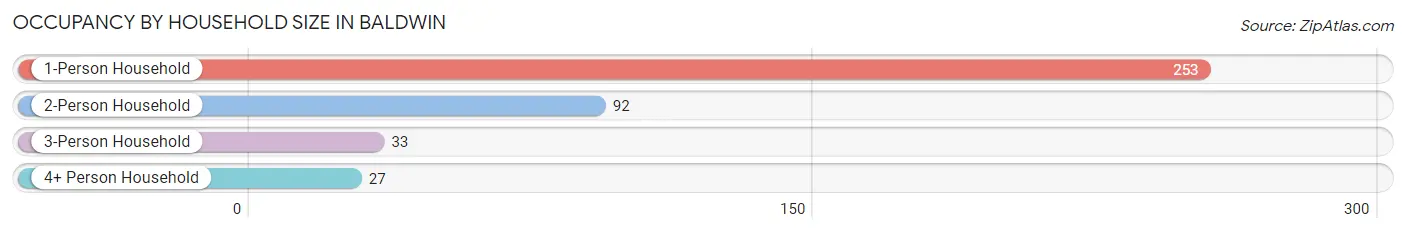
| Household Size | # Housing Units | % Housing Units |
| 1-Person Household | 253 | 62.5% |
| 2-Person Household | 92 | 22.7% |
| 3-Person Household | 33 | 8.2% |
| 4+ Person Household | 27 | 6.7% |
| Total Housing Units | 405 | 100.0% |
Occupancy by Ownership by Household Size in Baldwin
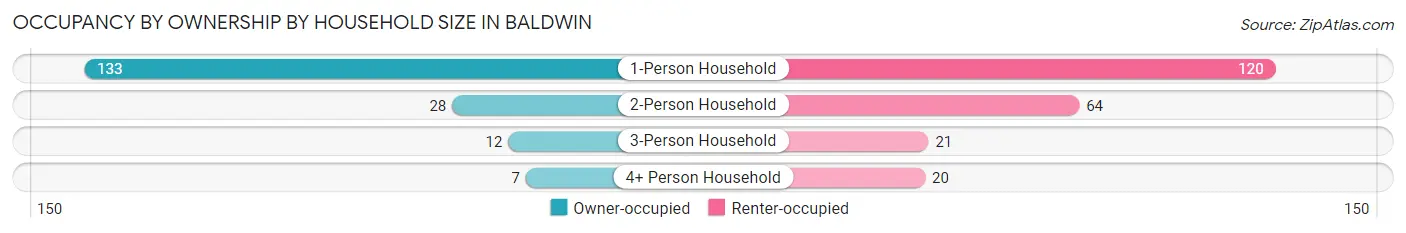
| Household Size | Owner-occupied | Renter-occupied |
| 1-Person Household | 133 (52.6%) | 120 (47.4%) |
| 2-Person Household | 28 (30.4%) | 64 (69.6%) |
| 3-Person Household | 12 (36.4%) | 21 (63.6%) |
| 4+ Person Household | 7 (25.9%) | 20 (74.1%) |
| Total Housing Units | 180 (44.4%) | 225 (55.6%) |
Occupancy by Educational Attainment in Baldwin
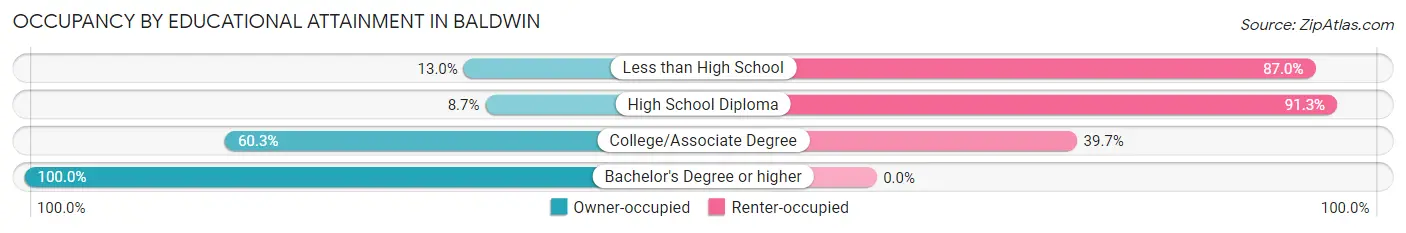
| Household Size | Owner-occupied | Renter-occupied |
| Less than High School | 7 (13.0%) | 47 (87.0%) |
| High School Diploma | 11 (8.7%) | 116 (91.3%) |
| College/Associate Degree | 94 (60.3%) | 62 (39.7%) |
| Bachelor's Degree or higher | 68 (100.0%) | 0 (0.0%) |
Occupancy by Age of Householder in Baldwin
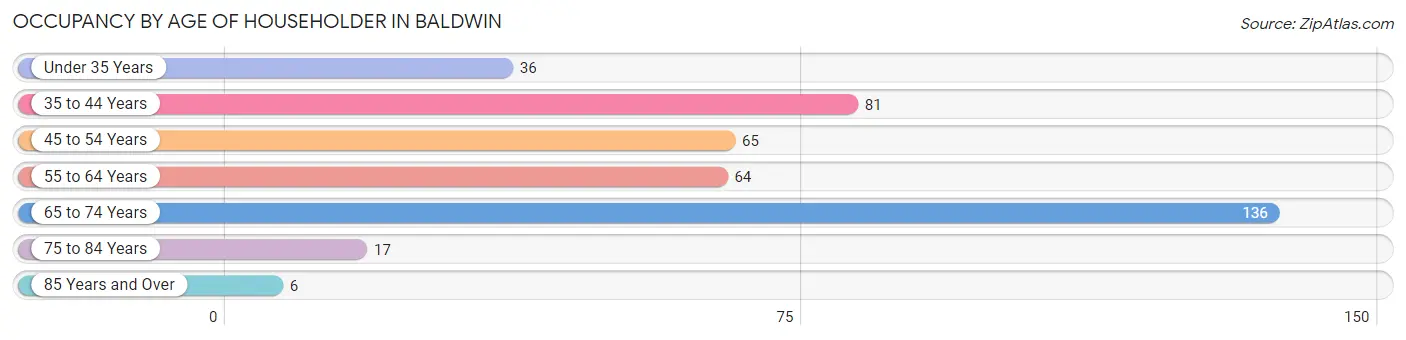
| Age Bracket | # Households | % Households |
| Under 35 Years | 36 | 8.9% |
| 35 to 44 Years | 81 | 20.0% |
| 45 to 54 Years | 65 | 16.1% |
| 55 to 64 Years | 64 | 15.8% |
| 65 to 74 Years | 136 | 33.6% |
| 75 to 84 Years | 17 | 4.2% |
| 85 Years and Over | 6 | 1.5% |
| Total | 405 | 100.0% |
Housing Finances in Baldwin
Median Income by Occupancy in Baldwin
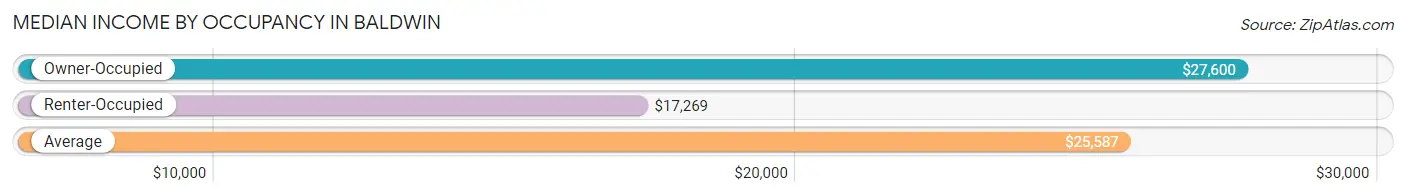
| Occupancy Type | # Households | Median Income |
| Owner-Occupied | 180 (44.4%) | $27,600 |
| Renter-Occupied | 225 (55.6%) | $17,269 |
| Average | 405 (100.0%) | $25,587 |
Occupancy by Householder Income Bracket in Baldwin
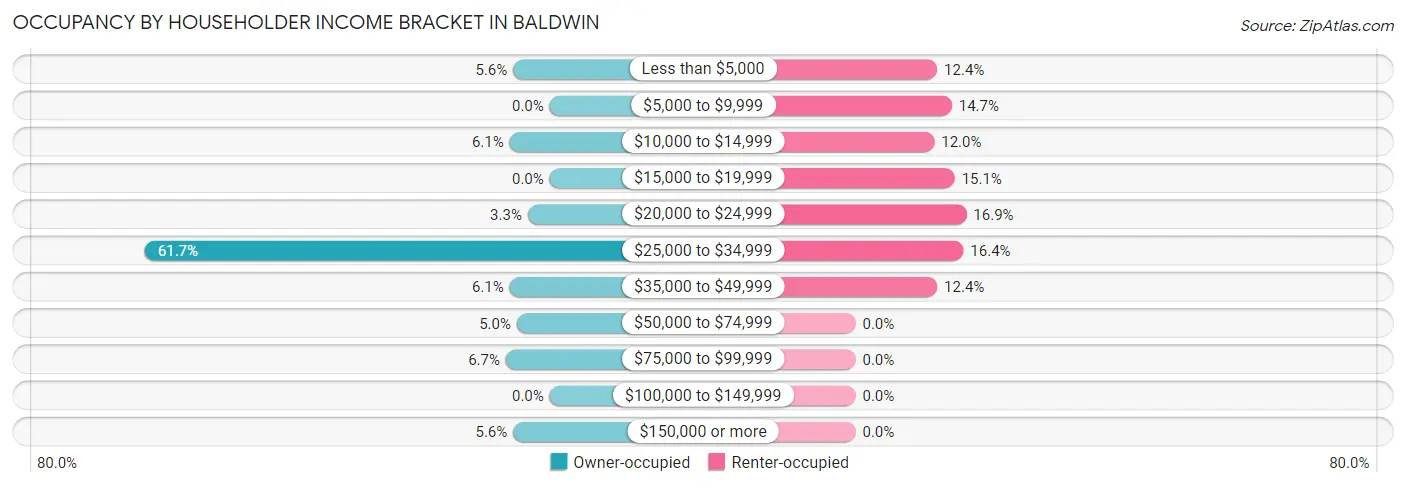
| Income Bracket | Owner-occupied | Renter-occupied |
| Less than $5,000 | 10 (5.6%) | 28 (12.4%) |
| $5,000 to $9,999 | 0 (0.0%) | 33 (14.7%) |
| $10,000 to $14,999 | 11 (6.1%) | 27 (12.0%) |
| $15,000 to $19,999 | 0 (0.0%) | 34 (15.1%) |
| $20,000 to $24,999 | 6 (3.3%) | 38 (16.9%) |
| $25,000 to $34,999 | 111 (61.7%) | 37 (16.4%) |
| $35,000 to $49,999 | 11 (6.1%) | 28 (12.4%) |
| $50,000 to $74,999 | 9 (5.0%) | 0 (0.0%) |
| $75,000 to $99,999 | 12 (6.7%) | 0 (0.0%) |
| $100,000 to $149,999 | 0 (0.0%) | 0 (0.0%) |
| $150,000 or more | 10 (5.6%) | 0 (0.0%) |
| Total | 180 (100.0%) | 225 (100.0%) |
Monthly Housing Cost Tiers in Baldwin
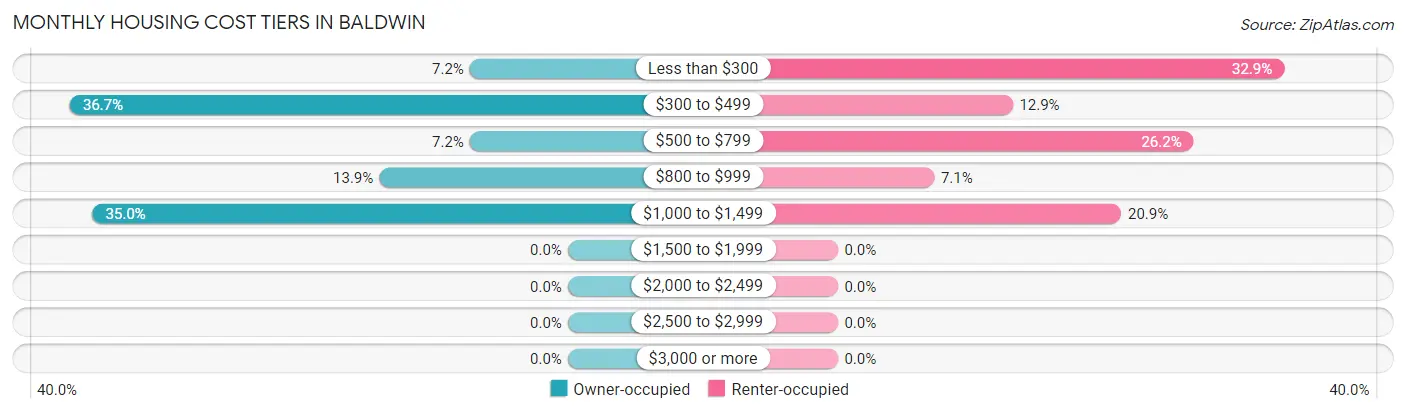
| Monthly Cost | Owner-occupied | Renter-occupied |
| Less than $300 | 13 (7.2%) | 74 (32.9%) |
| $300 to $499 | 66 (36.7%) | 29 (12.9%) |
| $500 to $799 | 13 (7.2%) | 59 (26.2%) |
| $800 to $999 | 25 (13.9%) | 16 (7.1%) |
| $1,000 to $1,499 | 63 (35.0%) | 47 (20.9%) |
| $1,500 to $1,999 | 0 (0.0%) | 0 (0.0%) |
| $2,000 to $2,499 | 0 (0.0%) | 0 (0.0%) |
| $2,500 to $2,999 | 0 (0.0%) | 0 (0.0%) |
| $3,000 or more | 0 (0.0%) | 0 (0.0%) |
| Total | 180 (100.0%) | 225 (100.0%) |
Physical Housing Characteristics in Baldwin
Housing Structures in Baldwin
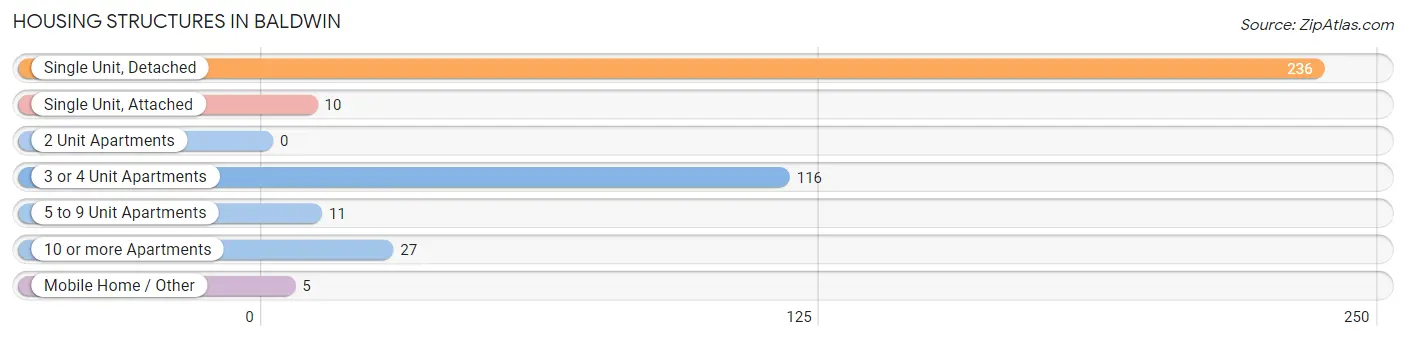
| Structure Type | # Housing Units | % Housing Units |
| Single Unit, Detached | 236 | 58.3% |
| Single Unit, Attached | 10 | 2.5% |
| 2 Unit Apartments | 0 | 0.0% |
| 3 or 4 Unit Apartments | 116 | 28.6% |
| 5 to 9 Unit Apartments | 11 | 2.7% |
| 10 or more Apartments | 27 | 6.7% |
| Mobile Home / Other | 5 | 1.2% |
| Total | 405 | 100.0% |
Housing Structures by Occupancy in Baldwin
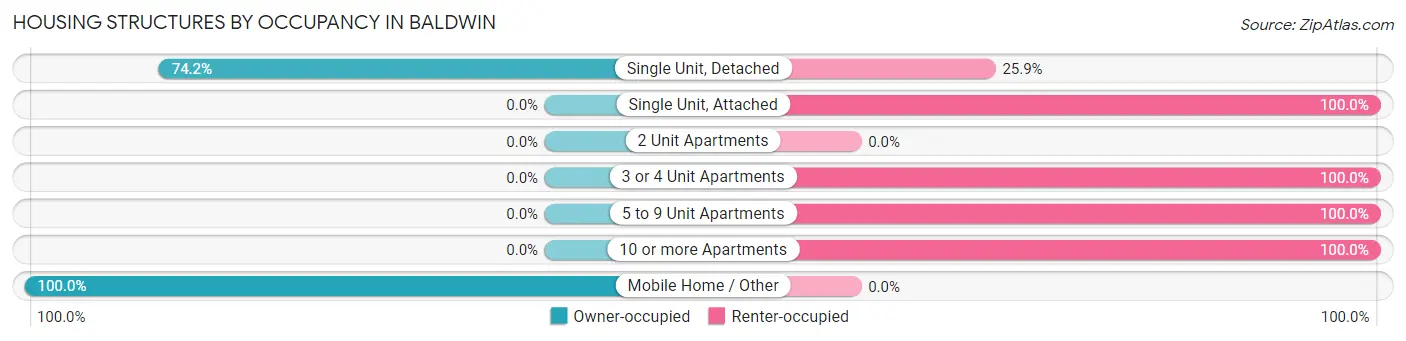
| Structure Type | Owner-occupied | Renter-occupied |
| Single Unit, Detached | 175 (74.2%) | 61 (25.9%) |
| Single Unit, Attached | 0 (0.0%) | 10 (100.0%) |
| 2 Unit Apartments | 0 (0.0%) | 0 (0.0%) |
| 3 or 4 Unit Apartments | 0 (0.0%) | 116 (100.0%) |
| 5 to 9 Unit Apartments | 0 (0.0%) | 11 (100.0%) |
| 10 or more Apartments | 0 (0.0%) | 27 (100.0%) |
| Mobile Home / Other | 5 (100.0%) | 0 (0.0%) |
| Total | 180 (44.4%) | 225 (55.6%) |
Housing Structures by Number of Rooms in Baldwin
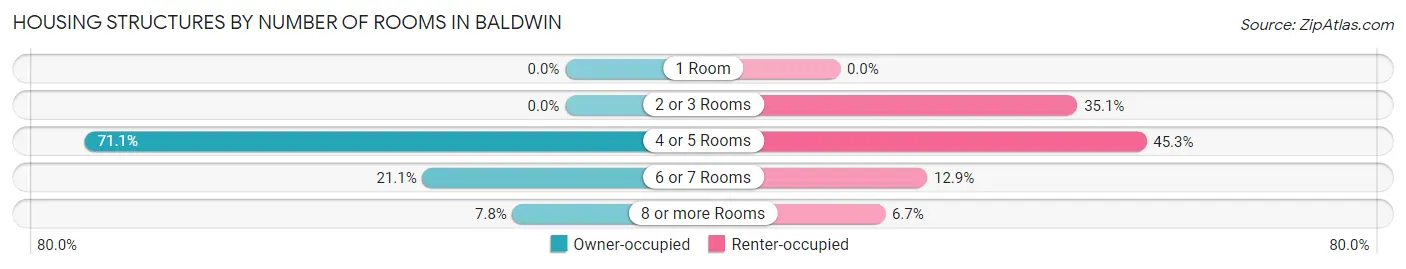
| Number of Rooms | Owner-occupied | Renter-occupied |
| 1 Room | 0 (0.0%) | 0 (0.0%) |
| 2 or 3 Rooms | 0 (0.0%) | 79 (35.1%) |
| 4 or 5 Rooms | 128 (71.1%) | 102 (45.3%) |
| 6 or 7 Rooms | 38 (21.1%) | 29 (12.9%) |
| 8 or more Rooms | 14 (7.8%) | 15 (6.7%) |
| Total | 180 (100.0%) | 225 (100.0%) |
Housing Structure by Heating Type in Baldwin
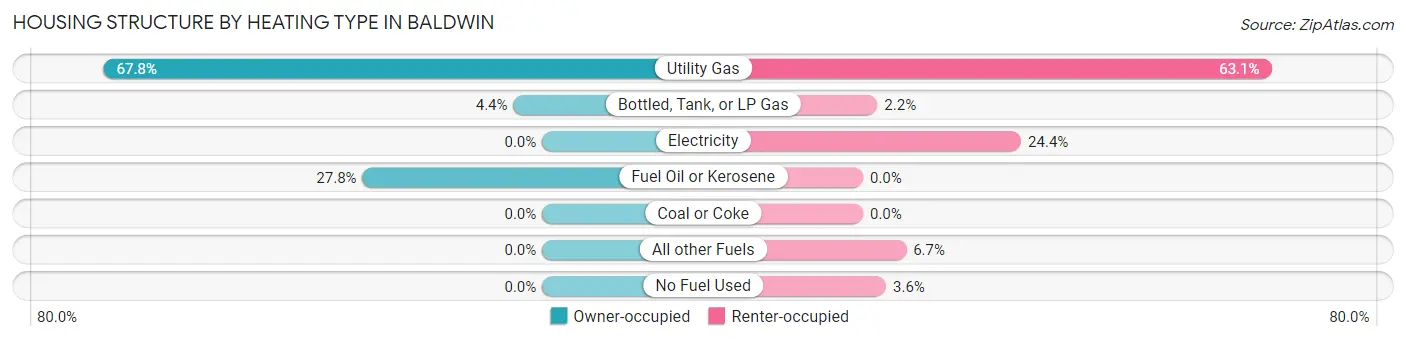
| Heating Type | Owner-occupied | Renter-occupied |
| Utility Gas | 122 (67.8%) | 142 (63.1%) |
| Bottled, Tank, or LP Gas | 8 (4.4%) | 5 (2.2%) |
| Electricity | 0 (0.0%) | 55 (24.4%) |
| Fuel Oil or Kerosene | 50 (27.8%) | 0 (0.0%) |
| Coal or Coke | 0 (0.0%) | 0 (0.0%) |
| All other Fuels | 0 (0.0%) | 15 (6.7%) |
| No Fuel Used | 0 (0.0%) | 8 (3.6%) |
| Total | 180 (100.0%) | 225 (100.0%) |
Household Vehicle Usage in Baldwin
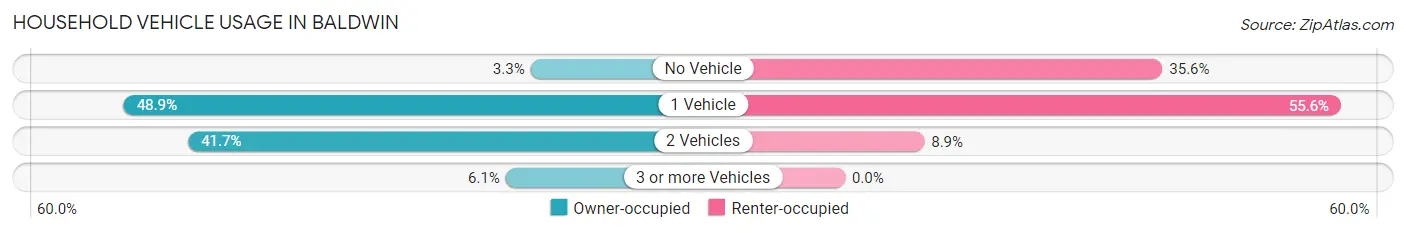
| Vehicles per Household | Owner-occupied | Renter-occupied |
| No Vehicle | 6 (3.3%) | 80 (35.6%) |
| 1 Vehicle | 88 (48.9%) | 125 (55.6%) |
| 2 Vehicles | 75 (41.7%) | 20 (8.9%) |
| 3 or more Vehicles | 11 (6.1%) | 0 (0.0%) |
| Total | 180 (100.0%) | 225 (100.0%) |
Real Estate & Mortgages in Baldwin
Real Estate and Mortgage Overview in Baldwin
| Characteristic | Without Mortgage | With Mortgage |
| Housing Units | 92 | 88 |
| Median Property Value | $57,200 | $109,800 |
| Median Household Income | $28,850 | $2 |
| Monthly Housing Costs | $447 | $0 |
| Real Estate Taxes | $1,282 | $0 |
Property Value by Mortgage Status in Baldwin
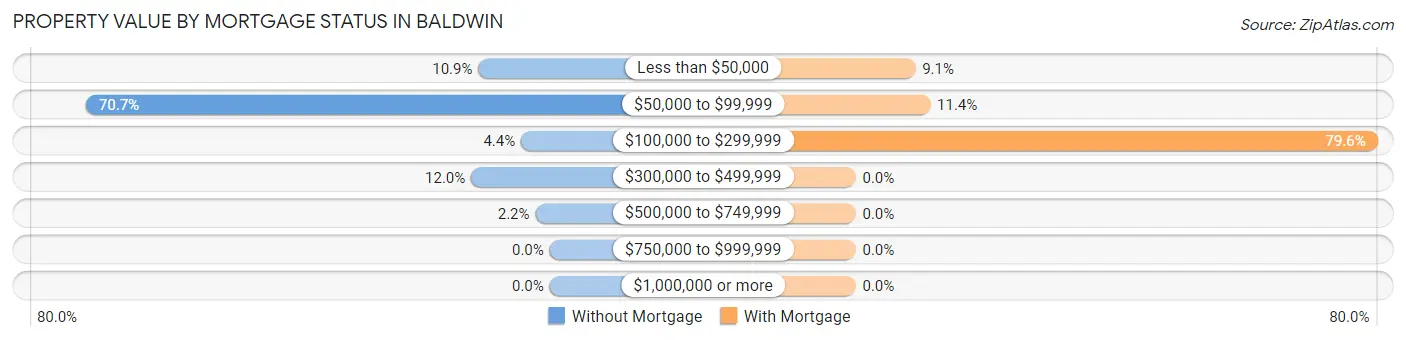
| Property Value | Without Mortgage | With Mortgage |
| Less than $50,000 | 10 (10.9%) | 8 (9.1%) |
| $50,000 to $99,999 | 65 (70.7%) | 10 (11.4%) |
| $100,000 to $299,999 | 4 (4.3%) | 70 (79.5%) |
| $300,000 to $499,999 | 11 (12.0%) | 0 (0.0%) |
| $500,000 to $749,999 | 2 (2.2%) | 0 (0.0%) |
| $750,000 to $999,999 | 0 (0.0%) | 0 (0.0%) |
| $1,000,000 or more | 0 (0.0%) | 0 (0.0%) |
| Total | 92 (100.0%) | 88 (100.0%) |
Household Income by Mortgage Status in Baldwin
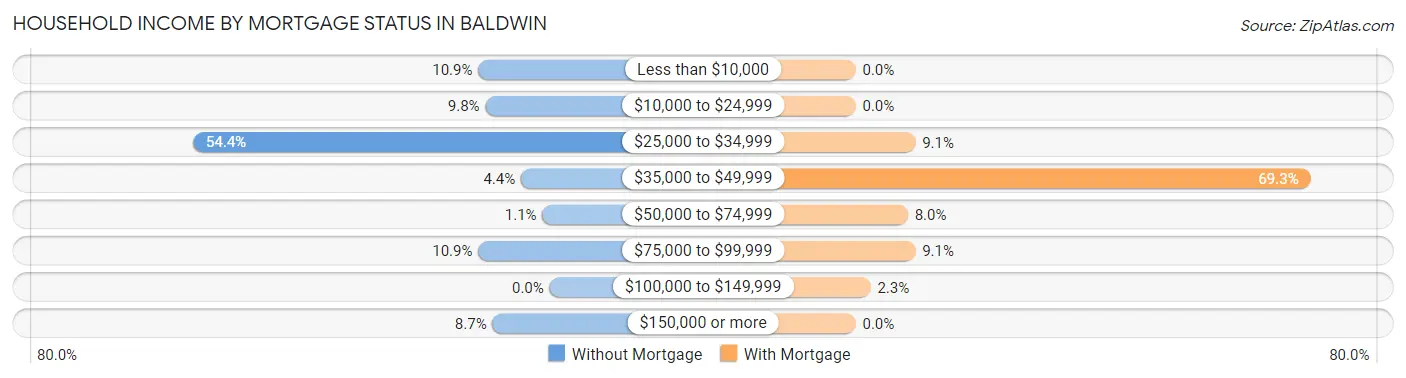
| Household Income | Without Mortgage | With Mortgage |
| Less than $10,000 | 10 (10.9%) | 0 (0.0%) |
| $10,000 to $24,999 | 9 (9.8%) | 0 (0.0%) |
| $25,000 to $34,999 | 50 (54.3%) | 8 (9.1%) |
| $35,000 to $49,999 | 4 (4.3%) | 61 (69.3%) |
| $50,000 to $74,999 | 1 (1.1%) | 7 (8.0%) |
| $75,000 to $99,999 | 10 (10.9%) | 8 (9.1%) |
| $100,000 to $149,999 | 0 (0.0%) | 2 (2.3%) |
| $150,000 or more | 8 (8.7%) | 0 (0.0%) |
| Total | 92 (100.0%) | 88 (100.0%) |
Property Value to Household Income Ratio in Baldwin
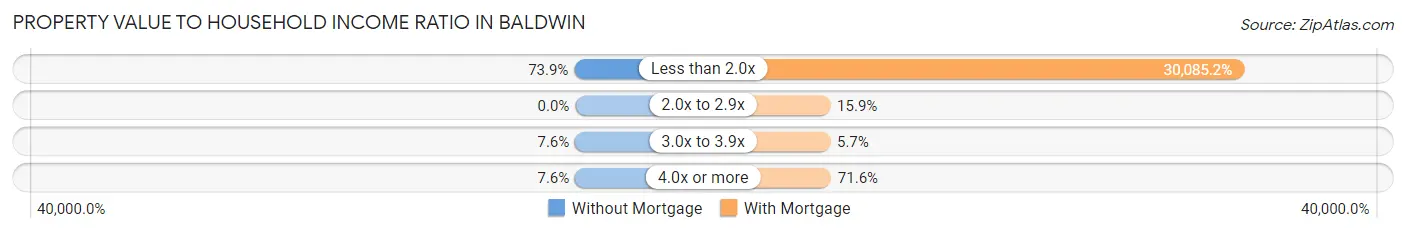
| Value-to-Income Ratio | Without Mortgage | With Mortgage |
| Less than 2.0x | 68 (73.9%) | 26,475 (30,085.2%) |
| 2.0x to 2.9x | 0 (0.0%) | 14 (15.9%) |
| 3.0x to 3.9x | 7 (7.6%) | 5 (5.7%) |
| 4.0x or more | 7 (7.6%) | 63 (71.6%) |
| Total | 92 (100.0%) | 88 (100.0%) |
Real Estate Taxes by Mortgage Status in Baldwin
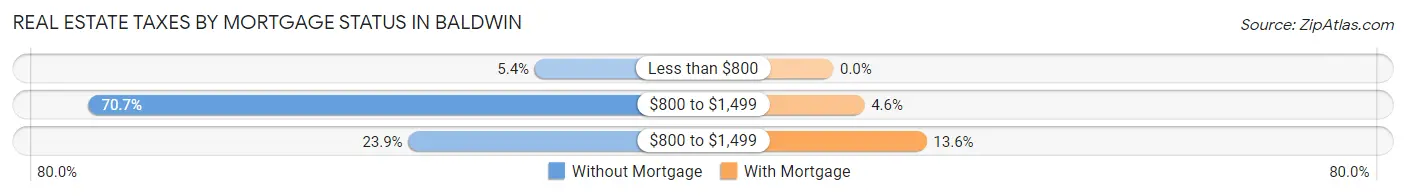
| Property Taxes | Without Mortgage | With Mortgage |
| Less than $800 | 5 (5.4%) | 0 (0.0%) |
| $800 to $1,499 | 65 (70.7%) | 4 (4.5%) |
| $800 to $1,499 | 22 (23.9%) | 12 (13.6%) |
| Total | 92 (100.0%) | 88 (100.0%) |
Health & Disability in Baldwin
Health Insurance Coverage by Age in Baldwin
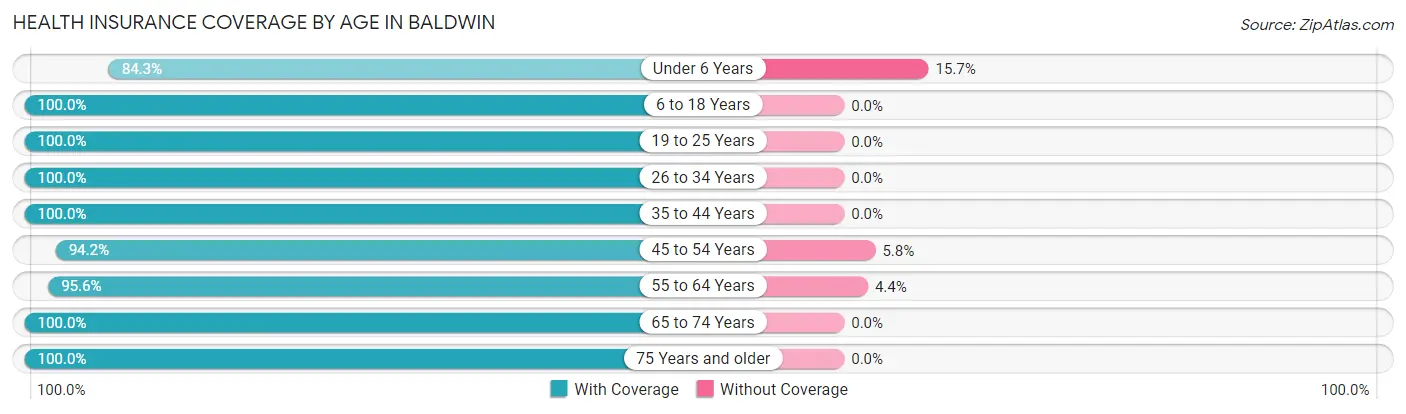
| Age Bracket | With Coverage | Without Coverage |
| Under 6 Years | 59 (84.3%) | 11 (15.7%) |
| 6 to 18 Years | 94 (100.0%) | 0 (0.0%) |
| 19 to 25 Years | 67 (100.0%) | 0 (0.0%) |
| 26 to 34 Years | 47 (100.0%) | 0 (0.0%) |
| 35 to 44 Years | 121 (100.0%) | 0 (0.0%) |
| 45 to 54 Years | 81 (94.2%) | 5 (5.8%) |
| 55 to 64 Years | 65 (95.6%) | 3 (4.4%) |
| 65 to 74 Years | 172 (100.0%) | 0 (0.0%) |
| 75 Years and older | 46 (100.0%) | 0 (0.0%) |
| Total | 752 (97.5%) | 19 (2.5%) |
Health Insurance Coverage by Citizenship Status in Baldwin
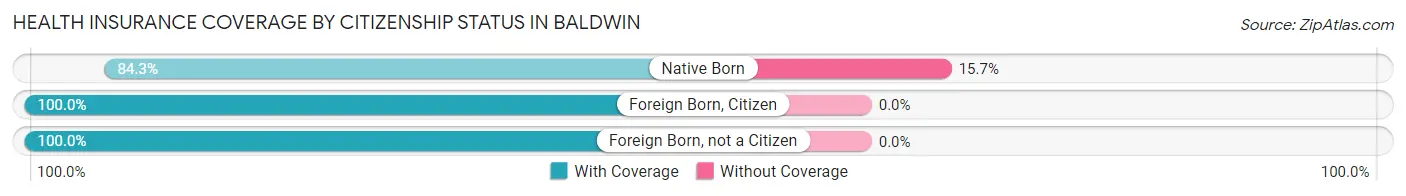
| Citizenship Status | With Coverage | Without Coverage |
| Native Born | 59 (84.3%) | 11 (15.7%) |
| Foreign Born, Citizen | 94 (100.0%) | 0 (0.0%) |
| Foreign Born, not a Citizen | 67 (100.0%) | 0 (0.0%) |
Health Insurance Coverage by Household Income in Baldwin
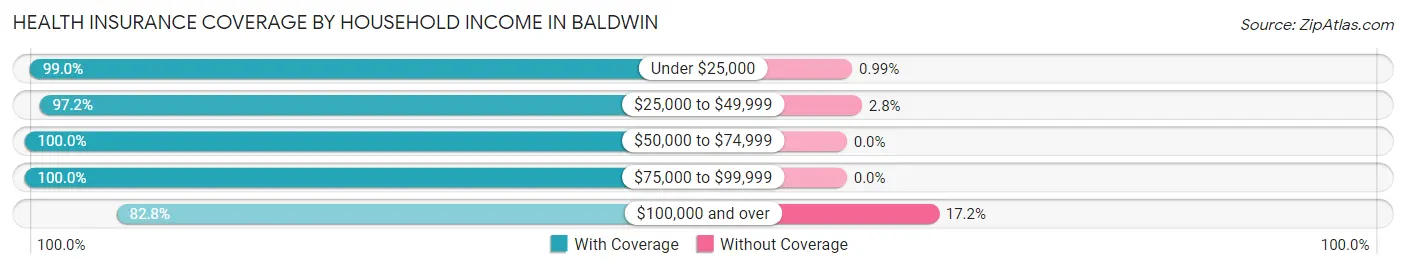
| Household Income | With Coverage | Without Coverage |
| Under $25,000 | 300 (99.0%) | 3 (1.0%) |
| $25,000 to $49,999 | 379 (97.2%) | 11 (2.8%) |
| $50,000 to $74,999 | 13 (100.0%) | 0 (0.0%) |
| $75,000 to $99,999 | 25 (100.0%) | 0 (0.0%) |
| $100,000 and over | 24 (82.8%) | 5 (17.2%) |
Public vs Private Health Insurance Coverage by Age in Baldwin
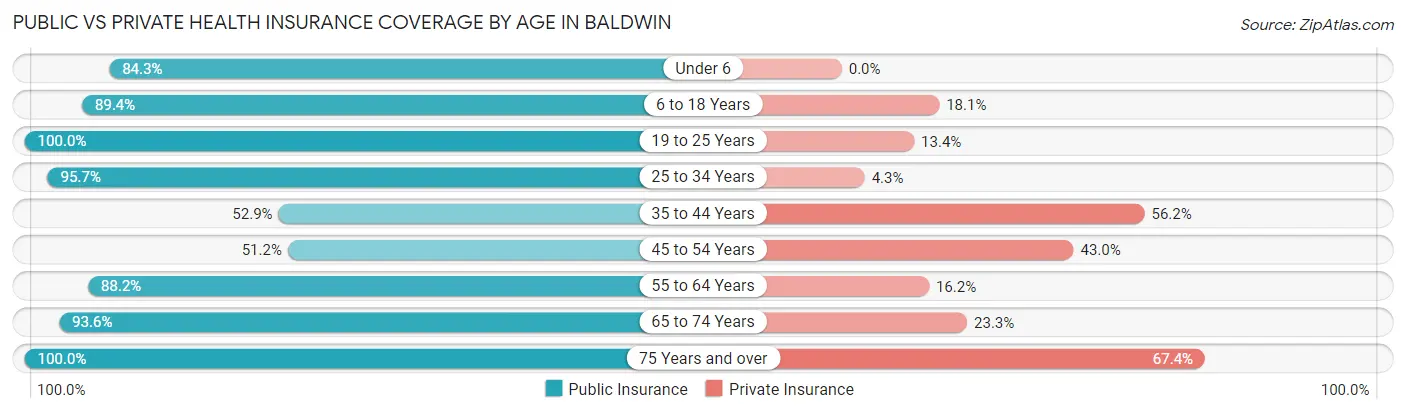
| Age Bracket | Public Insurance | Private Insurance |
| Under 6 | 59 (84.3%) | 0 (0.0%) |
| 6 to 18 Years | 84 (89.4%) | 17 (18.1%) |
| 19 to 25 Years | 67 (100.0%) | 9 (13.4%) |
| 25 to 34 Years | 45 (95.7%) | 2 (4.3%) |
| 35 to 44 Years | 64 (52.9%) | 68 (56.2%) |
| 45 to 54 Years | 44 (51.2%) | 37 (43.0%) |
| 55 to 64 Years | 60 (88.2%) | 11 (16.2%) |
| 65 to 74 Years | 161 (93.6%) | 40 (23.3%) |
| 75 Years and over | 46 (100.0%) | 31 (67.4%) |
| Total | 630 (81.7%) | 215 (27.9%) |
Disability Status by Sex by Age in Baldwin
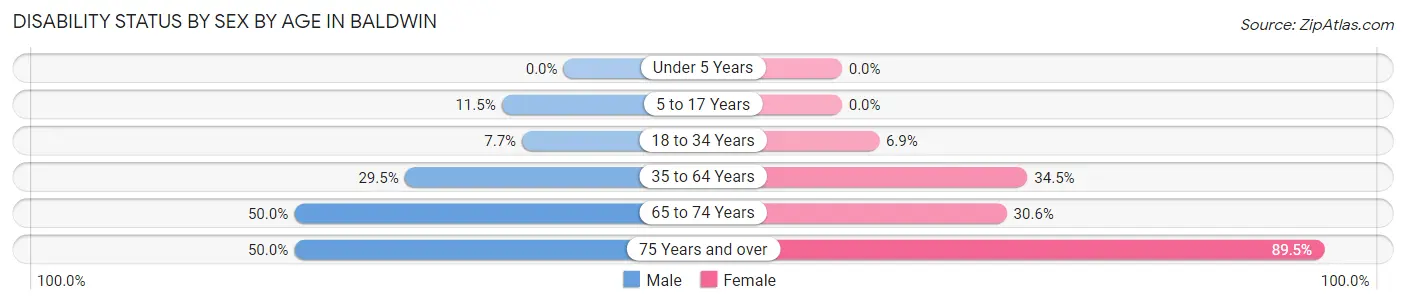
| Age Bracket | Male | Female |
| Under 5 Years | 0 (0.0%) | 0 (0.0%) |
| 5 to 17 Years | 7 (11.5%) | 0 (0.0%) |
| 18 to 34 Years | 6 (7.7%) | 4 (6.9%) |
| 35 to 64 Years | 46 (29.5%) | 41 (34.4%) |
| 65 to 74 Years | 19 (50.0%) | 41 (30.6%) |
| 75 Years and over | 4 (50.0%) | 34 (89.5%) |
Disability Class by Sex by Age in Baldwin
Disability Class: Hearing Difficulty
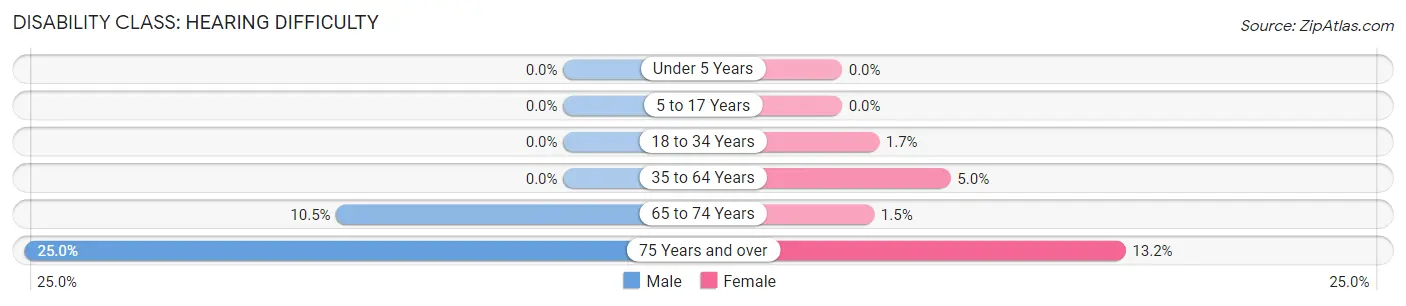
| Age Bracket | Male | Female |
| Under 5 Years | 0 (0.0%) | 0 (0.0%) |
| 5 to 17 Years | 0 (0.0%) | 0 (0.0%) |
| 18 to 34 Years | 0 (0.0%) | 1 (1.7%) |
| 35 to 64 Years | 0 (0.0%) | 6 (5.0%) |
| 65 to 74 Years | 4 (10.5%) | 2 (1.5%) |
| 75 Years and over | 2 (25.0%) | 5 (13.2%) |
Disability Class: Vision Difficulty
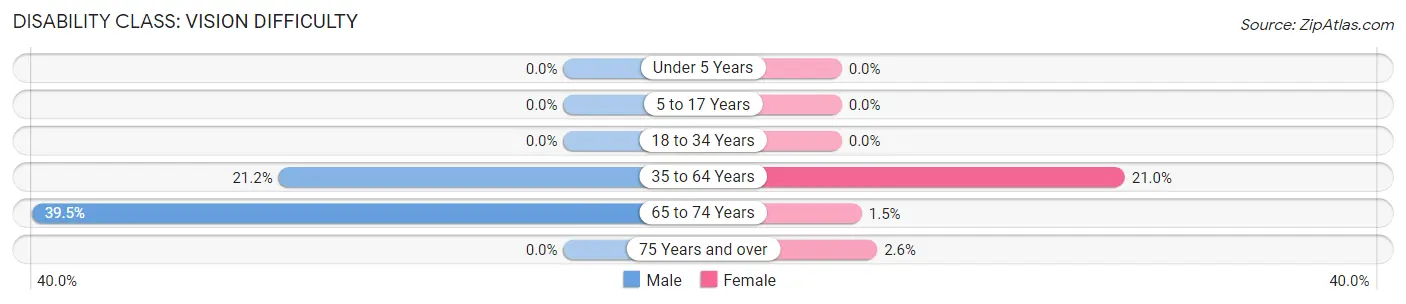
| Age Bracket | Male | Female |
| Under 5 Years | 0 (0.0%) | 0 (0.0%) |
| 5 to 17 Years | 0 (0.0%) | 0 (0.0%) |
| 18 to 34 Years | 0 (0.0%) | 0 (0.0%) |
| 35 to 64 Years | 33 (21.1%) | 25 (21.0%) |
| 65 to 74 Years | 15 (39.5%) | 2 (1.5%) |
| 75 Years and over | 0 (0.0%) | 1 (2.6%) |
Disability Class: Cognitive Difficulty
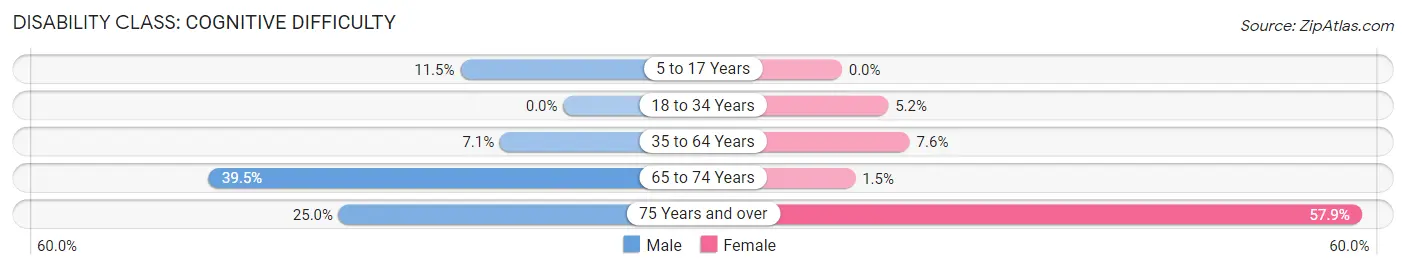
| Age Bracket | Male | Female |
| 5 to 17 Years | 7 (11.5%) | 0 (0.0%) |
| 18 to 34 Years | 0 (0.0%) | 3 (5.2%) |
| 35 to 64 Years | 11 (7.0%) | 9 (7.6%) |
| 65 to 74 Years | 15 (39.5%) | 2 (1.5%) |
| 75 Years and over | 2 (25.0%) | 22 (57.9%) |
Disability Class: Ambulatory Difficulty
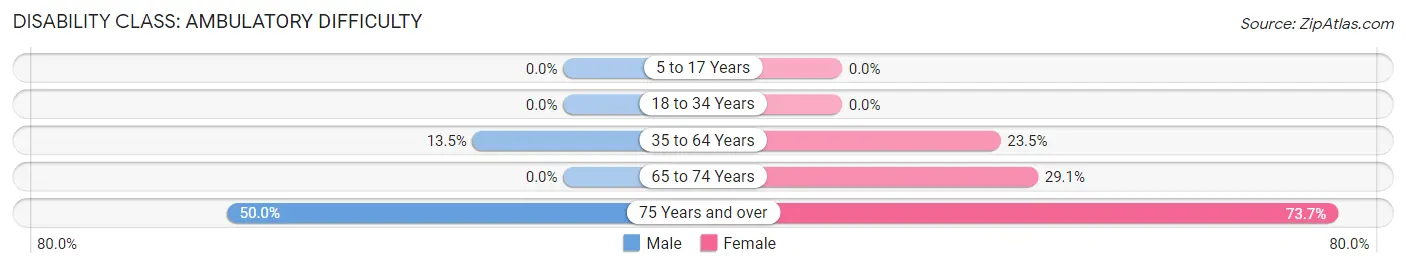
| Age Bracket | Male | Female |
| 5 to 17 Years | 0 (0.0%) | 0 (0.0%) |
| 18 to 34 Years | 0 (0.0%) | 0 (0.0%) |
| 35 to 64 Years | 21 (13.5%) | 28 (23.5%) |
| 65 to 74 Years | 0 (0.0%) | 39 (29.1%) |
| 75 Years and over | 4 (50.0%) | 28 (73.7%) |
Disability Class: Self-Care Difficulty
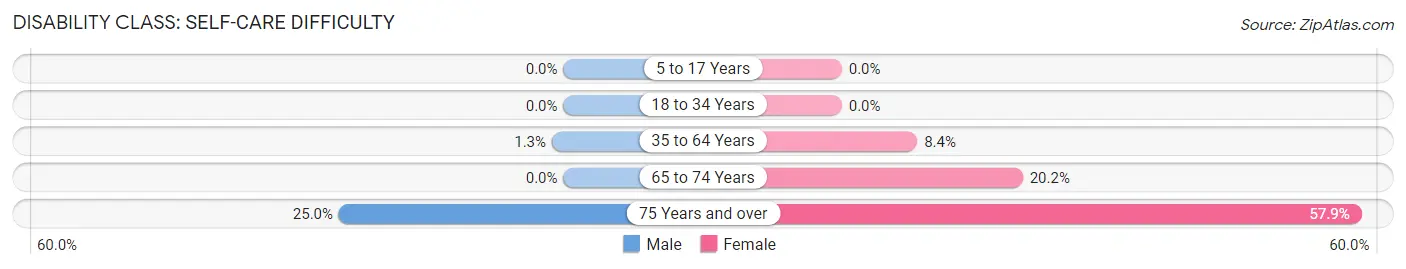
| Age Bracket | Male | Female |
| 5 to 17 Years | 0 (0.0%) | 0 (0.0%) |
| 18 to 34 Years | 0 (0.0%) | 0 (0.0%) |
| 35 to 64 Years | 2 (1.3%) | 10 (8.4%) |
| 65 to 74 Years | 0 (0.0%) | 27 (20.2%) |
| 75 Years and over | 2 (25.0%) | 22 (57.9%) |
Technology Access in Baldwin
Computing Device Access in Baldwin
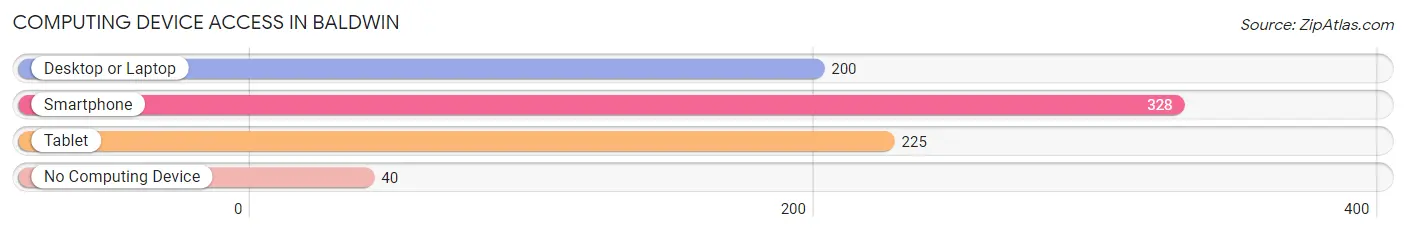
| Device Type | # Households | % Households |
| Desktop or Laptop | 200 | 49.4% |
| Smartphone | 328 | 81.0% |
| Tablet | 225 | 55.6% |
| No Computing Device | 40 | 9.9% |
| Total | 405 | 100.0% |
Internet Access in Baldwin
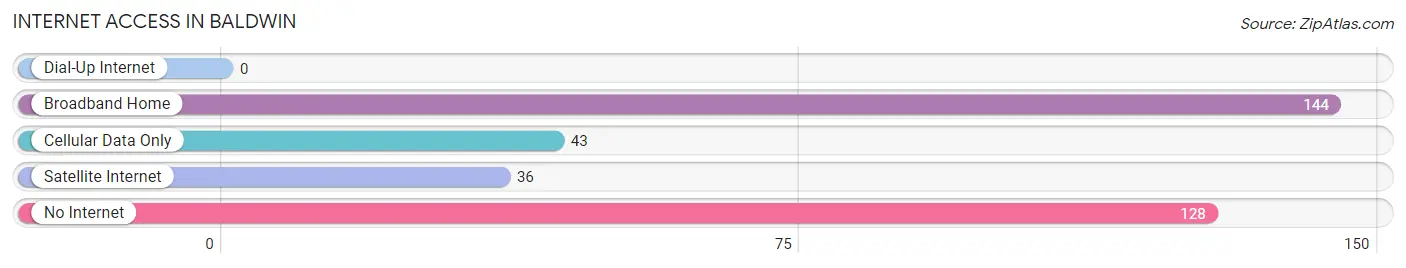
| Internet Type | # Households | % Households |
| Dial-Up Internet | 0 | 0.0% |
| Broadband Home | 144 | 35.6% |
| Cellular Data Only | 43 | 10.6% |
| Satellite Internet | 36 | 8.9% |
| No Internet | 128 | 31.6% |
| Total | 405 | 100.0% |
Baldwin Summary
Baldwin is a small village located in the northern part of Michigan’s Lower Peninsula. It is situated in Lake County, approximately 30 miles east of Traverse City. The village has a population of 1,845 people, according to the 2010 census.
History
The area that is now Baldwin was first settled in 1871 by a group of settlers from New York. The village was originally known as “Baldwin’s Corners”, named after the first settler, John Baldwin. The village was officially incorporated in 1887.
In the early 1900s, Baldwin was a thriving lumber town. The village was home to several sawmills and lumber companies, which provided employment for many of the residents. The lumber industry declined in the 1920s, and the village began to focus on agriculture and tourism.
Geography
Baldwin is located in the northern part of Michigan’s Lower Peninsula. It is situated in Lake County, approximately 30 miles east of Traverse City. The village is surrounded by rolling hills and forests, and is located near several lakes, including Big Star Lake, Little Star Lake, and Lake Michigan.
Economy
Baldwin’s economy is largely based on agriculture and tourism. The village is home to several farms, which produce a variety of crops, including apples, cherries, and potatoes. The village also has several wineries and breweries, which attract tourists from all over the state.
In addition to agriculture and tourism, Baldwin is home to several small businesses, including restaurants, retail stores, and service providers. The village also has a small industrial park, which is home to several manufacturing companies.
Demographics
According to the 2010 census, Baldwin has a population of 1,845 people. The population is predominantly white (94.3%), with small percentages of African American (2.2%), Native American (1.2%), and Asian (0.7%) residents. The median household income is $41,944, and the median age is 43.7 years.
Conclusion
Baldwin is a small village located in the northern part of Michigan’s Lower Peninsula. It has a population of 1,845 people, and is largely supported by agriculture and tourism. The village is home to several farms, wineries, and breweries, as well as small businesses and manufacturing companies. The population is predominantly white, with small percentages of African American, Native American, and Asian residents.
Common Questions
What is Per Capita Income in Baldwin?
Per Capita income in Baldwin is $14,507.
What is the Median Family Income in Baldwin?
Median Family Income in Baldwin is $24,712.
What is the Median Household income in Baldwin?
Median Household Income in Baldwin is $25,587.
What is Income or Wage Gap in Baldwin?
Income or Wage Gap in Baldwin is 33.3%.
Women in Baldwin earn 66.7 cents for every dollar earned by a man.
What is Inequality or Gini Index in Baldwin?
Inequality or Gini Index in Baldwin is 0.43.
What is the Total Population of Baldwin?
Total Population of Baldwin is 1,030.
What is the Total Male Population of Baldwin?
Total Male Population of Baldwin is 535.
What is the Total Female Population of Baldwin?
Total Female Population of Baldwin is 495.
What is the Ratio of Males per 100 Females in Baldwin?
There are 108.08 Males per 100 Females in Baldwin.
What is the Ratio of Females per 100 Males in Baldwin?
There are 92.52 Females per 100 Males in Baldwin.
What is the Median Population Age in Baldwin?
Median Population Age in Baldwin is 43.8 Years.
What is the Average Family Size in Baldwin
Average Family Size in Baldwin is 3.4 People.
What is the Average Household Size in Baldwin
Average Household Size in Baldwin is 1.9 People.
How Large is the Labor Force in Baldwin?
There are 267 People in the Labor Forcein in Baldwin.
What is the Percentage of People in the Labor Force in Baldwin?
29.6% of People are in the Labor Force in Baldwin.
What is the Unemployment Rate in Baldwin?
Unemployment Rate in Baldwin is 6.4%.