Carson City, MI Map & Demographics
Carson City Map
Carson City Overview
$28,359
PER CAPITA INCOME
$70,536
AVG FAMILY INCOME
$42,222
AVG HOUSEHOLD INCOME
34.9%
WAGE / INCOME GAP [ % ]
65.1¢/ $1
WAGE / INCOME GAP [ $ ]
$8,346
FAMILY INCOME DEFICIT
0.41
INEQUALITY / GINI INDEX
1,006
TOTAL POPULATION
502
MALE POPULATION
504
FEMALE POPULATION
99.60
MALES / 100 FEMALES
100.40
FEMALES / 100 MALES
45.8
MEDIAN AGE
3.1
AVG FAMILY SIZE
2.1
AVG HOUSEHOLD SIZE
432
LABOR FORCE [ PEOPLE ]
50.2%
PERCENT IN LABOR FORCE
4.2%
UNEMPLOYMENT RATE
Carson City Zip Codes
Carson City Area Codes
Income in Carson City
Income Overview in Carson City
Per Capita Income in Carson City is $28,359, while median incomes of families and households are $70,536 and $42,222 respectively.
| Characteristic | Number | Measure |
| Per Capita Income | 1,006 | $28,359 |
| Median Family Income | 196 | $70,536 |
| Mean Family Income | 196 | $75,081 |
| Median Household Income | 450 | $42,222 |
| Mean Household Income | 450 | $54,878 |
| Income Deficit | 196 | $8,346 |
| Wage / Income Gap (%) | 1,006 | 34.86% |
| Wage / Income Gap ($) | 1,006 | 65.14¢ per $1 |
| Gini / Inequality Index | 1,006 | 0.41 |
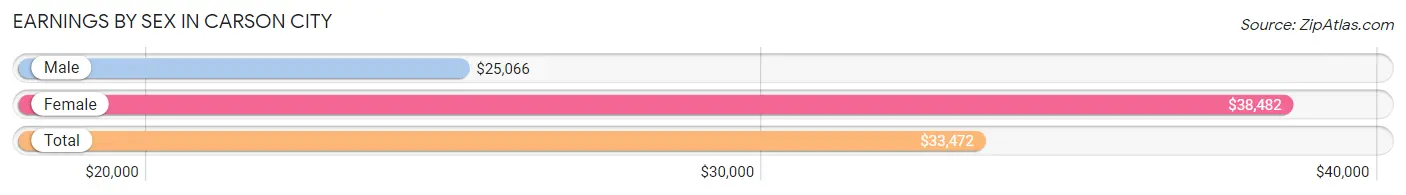
Earnings by Sex in Carson City
Average Earnings in Carson City are $33,472, $25,066 for men and $38,482 for women, a difference of 34.9%.
| Sex | Number | Average Earnings |
| Male | 243 (56.8%) | $25,066 |
| Female | 185 (43.2%) | $38,482 |
| Total | 428 (100.0%) | $33,472 |
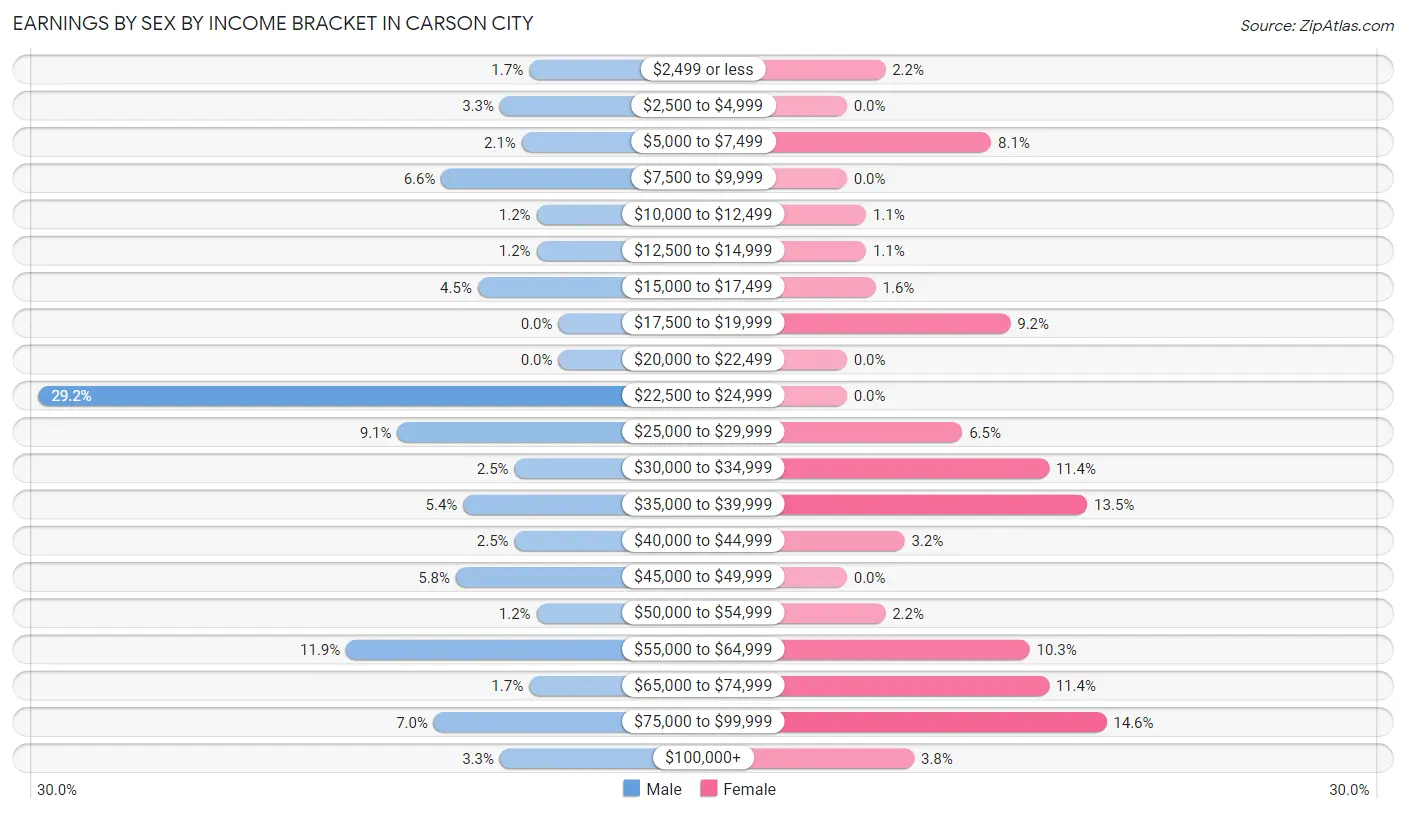
Earnings by Sex by Income Bracket in Carson City
The most common earnings brackets in Carson City are $22,500 to $24,999 for men (71 | 29.2%) and $75,000 to $99,999 for women (27 | 14.6%).
| Income | Male | Female |
| $2,499 or less | 4 (1.7%) | 4 (2.2%) |
| $2,500 to $4,999 | 8 (3.3%) | 0 (0.0%) |
| $5,000 to $7,499 | 5 (2.1%) | 15 (8.1%) |
| $7,500 to $9,999 | 16 (6.6%) | 0 (0.0%) |
| $10,000 to $12,499 | 3 (1.2%) | 2 (1.1%) |
| $12,500 to $14,999 | 3 (1.2%) | 2 (1.1%) |
| $15,000 to $17,499 | 11 (4.5%) | 3 (1.6%) |
| $17,500 to $19,999 | 0 (0.0%) | 17 (9.2%) |
| $20,000 to $22,499 | 0 (0.0%) | 0 (0.0%) |
| $22,500 to $24,999 | 71 (29.2%) | 0 (0.0%) |
| $25,000 to $29,999 | 22 (9.0%) | 12 (6.5%) |
| $30,000 to $34,999 | 6 (2.5%) | 21 (11.4%) |
| $35,000 to $39,999 | 13 (5.3%) | 25 (13.5%) |
| $40,000 to $44,999 | 6 (2.5%) | 6 (3.2%) |
| $45,000 to $49,999 | 14 (5.8%) | 0 (0.0%) |
| $50,000 to $54,999 | 3 (1.2%) | 4 (2.2%) |
| $55,000 to $64,999 | 29 (11.9%) | 19 (10.3%) |
| $65,000 to $74,999 | 4 (1.7%) | 21 (11.4%) |
| $75,000 to $99,999 | 17 (7.0%) | 27 (14.6%) |
| $100,000+ | 8 (3.3%) | 7 (3.8%) |
| Total | 243 (100.0%) | 185 (100.0%) |
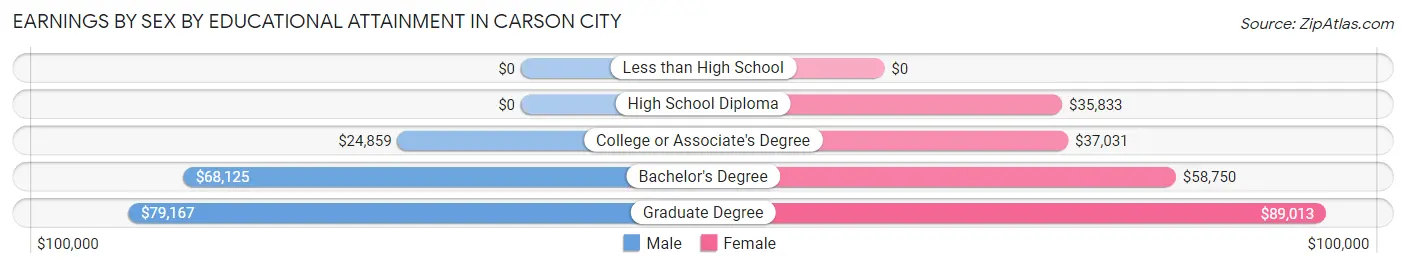
Earnings by Sex by Educational Attainment in Carson City
Average earnings in Carson City are $26,118 for men and $39,732 for women, a difference of 34.3%. Men with an educational attainment of graduate degree enjoy the highest average annual earnings of $79,167, while those with college or associate's degree education earn the least with $24,859. Women with an educational attainment of graduate degree earn the most with the average annual earnings of $89,013, while those with high school diploma education have the smallest earnings of $35,833.
| Educational Attainment | Male Income | Female Income |
| Less than High School | - | - |
| High School Diploma | - | - |
| College or Associate's Degree | $24,859 | $37,031 |
| Bachelor's Degree | $68,125 | $58,750 |
| Graduate Degree | $79,167 | $89,013 |
| Total | $26,118 | $39,732 |
Family Income in Carson City
Family Income Brackets in Carson City
According to the Carson City family income data, there are 54 families falling into the $50,000 to $74,999 income range, which is the most common income bracket and makes up 27.6% of all families.
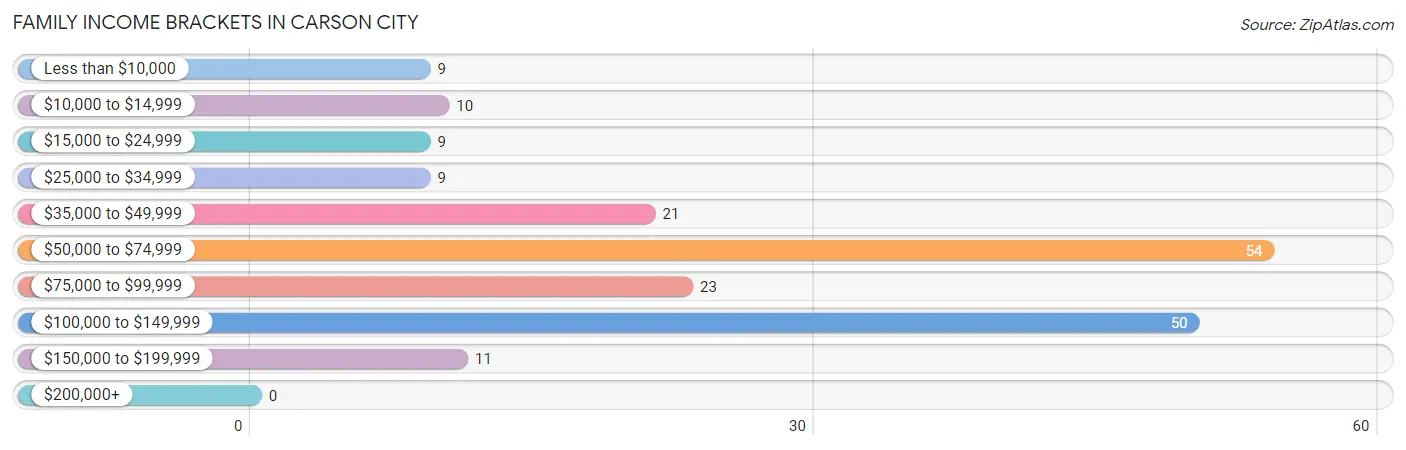
| Income Bracket | # Families | % Families |
| Less than $10,000 | 9 | 4.6% |
| $10,000 to $14,999 | 10 | 5.1% |
| $15,000 to $24,999 | 9 | 4.6% |
| $25,000 to $34,999 | 9 | 4.6% |
| $35,000 to $49,999 | 21 | 10.7% |
| $50,000 to $74,999 | 54 | 27.6% |
| $75,000 to $99,999 | 23 | 11.7% |
| $100,000 to $149,999 | 50 | 25.5% |
| $150,000 to $199,999 | 11 | 5.6% |
| $200,000+ | 0 | 0.0% |
Family Income by Famaliy Size in Carson City
4-person families (28 | 14.3%) account for the highest median family income in Carson City with $94,643 per family, while 2-person families (84 | 42.9%) have the highest median income of $25,834 per family member.
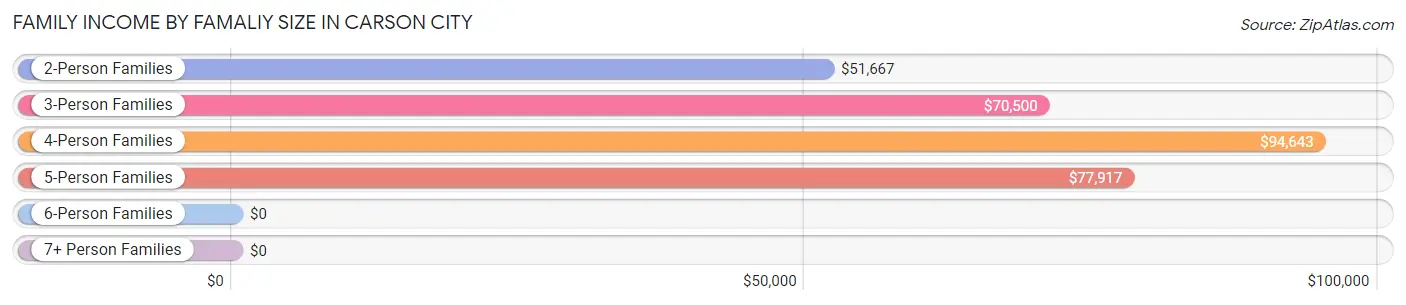
| Income Bracket | # Families | Median Income |
| 2-Person Families | 84 (42.9%) | $51,667 |
| 3-Person Families | 66 (33.7%) | $70,500 |
| 4-Person Families | 28 (14.3%) | $94,643 |
| 5-Person Families | 15 (7.6%) | $77,917 |
| 6-Person Families | 3 (1.5%) | $0 |
| 7+ Person Families | 0 (0.0%) | $0 |
| Total | 196 (100.0%) | $70,536 |
Family Income by Number of Earners in Carson City
The median family income in Carson City is $70,536, with families comprising 3+ earners (13) having the highest median family income of $126,250, while families with no earners (37) have the lowest median family income of $35,625, accounting for 6.6% and 18.9% of families, respectively.
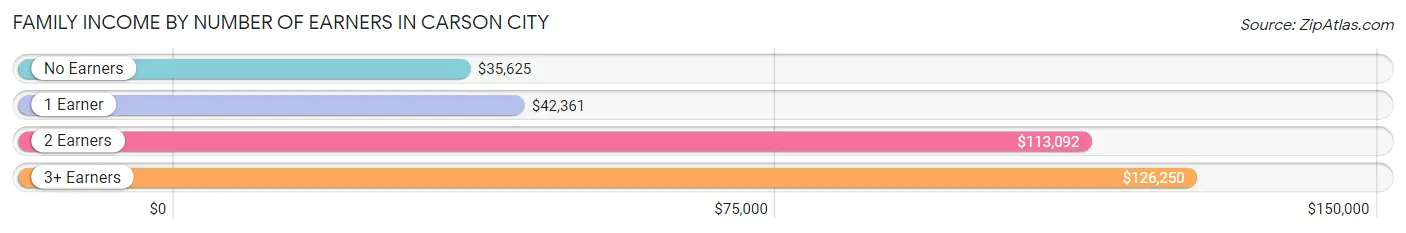
| Number of Earners | # Families | Median Income |
| No Earners | 37 (18.9%) | $35,625 |
| 1 Earner | 61 (31.1%) | $42,361 |
| 2 Earners | 85 (43.4%) | $113,092 |
| 3+ Earners | 13 (6.6%) | $126,250 |
| Total | 196 (100.0%) | $70,536 |
Household Income in Carson City
Household Income Brackets in Carson City
With 108 households falling in the category, the $15,000 to $24,999 income range is the most frequent in Carson City, accounting for 24.0% of all households. In contrast, only 2 households (0.4%) fall into the $200,000+ income bracket, making it the least populous group.
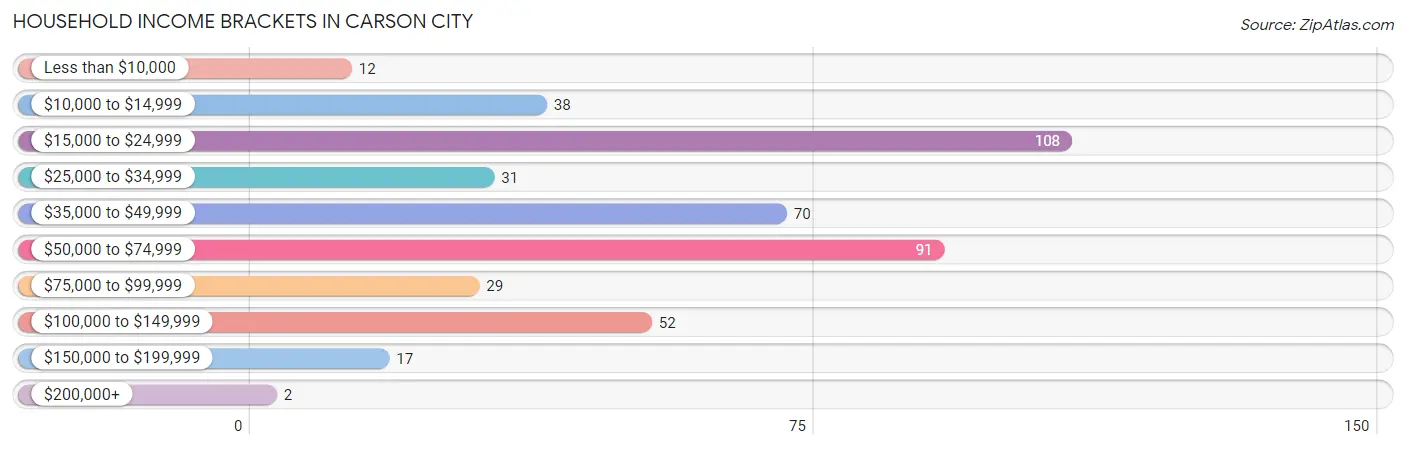
| Income Bracket | # Households | % Households |
| Less than $10,000 | 12 | 2.7% |
| $10,000 to $14,999 | 38 | 8.4% |
| $15,000 to $24,999 | 108 | 24.0% |
| $25,000 to $34,999 | 31 | 6.9% |
| $35,000 to $49,999 | 70 | 15.6% |
| $50,000 to $74,999 | 91 | 20.2% |
| $75,000 to $99,999 | 29 | 6.4% |
| $100,000 to $149,999 | 52 | 11.6% |
| $150,000 to $199,999 | 17 | 3.8% |
| $200,000+ | 2 | 0.4% |
Household Income by Householder Age in Carson City
The median household income in Carson City is $42,222, with the highest median household income of $59,063 found in the 45 to 64 years age bracket for the primary householder. A total of 102 households (22.7%) fall into this category. Meanwhile, the 15 to 24 years age bracket for the primary householder has the lowest median household income of $0, with 10 households (2.2%) in this group.
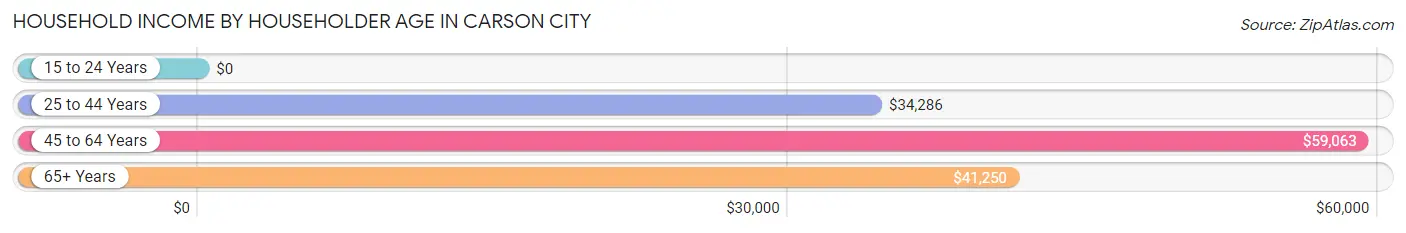
| Income Bracket | # Households | Median Income |
| 15 to 24 Years | 10 (2.2%) | $0 |
| 25 to 44 Years | 194 (43.1%) | $34,286 |
| 45 to 64 Years | 102 (22.7%) | $59,063 |
| 65+ Years | 144 (32.0%) | $41,250 |
| Total | 450 (100.0%) | $42,222 |
Poverty in Carson City
Income Below Poverty by Sex and Age in Carson City
With 10.7% poverty level for males and 12.6% for females among the residents of Carson City, 5 year old males and 18 to 24 year old females are the most vulnerable to poverty, with 2 males (100.0%) and 8 females (40.0%) in their respective age groups living below the poverty level.
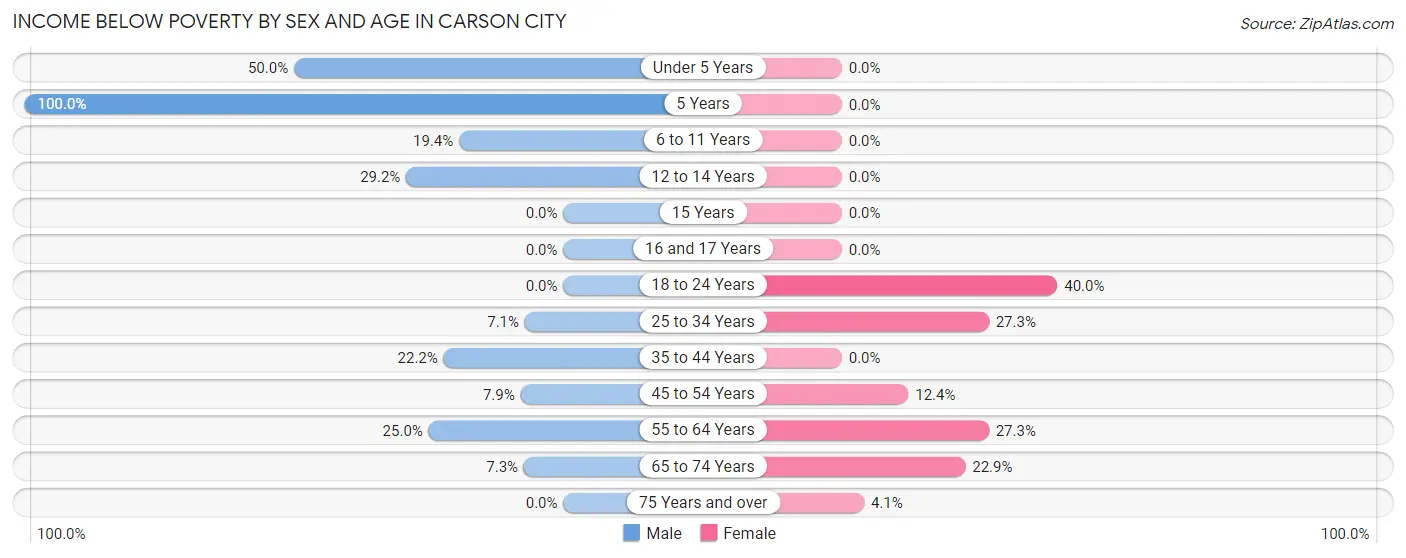
| Age Bracket | Male | Female |
| Under 5 Years | 3 (50.0%) | 0 (0.0%) |
| 5 Years | 2 (100.0%) | 0 (0.0%) |
| 6 to 11 Years | 6 (19.4%) | 0 (0.0%) |
| 12 to 14 Years | 7 (29.2%) | 0 (0.0%) |
| 15 Years | 0 (0.0%) | 0 (0.0%) |
| 16 and 17 Years | 0 (0.0%) | 0 (0.0%) |
| 18 to 24 Years | 0 (0.0%) | 8 (40.0%) |
| 25 to 34 Years | 8 (7.1%) | 15 (27.3%) |
| 35 to 44 Years | 8 (22.2%) | 0 (0.0%) |
| 45 to 54 Years | 5 (7.9%) | 10 (12.3%) |
| 55 to 64 Years | 7 (25.0%) | 9 (27.3%) |
| 65 to 74 Years | 6 (7.3%) | 11 (22.9%) |
| 75 Years and over | 0 (0.0%) | 3 (4.1%) |
| Total | 52 (10.7%) | 56 (12.6%) |
Income Above Poverty by Sex and Age in Carson City
According to the poverty statistics in Carson City, males aged 15 years and females aged under 5 years are the age groups that are most secure financially, with 100.0% of males and 100.0% of females in these age groups living above the poverty line.
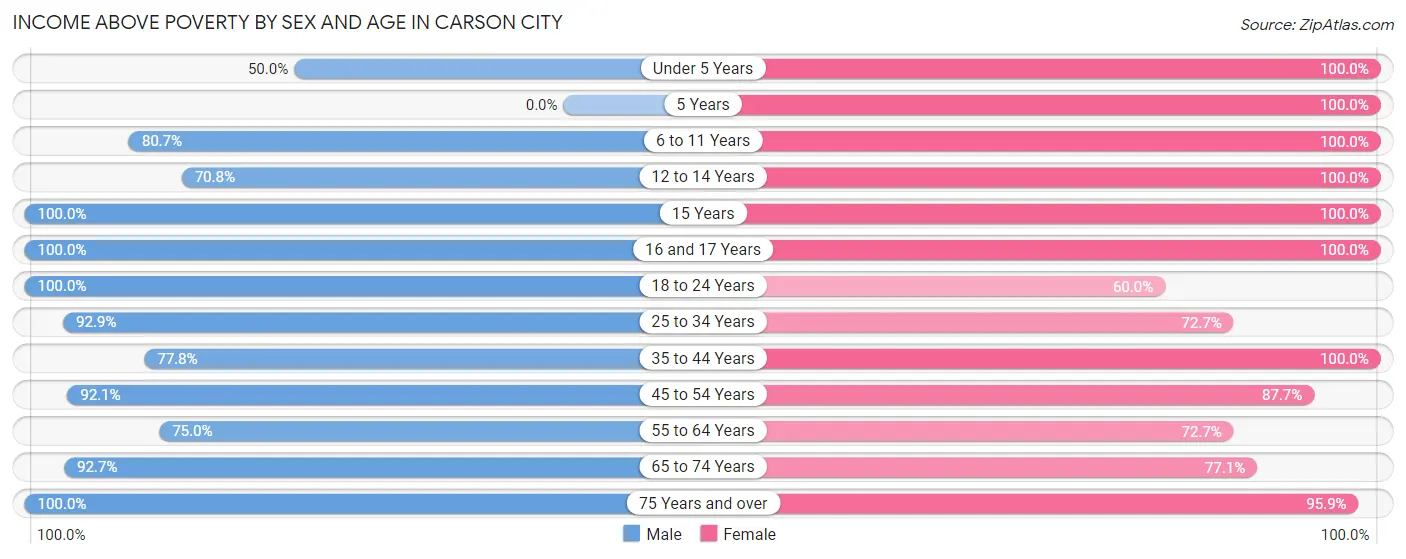
| Age Bracket | Male | Female |
| Under 5 Years | 3 (50.0%) | 23 (100.0%) |
| 5 Years | 0 (0.0%) | 3 (100.0%) |
| 6 to 11 Years | 25 (80.6%) | 6 (100.0%) |
| 12 to 14 Years | 17 (70.8%) | 25 (100.0%) |
| 15 Years | 4 (100.0%) | 22 (100.0%) |
| 16 and 17 Years | 18 (100.0%) | 9 (100.0%) |
| 18 to 24 Years | 47 (100.0%) | 12 (60.0%) |
| 25 to 34 Years | 104 (92.9%) | 40 (72.7%) |
| 35 to 44 Years | 28 (77.8%) | 45 (100.0%) |
| 45 to 54 Years | 58 (92.1%) | 71 (87.6%) |
| 55 to 64 Years | 21 (75.0%) | 24 (72.7%) |
| 65 to 74 Years | 76 (92.7%) | 37 (77.1%) |
| 75 Years and over | 35 (100.0%) | 70 (95.9%) |
| Total | 436 (89.3%) | 387 (87.4%) |
Income Below Poverty Among Married-Couple Families in Carson City
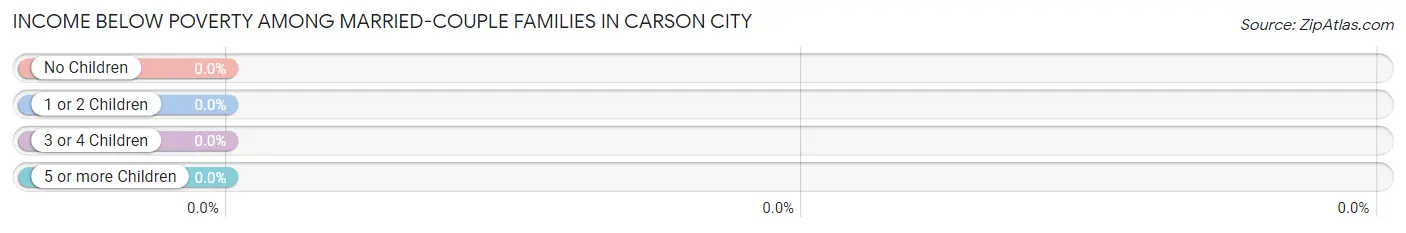
| Children | Above Poverty | Below Poverty |
| No Children | 62 (100.0%) | 0 (0.0%) |
| 1 or 2 Children | 65 (100.0%) | 0 (0.0%) |
| 3 or 4 Children | 3 (100.0%) | 0 (0.0%) |
| 5 or more Children | 0 (0.0%) | 0 (0.0%) |
| Total | 130 (100.0%) | 0 (0.0%) |
Income Below Poverty Among Single-Parent Households in Carson City
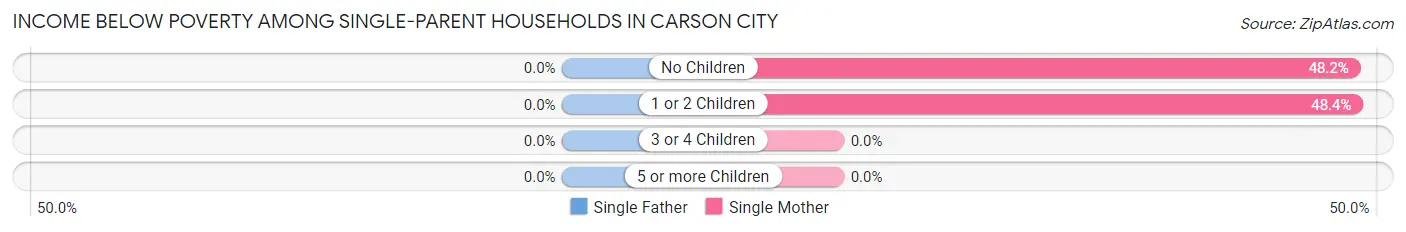
| Children | Single Father | Single Mother |
| No Children | 0 (0.0%) | 13 (48.1%) |
| 1 or 2 Children | 0 (0.0%) | 15 (48.4%) |
| 3 or 4 Children | 0 (0.0%) | 0 (0.0%) |
| 5 or more Children | 0 (0.0%) | 0 (0.0%) |
| Total | 0 (0.0%) | 28 (48.3%) |
Income Below Poverty Among Married-Couple vs Single-Parent Households in Carson City
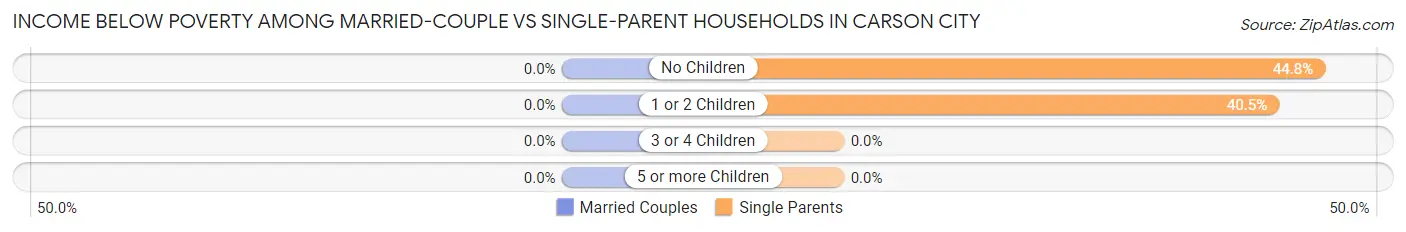
| Children | Married-Couple Families | Single-Parent Households |
| No Children | 0 (0.0%) | 13 (44.8%) |
| 1 or 2 Children | 0 (0.0%) | 15 (40.5%) |
| 3 or 4 Children | 0 (0.0%) | 0 (0.0%) |
| 5 or more Children | 0 (0.0%) | 0 (0.0%) |
| Total | 0 (0.0%) | 28 (42.4%) |
Race in Carson City
The most populous races in Carson City are White / Caucasian (979 | 97.3%), Hispanic or Latino (35 | 3.5%), and Two or more Races (17 | 1.7%).
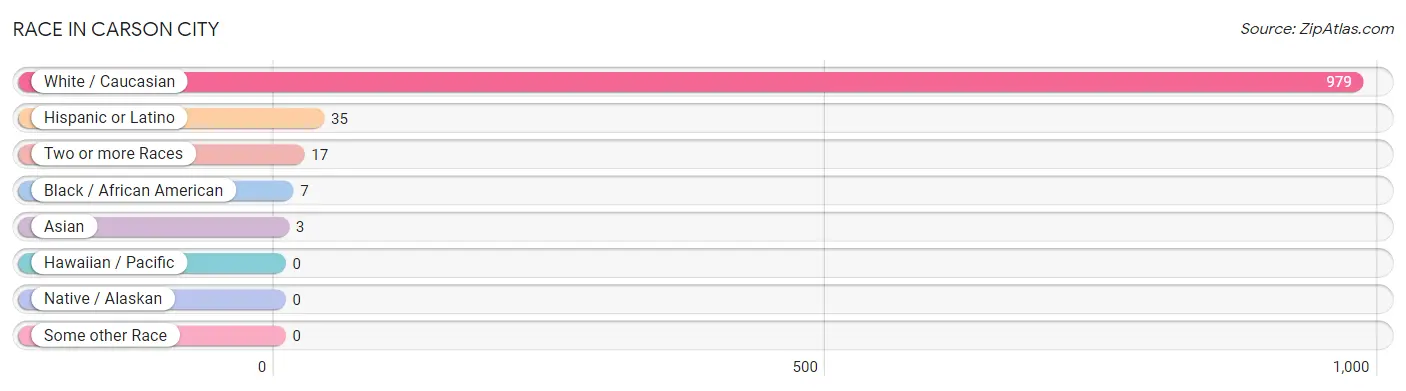
| Race | # Population | % Population |
| Asian | 3 | 0.3% |
| Black / African American | 7 | 0.7% |
| Hawaiian / Pacific | 0 | 0.0% |
| Hispanic or Latino | 35 | 3.5% |
| Native / Alaskan | 0 | 0.0% |
| White / Caucasian | 979 | 97.3% |
| Two or more Races | 17 | 1.7% |
| Some other Race | 0 | 0.0% |
| Total | 1,006 | 100.0% |
Ancestry in Carson City
The most populous ancestries reported in Carson City are German (246 | 24.4%), Irish (219 | 21.8%), English (196 | 19.5%), Dutch (60 | 6.0%), and French (37 | 3.7%), together accounting for 75.3% of all Carson City residents.
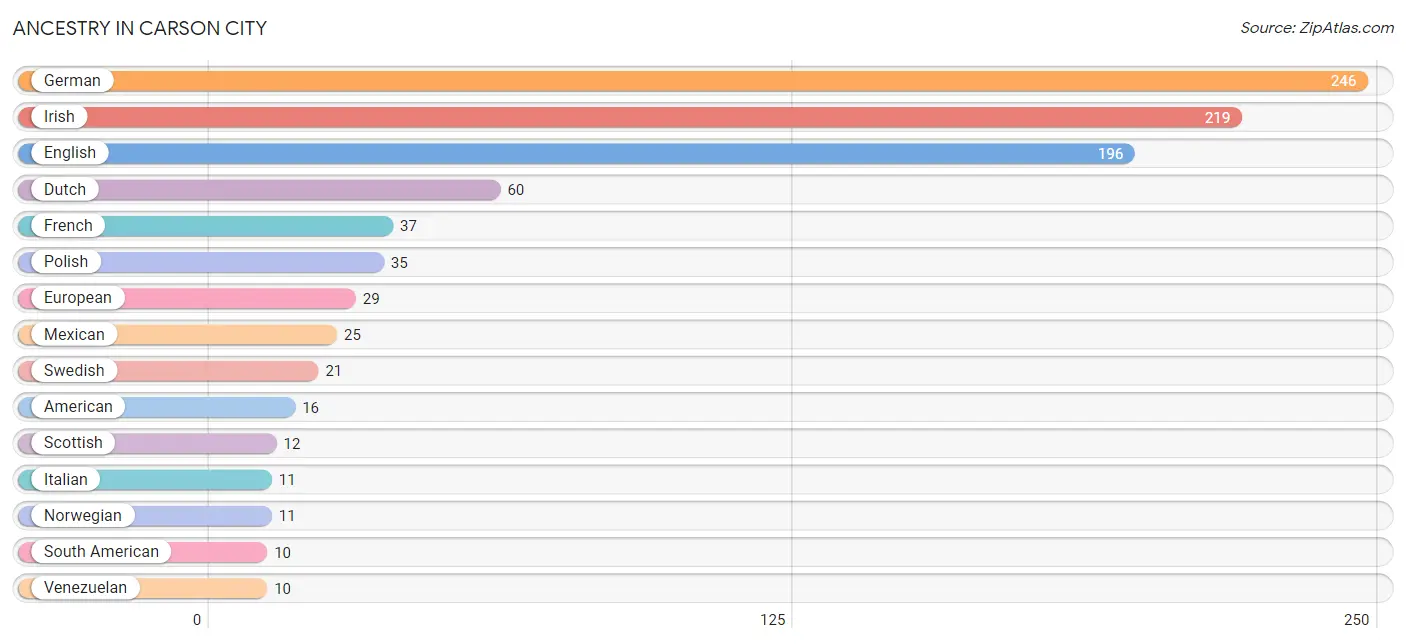
| Ancestry | # Population | % Population |
| American | 16 | 1.6% |
| Burmese | 3 | 0.3% |
| Canadian | 3 | 0.3% |
| Czech | 5 | 0.5% |
| Danish | 5 | 0.5% |
| Dutch | 60 | 6.0% |
| English | 196 | 19.5% |
| European | 29 | 2.9% |
| French | 37 | 3.7% |
| French Canadian | 9 | 0.9% |
| German | 246 | 24.4% |
| Hungarian | 3 | 0.3% |
| Irish | 219 | 21.8% |
| Italian | 11 | 1.1% |
| Mexican | 25 | 2.5% |
| Norwegian | 11 | 1.1% |
| Polish | 35 | 3.5% |
| Russian | 7 | 0.7% |
| Scandinavian | 5 | 0.5% |
| Scotch-Irish | 2 | 0.2% |
| Scottish | 12 | 1.2% |
| South American | 10 | 1.0% |
| Swedish | 21 | 2.1% |
| Venezuelan | 10 | 1.0% |
| Welsh | 3 | 0.3% | View All 25 Rows |
Immigrants in Carson City
The most numerous immigrant groups reported in Carson City came from Latin America (10 | 1.0%), Europe (8 | 0.8%), Germany (8 | 0.8%), Western Europe (8 | 0.8%), and Central America (6 | 0.6%), together accounting for 4.0% of all Carson City residents.
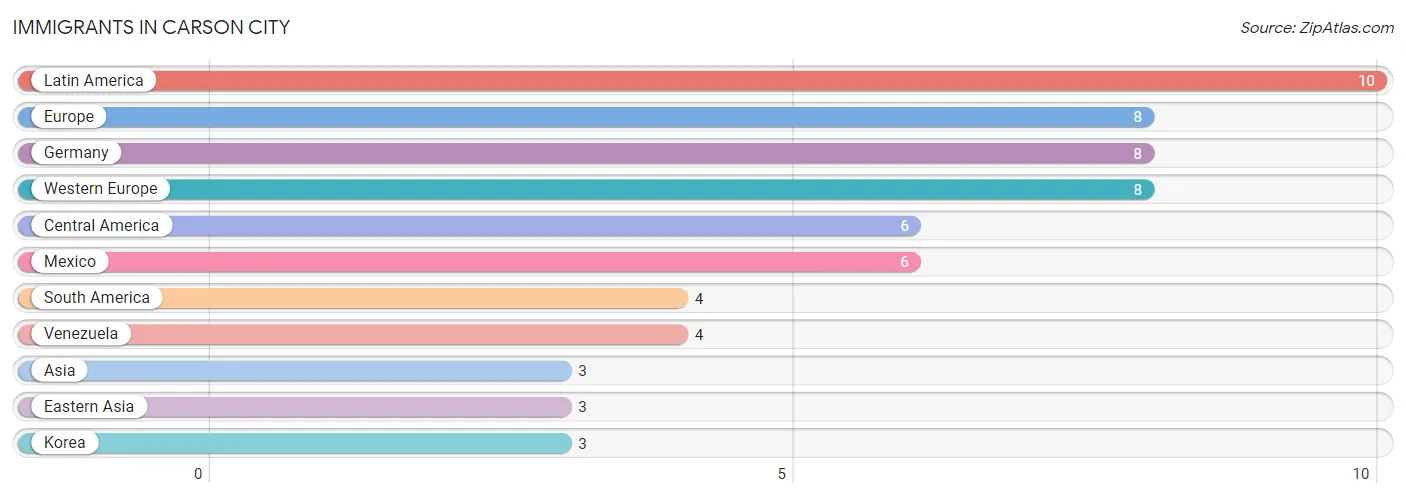
| Immigration Origin | # Population | % Population |
| Asia | 3 | 0.3% |
| Central America | 6 | 0.6% |
| Eastern Asia | 3 | 0.3% |
| Europe | 8 | 0.8% |
| Germany | 8 | 0.8% |
| Korea | 3 | 0.3% |
| Latin America | 10 | 1.0% |
| Mexico | 6 | 0.6% |
| South America | 4 | 0.4% |
| Venezuela | 4 | 0.4% |
| Western Europe | 8 | 0.8% | View All 11 Rows |
Sex and Age in Carson City
Sex and Age in Carson City
The most populous age groups in Carson City are 25 to 29 Years (104 | 20.7%) for men and 85 Years and over (53 | 10.5%) for women.
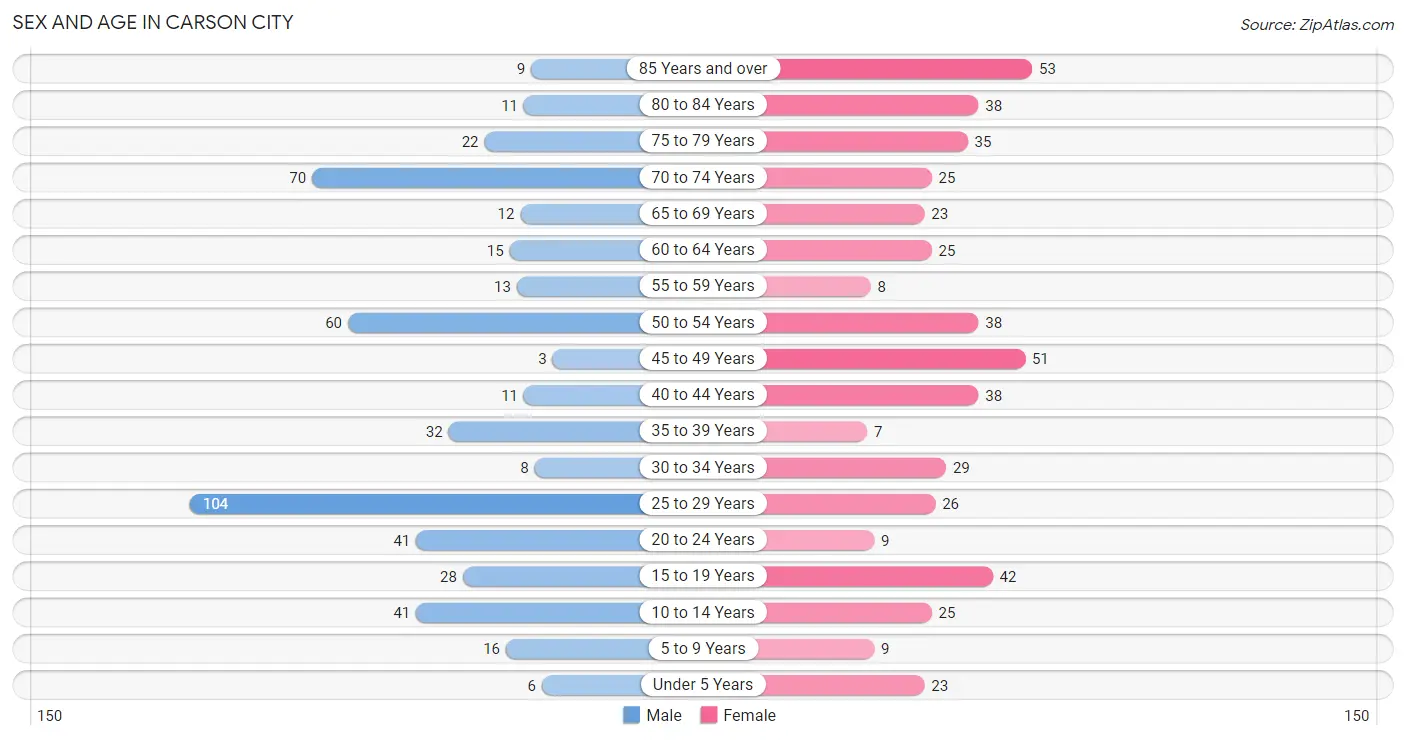
| Age Bracket | Male | Female |
| Under 5 Years | 6 (1.2%) | 23 (4.6%) |
| 5 to 9 Years | 16 (3.2%) | 9 (1.8%) |
| 10 to 14 Years | 41 (8.2%) | 25 (5.0%) |
| 15 to 19 Years | 28 (5.6%) | 42 (8.3%) |
| 20 to 24 Years | 41 (8.2%) | 9 (1.8%) |
| 25 to 29 Years | 104 (20.7%) | 26 (5.2%) |
| 30 to 34 Years | 8 (1.6%) | 29 (5.8%) |
| 35 to 39 Years | 32 (6.4%) | 7 (1.4%) |
| 40 to 44 Years | 11 (2.2%) | 38 (7.5%) |
| 45 to 49 Years | 3 (0.6%) | 51 (10.1%) |
| 50 to 54 Years | 60 (11.9%) | 38 (7.5%) |
| 55 to 59 Years | 13 (2.6%) | 8 (1.6%) |
| 60 to 64 Years | 15 (3.0%) | 25 (5.0%) |
| 65 to 69 Years | 12 (2.4%) | 23 (4.6%) |
| 70 to 74 Years | 70 (13.9%) | 25 (5.0%) |
| 75 to 79 Years | 22 (4.4%) | 35 (6.9%) |
| 80 to 84 Years | 11 (2.2%) | 38 (7.5%) |
| 85 Years and over | 9 (1.8%) | 53 (10.5%) |
| Total | 502 (100.0%) | 504 (100.0%) |
Families and Households in Carson City
Median Family Size in Carson City
The median family size in Carson City is 3.11 persons per family, with single male/father families (8 | 4.1%) accounting for the largest median family size of 3.38 persons per family. On the other hand, single female/mother families (58 | 29.6%) represent the smallest median family size with 2.76 persons per family.
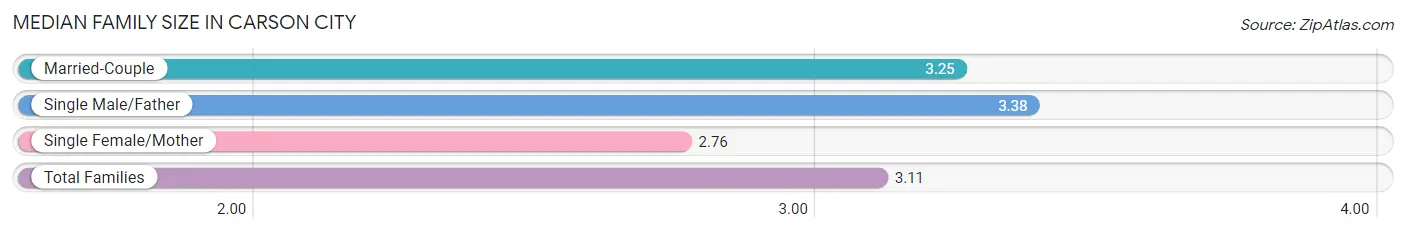
| Family Type | # Families | Family Size |
| Married-Couple | 130 (66.3%) | 3.25 |
| Single Male/Father | 8 (4.1%) | 3.38 |
| Single Female/Mother | 58 (29.6%) | 2.76 |
| Total Families | 196 (100.0%) | 3.11 |
Median Household Size in Carson City
The median household size in Carson City is 2.07 persons per household, with single male/father households (8 | 1.8%) accounting for the largest median household size of 3.38 persons per household. non-family households (254 | 56.4%) represent the smallest median household size with 1.24 persons per household.
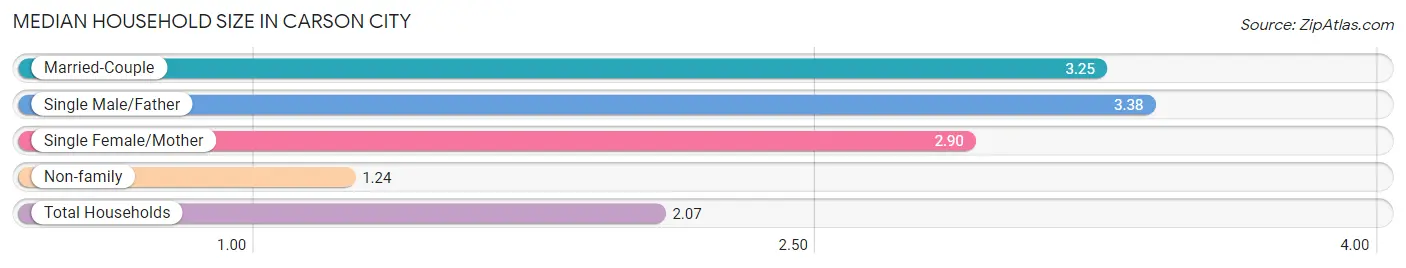
| Household Type | # Households | Household Size |
| Married-Couple | 130 (28.9%) | 3.25 |
| Single Male/Father | 8 (1.8%) | 3.38 |
| Single Female/Mother | 58 (12.9%) | 2.90 |
| Non-family | 254 (56.4%) | 1.24 |
| Total Households | 450 (100.0%) | 2.07 |
Household Size by Marriage Status in Carson City
Out of a total of 450 households in Carson City, 196 (43.6%) are family households, while 254 (56.4%) are nonfamily households. The most numerous type of family households are 2-person households, comprising 84, and the most common type of nonfamily households are 1-person households, comprising 221.
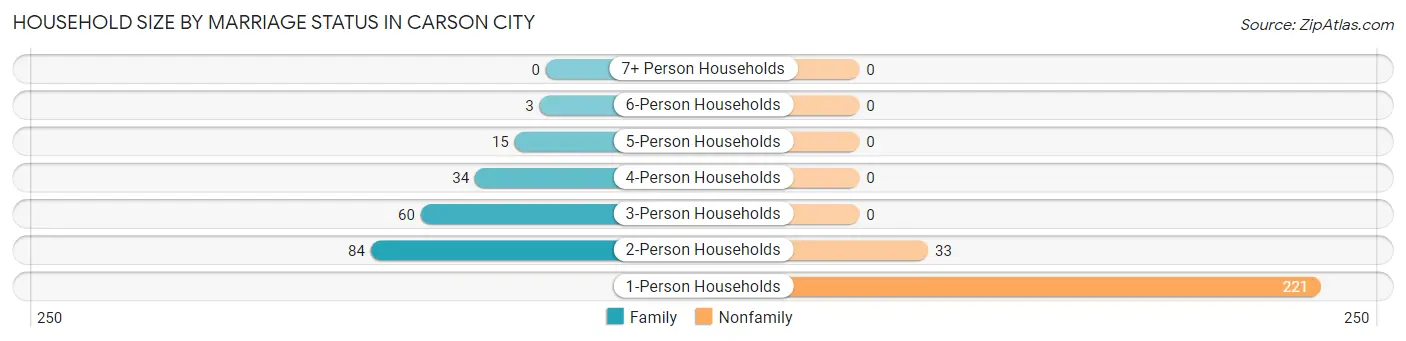
| Household Size | Family Households | Nonfamily Households |
| 1-Person Households | - | 221 (49.1%) |
| 2-Person Households | 84 (18.7%) | 33 (7.3%) |
| 3-Person Households | 60 (13.3%) | 0 (0.0%) |
| 4-Person Households | 34 (7.6%) | 0 (0.0%) |
| 5-Person Households | 15 (3.3%) | 0 (0.0%) |
| 6-Person Households | 3 (0.7%) | 0 (0.0%) |
| 7+ Person Households | 0 (0.0%) | 0 (0.0%) |
| Total | 196 (43.6%) | 254 (56.4%) |
Female Fertility in Carson City
Fertility by Age in Carson City
Average fertility rate in Carson City is 32.0 births per 1,000 women. Women in the age bracket of 20 to 34 years have the highest fertility rate with 109.0 births per 1,000 women. Women in the age bracket of 20 to 34 years acount for 100.0% of all women with births.
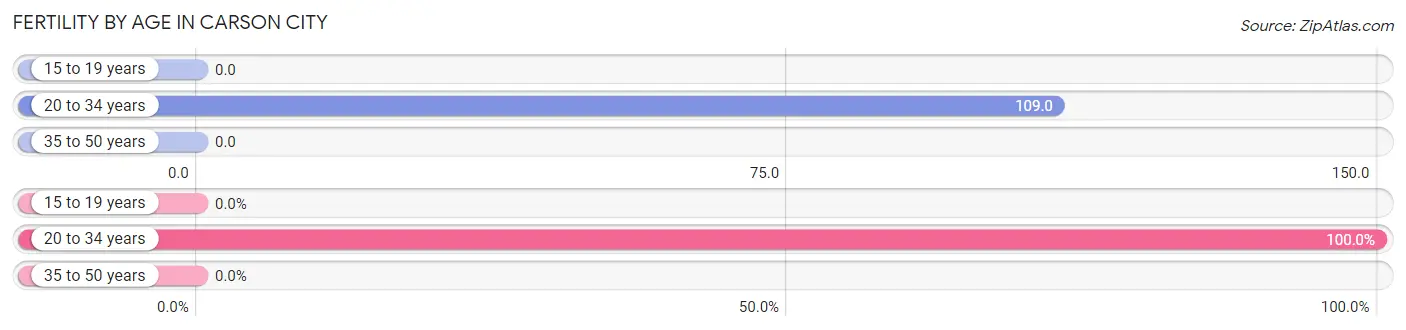
| Age Bracket | Women with Births | Births / 1,000 Women |
| 15 to 19 years | 0 (0.0%) | 0.0 |
| 20 to 34 years | 7 (100.0%) | 109.0 |
| 35 to 50 years | 0 (0.0%) | 0.0 |
| Total | 7 (100.0%) | 32.0 |
Fertility by Age by Marriage Status in Carson City
71.4% of women with births (7) in Carson City are married. The highest percentage of unmarried women with births falls into 20 to 34 years age bracket with 28.6% of them unmarried at the time of birth, while the lowest percentage of unmarried women with births belong to 20 to 34 years age bracket with 28.6% of them unmarried.
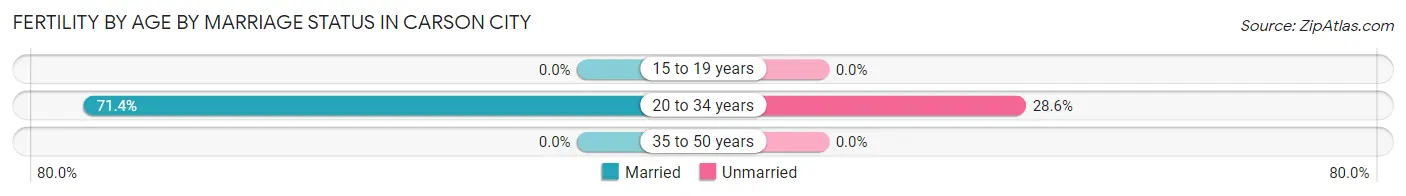
| Age Bracket | Married | Unmarried |
| 15 to 19 years | 0 (0.0%) | 0 (0.0%) |
| 20 to 34 years | 5 (71.4%) | 2 (28.6%) |
| 35 to 50 years | 0 (0.0%) | 0 (0.0%) |
| Total | 5 (71.4%) | 2 (28.6%) |
Fertility by Education in Carson City
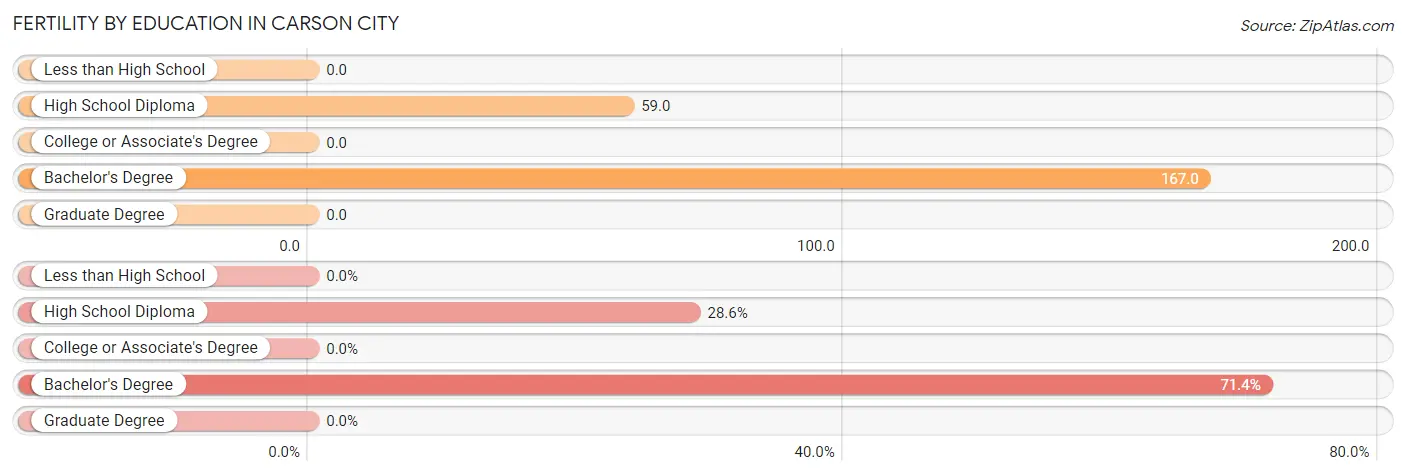
| Educational Attainment | Women with Births | Births / 1,000 Women |
| Less than High School | 0 (0.0%) | 0.0 |
| High School Diploma | 2 (28.6%) | 59.0 |
| College or Associate's Degree | 0 (0.0%) | 0.0 |
| Bachelor's Degree | 5 (71.4%) | 167.0 |
| Graduate Degree | 0 (0.0%) | 0.0 |
| Total | 7 (100.0%) | 32.0 |
Fertility by Education by Marriage Status in Carson City
28.6% of women with births in Carson City are unmarried. Women with the educational attainment of bachelor's degree are most likely to be married with 100.0% of them married at childbirth, while women with the educational attainment of high school diploma are least likely to be married with 100.0% of them unmarried at childbirth.
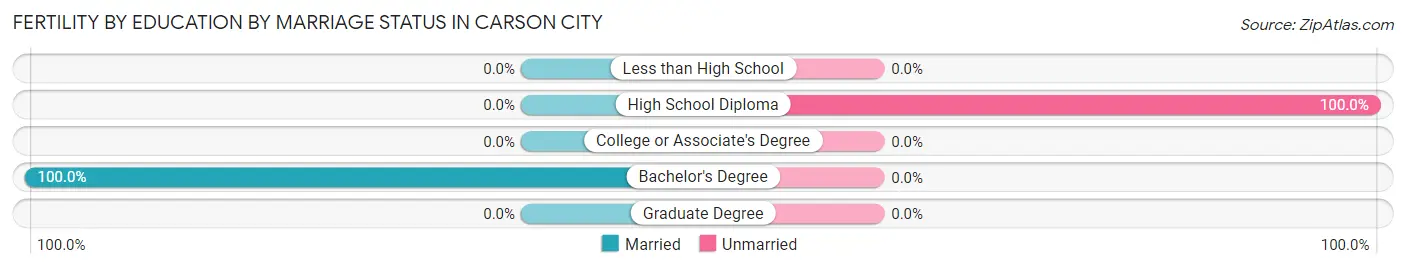
| Educational Attainment | Married | Unmarried |
| Less than High School | 0 (0.0%) | 0 (0.0%) |
| High School Diploma | 0 (0.0%) | 2 (100.0%) |
| College or Associate's Degree | 0 (0.0%) | 0 (0.0%) |
| Bachelor's Degree | 5 (100.0%) | 0 (0.0%) |
| Graduate Degree | 0 (0.0%) | 0 (0.0%) |
| Total | 5 (71.4%) | 2 (28.6%) |
Employment Characteristics in Carson City
Employment by Class of Employer in Carson City
Among the 410 employed individuals in Carson City, private company employees (278 | 67.8%), local government employees (53 | 12.9%), and not-for-profit organizations (43 | 10.5%) make up the most common classes of employment.
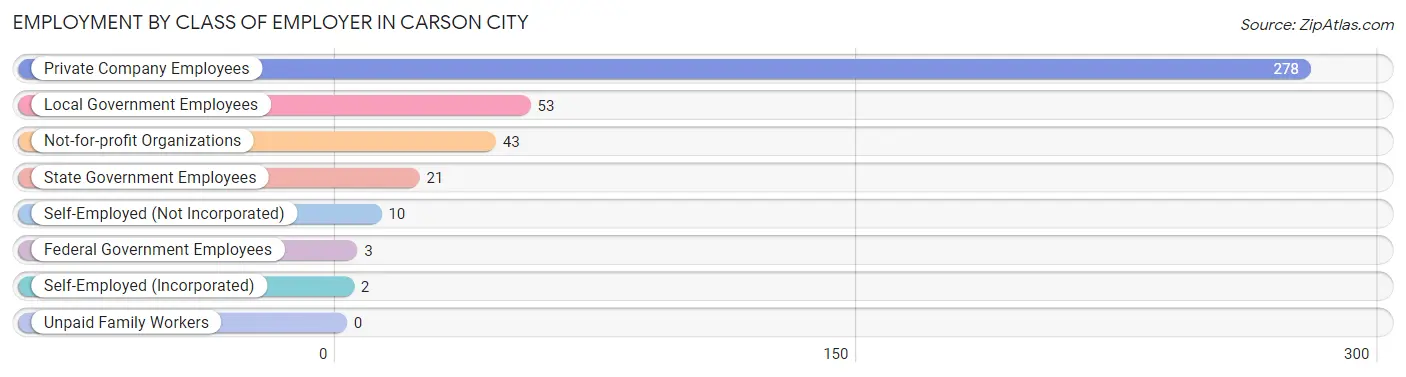
| Employer Class | # Employees | % Employees |
| Private Company Employees | 278 | 67.8% |
| Self-Employed (Incorporated) | 2 | 0.5% |
| Self-Employed (Not Incorporated) | 10 | 2.4% |
| Not-for-profit Organizations | 43 | 10.5% |
| Local Government Employees | 53 | 12.9% |
| State Government Employees | 21 | 5.1% |
| Federal Government Employees | 3 | 0.7% |
| Unpaid Family Workers | 0 | 0.0% |
| Total | 410 | 100.0% |
Employment Status by Age in Carson City
According to the labor force statistics for Carson City, out of the total population over 16 years of age (860), 50.2% or 432 individuals are in the labor force, with 4.2% or 18 of them unemployed. The age group with the highest labor force participation rate is 30 to 34 years, with 100.0% or 37 individuals in the labor force. Within the labor force, the 16 to 19 years age range has the highest percentage of unemployed individuals, with 35.7% or 10 of them being unemployed.
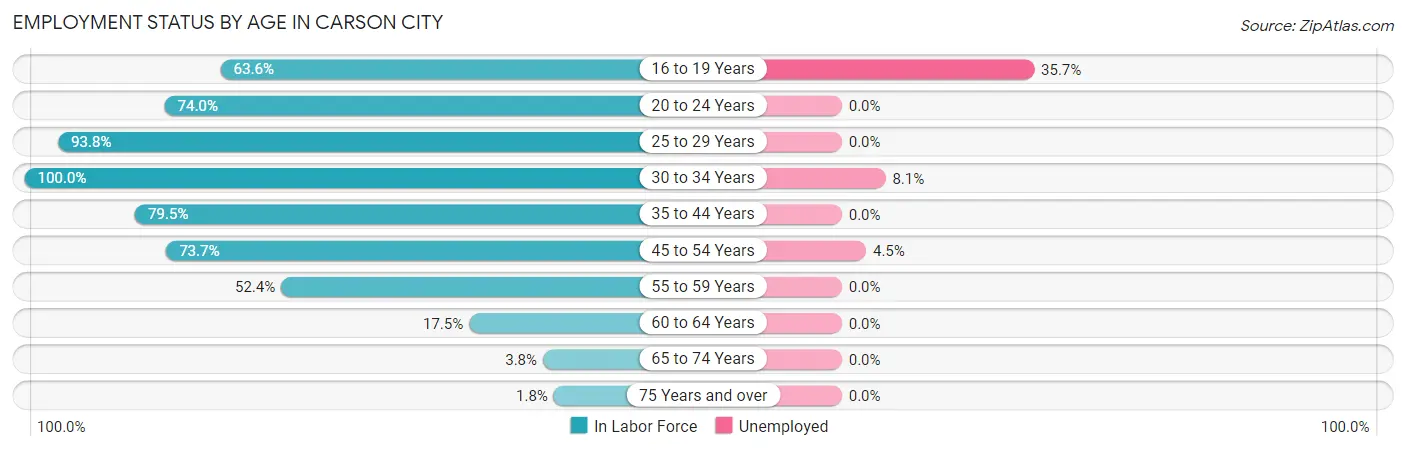
| Age Bracket | In Labor Force | Unemployed |
| 16 to 19 Years | 28 (63.6%) | 10 (35.7%) |
| 20 to 24 Years | 37 (74.0%) | 0 (0.0%) |
| 25 to 29 Years | 122 (93.8%) | 0 (0.0%) |
| 30 to 34 Years | 37 (100.0%) | 3 (8.1%) |
| 35 to 44 Years | 70 (79.5%) | 0 (0.0%) |
| 45 to 54 Years | 112 (73.7%) | 5 (4.5%) |
| 55 to 59 Years | 11 (52.4%) | 0 (0.0%) |
| 60 to 64 Years | 7 (17.5%) | 0 (0.0%) |
| 65 to 74 Years | 5 (3.8%) | 0 (0.0%) |
| 75 Years and over | 3 (1.8%) | 0 (0.0%) |
| Total | 432 (50.2%) | 18 (4.2%) |
Employment Status by Educational Attainment in Carson City
According to labor force statistics for Carson City, 76.7% of individuals (359) out of the total population between 25 and 64 years of age (468) are in the labor force, with 2.2% or 8 of them being unemployed. The group with the highest labor force participation rate are those with the educational attainment of bachelor's degree or higher, with 94.0% or 78 individuals in the labor force. Within the labor force, individuals with bachelor's degree or higher education have the highest percentage of unemployment, with 6.4% or 5 of them being unemployed.
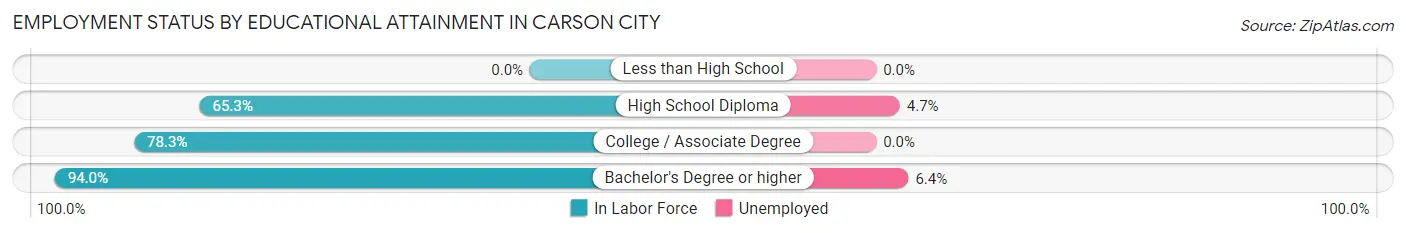
| Educational Attainment | In Labor Force | Unemployed |
| Less than High School | 0 (0.0%) | 0 (0.0%) |
| High School Diploma | 64 (65.3%) | 5 (4.7%) |
| College / Associate Degree | 217 (78.3%) | 0 (0.0%) |
| Bachelor's Degree or higher | 78 (94.0%) | 5 (6.4%) |
| Total | 359 (76.7%) | 10 (2.2%) |
Employment Occupations by Sex in Carson City
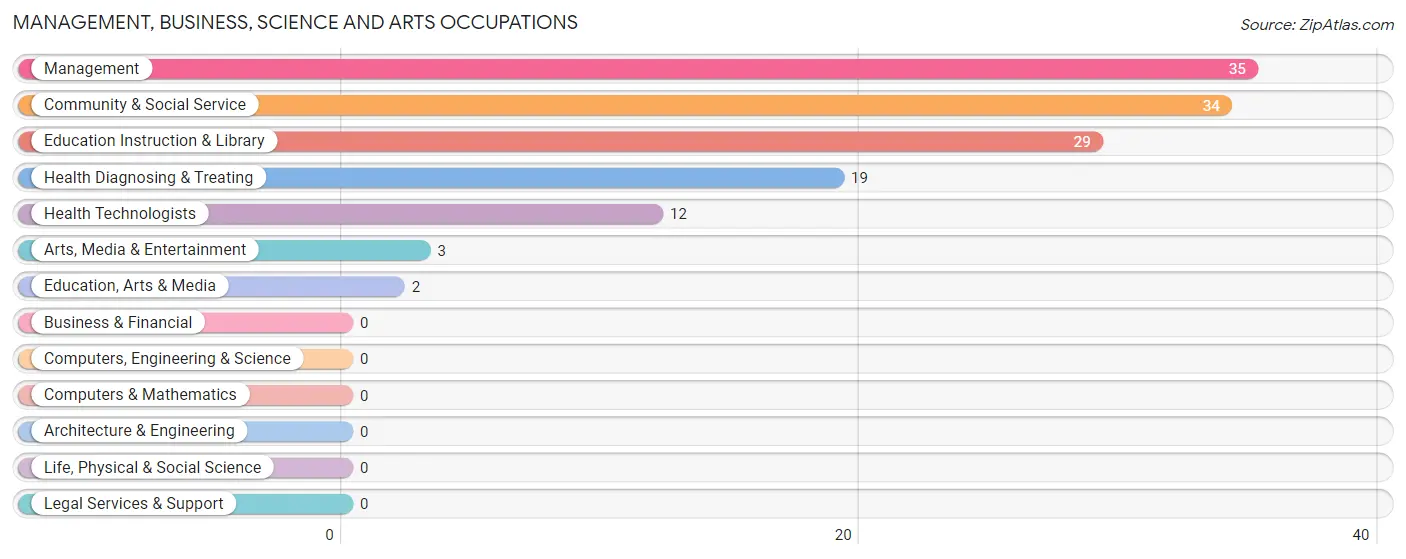
Management, Business, Science and Arts Occupations
The most common Management, Business, Science and Arts occupations in Carson City are Management (35 | 8.5%), Community & Social Service (34 | 8.2%), Education Instruction & Library (29 | 7.0%), Health Diagnosing & Treating (19 | 4.6%), and Health Technologists (12 | 2.9%).
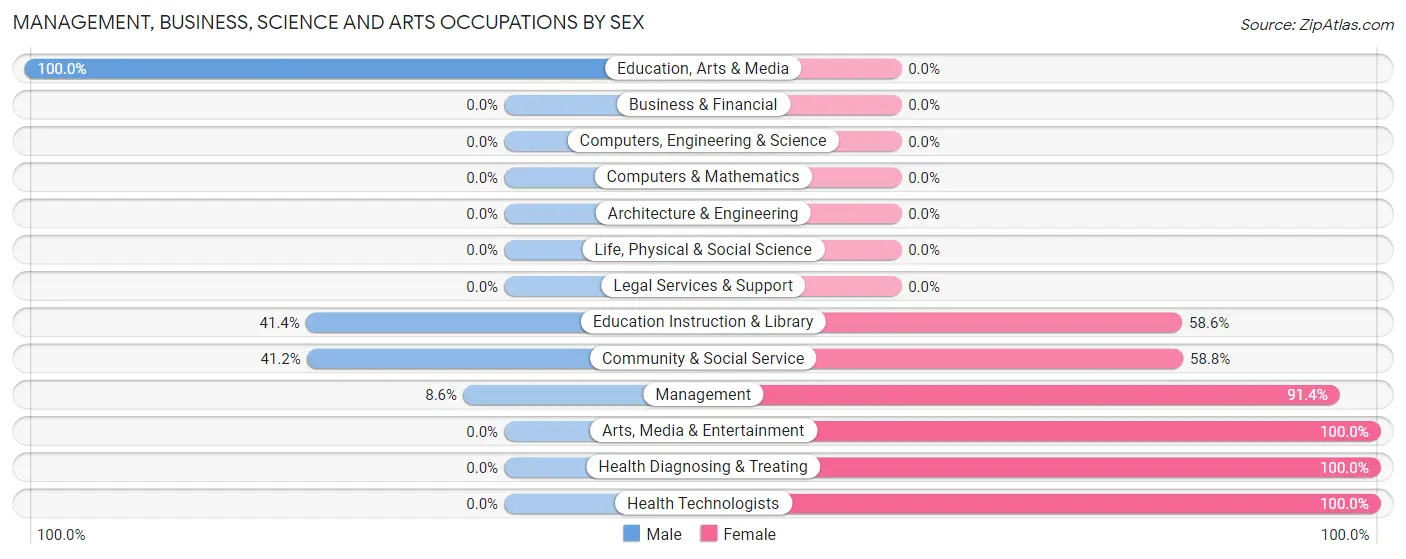
Management, Business, Science and Arts Occupations by Sex
Within the Management, Business, Science and Arts occupations in Carson City, the most male-oriented occupations are Education, Arts & Media (100.0%), Education Instruction & Library (41.4%), and Community & Social Service (41.2%), while the most female-oriented occupations are Arts, Media & Entertainment (100.0%), Health Diagnosing & Treating (100.0%), and Health Technologists (100.0%).
| Occupation | Male | Female |
| Management | 3 (8.6%) | 32 (91.4%) |
| Business & Financial | 0 (0.0%) | 0 (0.0%) |
| Computers, Engineering & Science | 0 (0.0%) | 0 (0.0%) |
| Computers & Mathematics | 0 (0.0%) | 0 (0.0%) |
| Architecture & Engineering | 0 (0.0%) | 0 (0.0%) |
| Life, Physical & Social Science | 0 (0.0%) | 0 (0.0%) |
| Community & Social Service | 14 (41.2%) | 20 (58.8%) |
| Education, Arts & Media | 2 (100.0%) | 0 (0.0%) |
| Legal Services & Support | 0 (0.0%) | 0 (0.0%) |
| Education Instruction & Library | 12 (41.4%) | 17 (58.6%) |
| Arts, Media & Entertainment | 0 (0.0%) | 3 (100.0%) |
| Health Diagnosing & Treating | 0 (0.0%) | 19 (100.0%) |
| Health Technologists | 0 (0.0%) | 12 (100.0%) |
| Total (Category) | 17 (19.3%) | 71 (80.7%) |
| Total (Overall) | 234 (56.5%) | 180 (43.5%) |
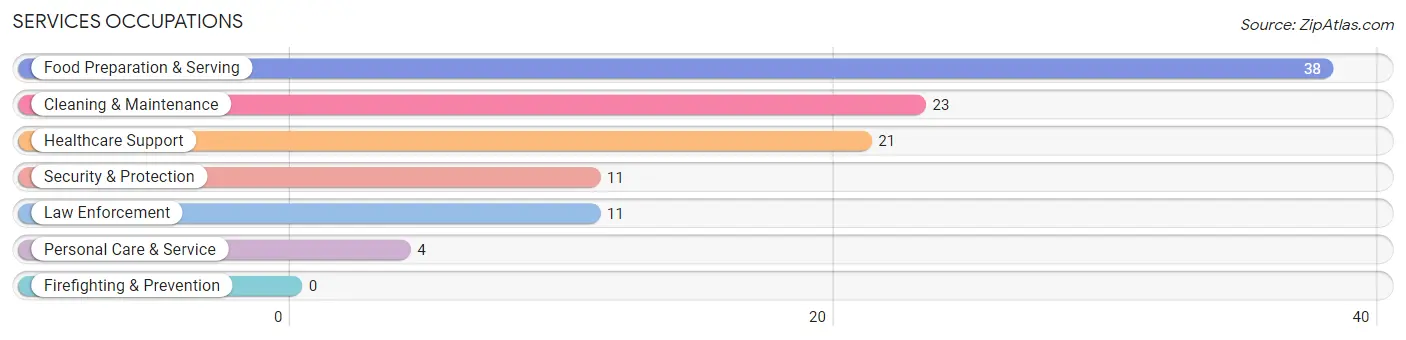
Services Occupations
The most common Services occupations in Carson City are Food Preparation & Serving (38 | 9.2%), Cleaning & Maintenance (23 | 5.6%), Healthcare Support (21 | 5.1%), Security & Protection (11 | 2.7%), and Law Enforcement (11 | 2.7%).
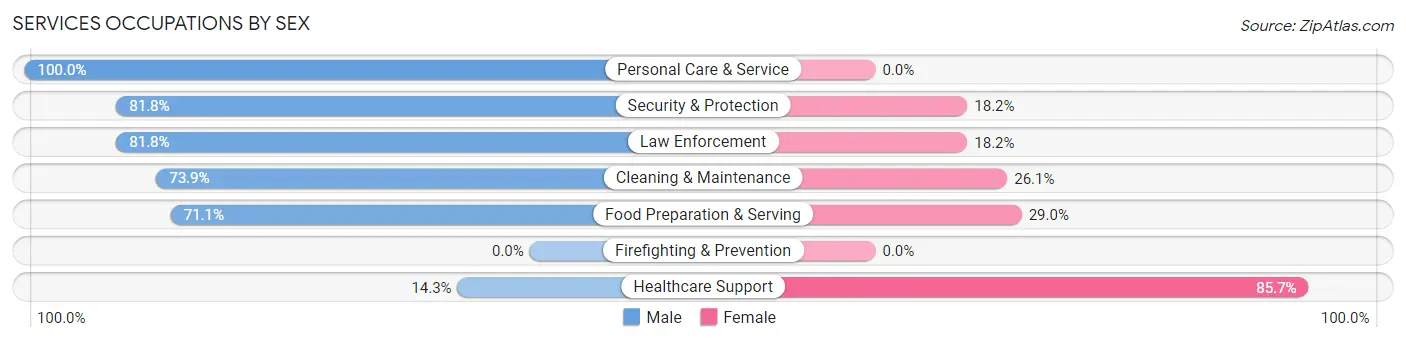
Services Occupations by Sex
Within the Services occupations in Carson City, the most male-oriented occupations are Personal Care & Service (100.0%), Security & Protection (81.8%), and Law Enforcement (81.8%), while the most female-oriented occupations are Healthcare Support (85.7%), Food Preparation & Serving (28.9%), and Cleaning & Maintenance (26.1%).
| Occupation | Male | Female |
| Healthcare Support | 3 (14.3%) | 18 (85.7%) |
| Security & Protection | 9 (81.8%) | 2 (18.2%) |
| Firefighting & Prevention | 0 (0.0%) | 0 (0.0%) |
| Law Enforcement | 9 (81.8%) | 2 (18.2%) |
| Food Preparation & Serving | 27 (71.1%) | 11 (28.9%) |
| Cleaning & Maintenance | 17 (73.9%) | 6 (26.1%) |
| Personal Care & Service | 4 (100.0%) | 0 (0.0%) |
| Total (Category) | 60 (61.9%) | 37 (38.1%) |
| Total (Overall) | 234 (56.5%) | 180 (43.5%) |
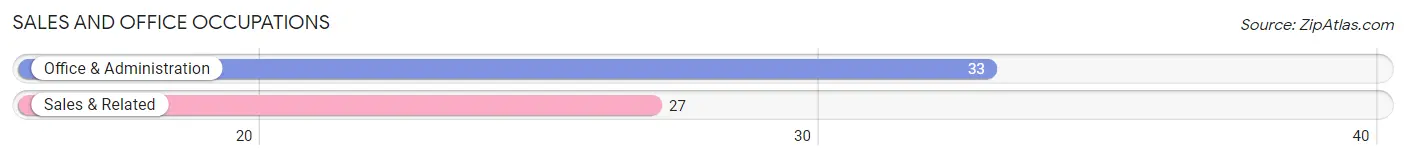
Sales and Office Occupations
The most common Sales and Office occupations in Carson City are Office & Administration (33 | 8.0%), and Sales & Related (27 | 6.5%).
Sales and Office Occupations by Sex
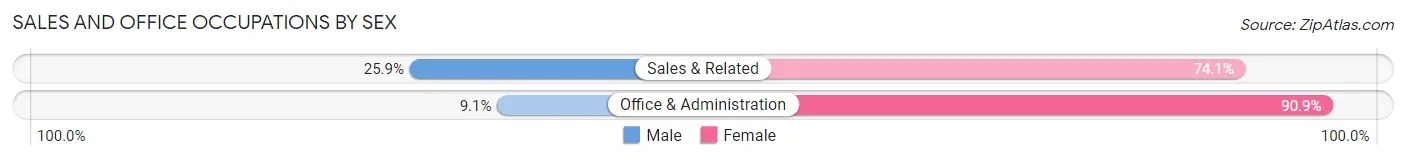
| Occupation | Male | Female |
| Sales & Related | 7 (25.9%) | 20 (74.1%) |
| Office & Administration | 3 (9.1%) | 30 (90.9%) |
| Total (Category) | 10 (16.7%) | 50 (83.3%) |
| Total (Overall) | 234 (56.5%) | 180 (43.5%) |
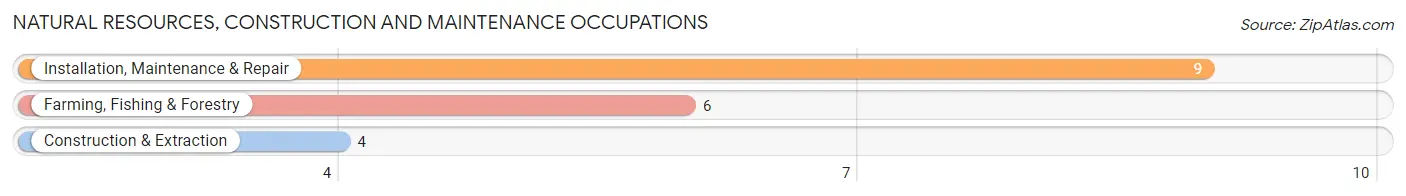
Natural Resources, Construction and Maintenance Occupations
The most common Natural Resources, Construction and Maintenance occupations in Carson City are Installation, Maintenance & Repair (9 | 2.2%), Farming, Fishing & Forestry (6 | 1.5%), and Construction & Extraction (4 | 1.0%).
Natural Resources, Construction and Maintenance Occupations by Sex
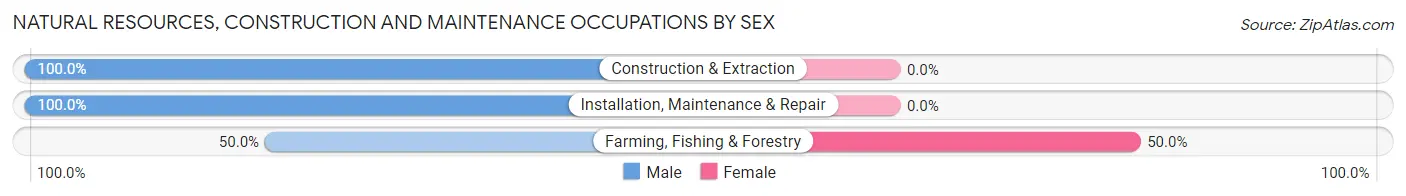
| Occupation | Male | Female |
| Farming, Fishing & Forestry | 3 (50.0%) | 3 (50.0%) |
| Construction & Extraction | 4 (100.0%) | 0 (0.0%) |
| Installation, Maintenance & Repair | 9 (100.0%) | 0 (0.0%) |
| Total (Category) | 16 (84.2%) | 3 (15.8%) |
| Total (Overall) | 234 (56.5%) | 180 (43.5%) |
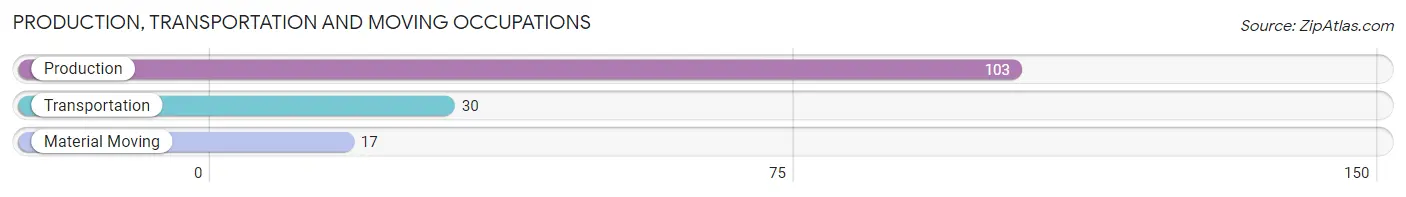
Production, Transportation and Moving Occupations
The most common Production, Transportation and Moving occupations in Carson City are Production (103 | 24.9%), Transportation (30 | 7.2%), and Material Moving (17 | 4.1%).
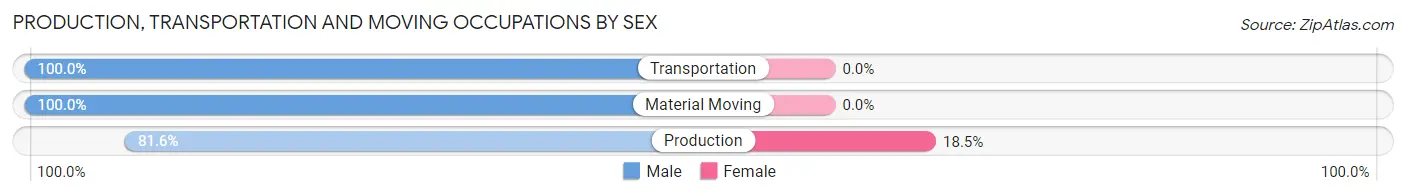
Production, Transportation and Moving Occupations by Sex
| Occupation | Male | Female |
| Production | 84 (81.6%) | 19 (18.4%) |
| Transportation | 30 (100.0%) | 0 (0.0%) |
| Material Moving | 17 (100.0%) | 0 (0.0%) |
| Total (Category) | 131 (87.3%) | 19 (12.7%) |
| Total (Overall) | 234 (56.5%) | 180 (43.5%) |
Employment Industries by Sex in Carson City
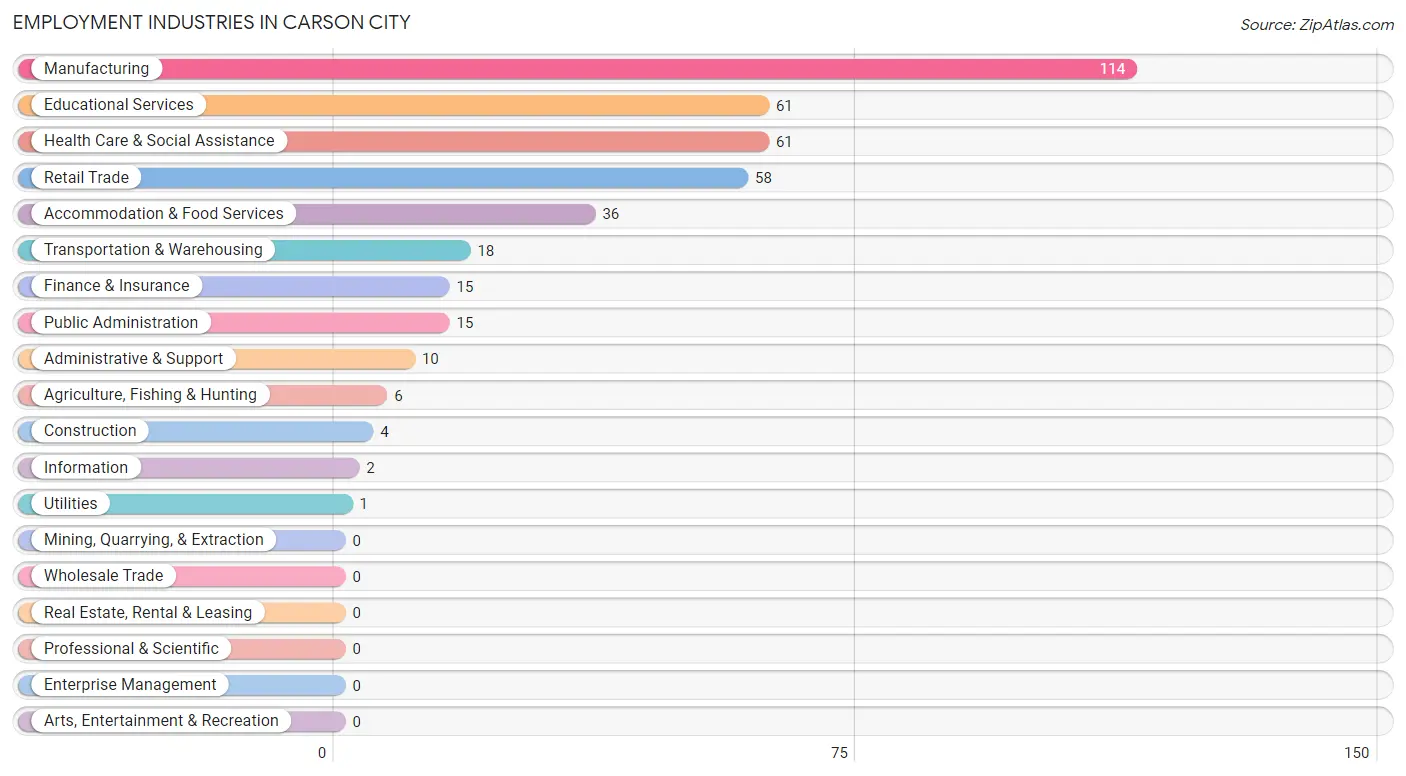
Employment Industries in Carson City
The major employment industries in Carson City include Manufacturing (114 | 27.5%), Educational Services (61 | 14.7%), Health Care & Social Assistance (61 | 14.7%), Retail Trade (58 | 14.0%), and Accommodation & Food Services (36 | 8.7%).
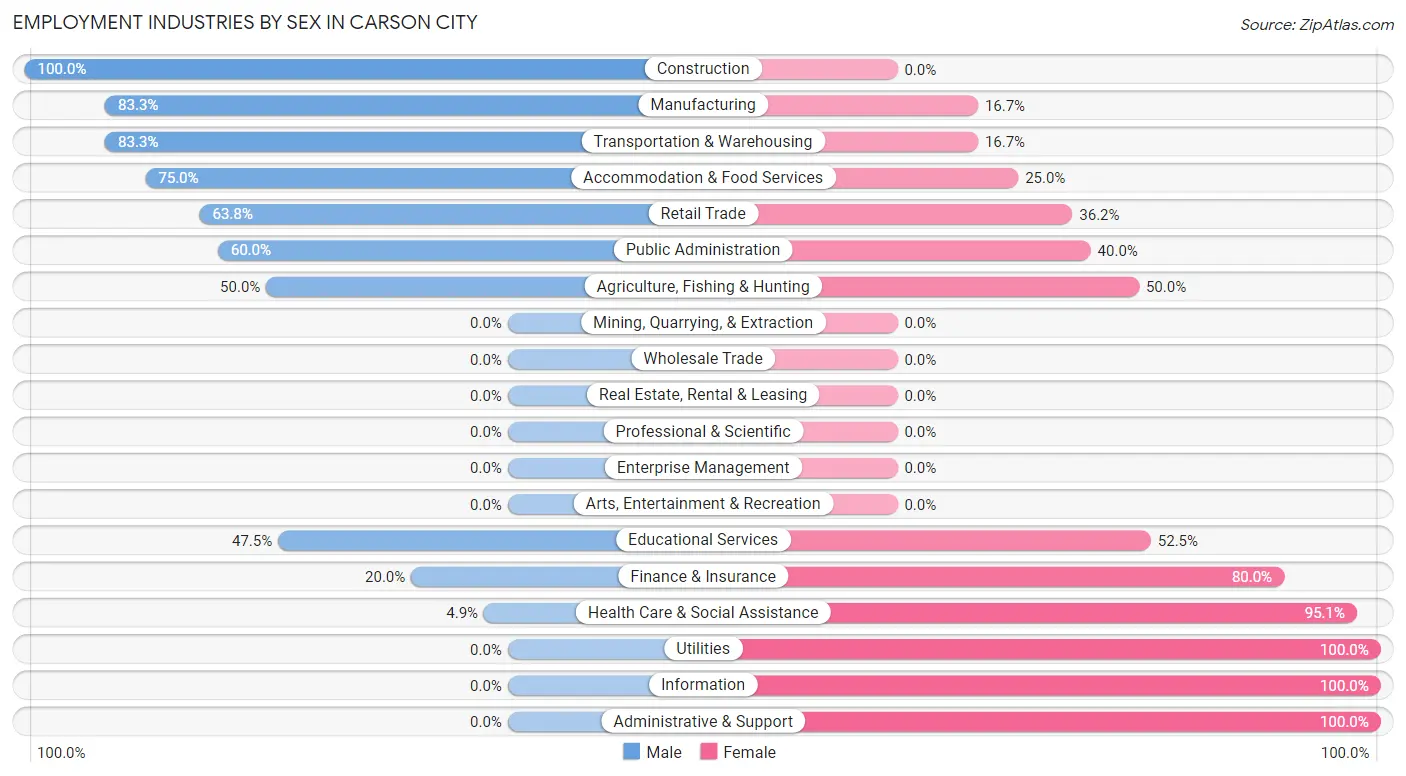
Employment Industries by Sex in Carson City
The Carson City industries that see more men than women are Construction (100.0%), Manufacturing (83.3%), and Transportation & Warehousing (83.3%), whereas the industries that tend to have a higher number of women are Utilities (100.0%), Information (100.0%), and Administrative & Support (100.0%).
| Industry | Male | Female |
| Agriculture, Fishing & Hunting | 3 (50.0%) | 3 (50.0%) |
| Mining, Quarrying, & Extraction | 0 (0.0%) | 0 (0.0%) |
| Construction | 4 (100.0%) | 0 (0.0%) |
| Manufacturing | 95 (83.3%) | 19 (16.7%) |
| Wholesale Trade | 0 (0.0%) | 0 (0.0%) |
| Retail Trade | 37 (63.8%) | 21 (36.2%) |
| Transportation & Warehousing | 15 (83.3%) | 3 (16.7%) |
| Utilities | 0 (0.0%) | 1 (100.0%) |
| Information | 0 (0.0%) | 2 (100.0%) |
| Finance & Insurance | 3 (20.0%) | 12 (80.0%) |
| Real Estate, Rental & Leasing | 0 (0.0%) | 0 (0.0%) |
| Professional & Scientific | 0 (0.0%) | 0 (0.0%) |
| Enterprise Management | 0 (0.0%) | 0 (0.0%) |
| Administrative & Support | 0 (0.0%) | 10 (100.0%) |
| Educational Services | 29 (47.5%) | 32 (52.5%) |
| Health Care & Social Assistance | 3 (4.9%) | 58 (95.1%) |
| Arts, Entertainment & Recreation | 0 (0.0%) | 0 (0.0%) |
| Accommodation & Food Services | 27 (75.0%) | 9 (25.0%) |
| Public Administration | 9 (60.0%) | 6 (40.0%) |
| Total | 234 (56.5%) | 180 (43.5%) |
Education in Carson City
School Enrollment in Carson City
The most common levels of schooling among the 265 students in Carson City are college / undergraduate (108 | 40.7%), high school (85 | 32.1%), and elementary school (30 | 11.3%).
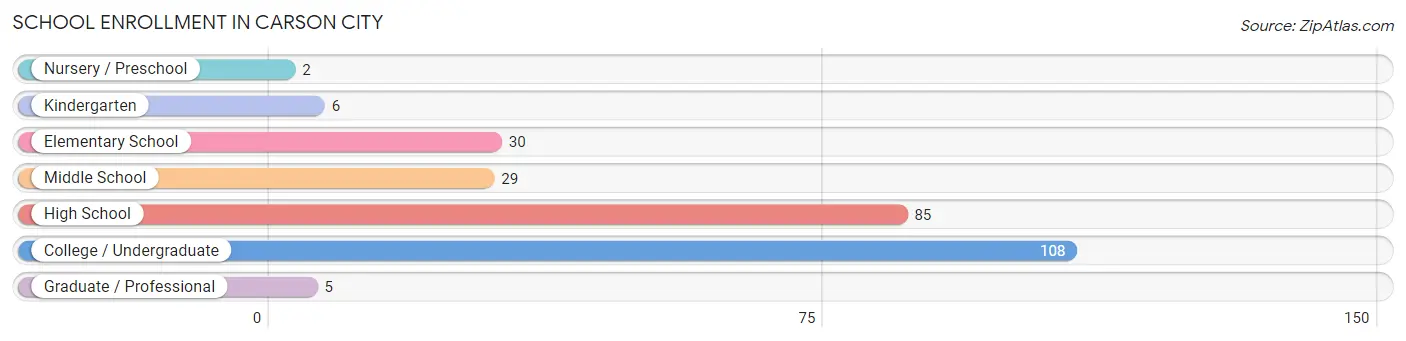
| School Level | # Students | % Students |
| Nursery / Preschool | 2 | 0.7% |
| Kindergarten | 6 | 2.3% |
| Elementary School | 30 | 11.3% |
| Middle School | 29 | 10.9% |
| High School | 85 | 32.1% |
| College / Undergraduate | 108 | 40.7% |
| Graduate / Professional | 5 | 1.9% |
| Total | 265 | 100.0% |
School Enrollment by Age by Funding Source in Carson City
Out of a total of 265 students who are enrolled in schools in Carson City, 15 (5.7%) attend a private institution, while the remaining 250 (94.3%) are enrolled in public schools. The age group of 5 to 9 year old has the highest likelihood of being enrolled in private schools, with 9 (36.0% in the age bracket) enrolled. Conversely, the age group of 15 to 17 year olds has the lowest likelihood of being enrolled in a private school, with 53 (100.0% in the age bracket) attending a public institution.
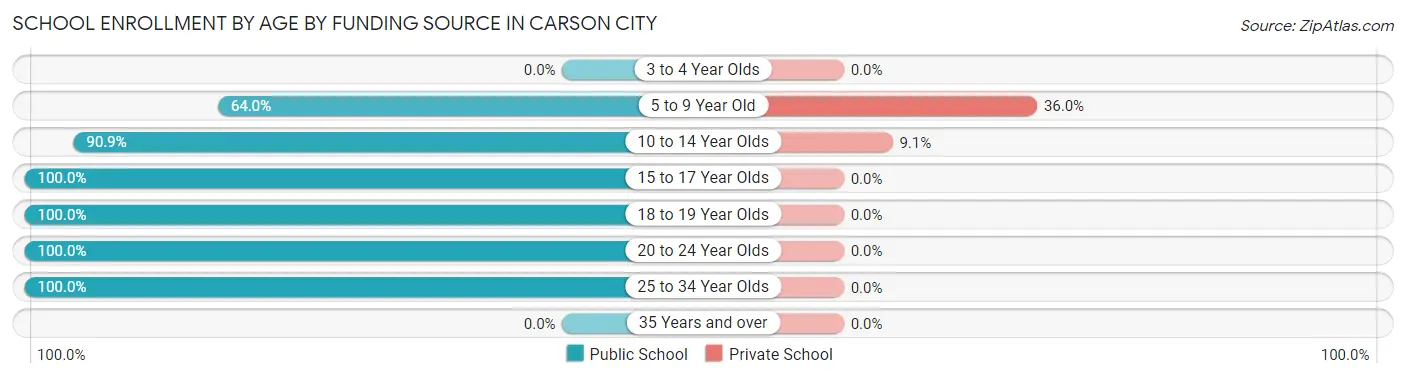
| Age Bracket | Public School | Private School |
| 3 to 4 Year Olds | 0 (0.0%) | 0 (0.0%) |
| 5 to 9 Year Old | 16 (64.0%) | 9 (36.0%) |
| 10 to 14 Year Olds | 60 (90.9%) | 6 (9.1%) |
| 15 to 17 Year Olds | 53 (100.0%) | 0 (0.0%) |
| 18 to 19 Year Olds | 11 (100.0%) | 0 (0.0%) |
| 20 to 24 Year Olds | 41 (100.0%) | 0 (0.0%) |
| 25 to 34 Year Olds | 69 (100.0%) | 0 (0.0%) |
| 35 Years and over | 0 (0.0%) | 0 (0.0%) |
| Total | 250 (94.3%) | 15 (5.7%) |
Educational Attainment by Field of Study in Carson City
Education (45 | 40.5%), science & technology (21 | 18.9%), social sciences (9 | 8.1%), business (8 | 7.2%), and engineering (6 | 5.4%) are the most common fields of study among 111 individuals in Carson City who have obtained a bachelor's degree or higher.
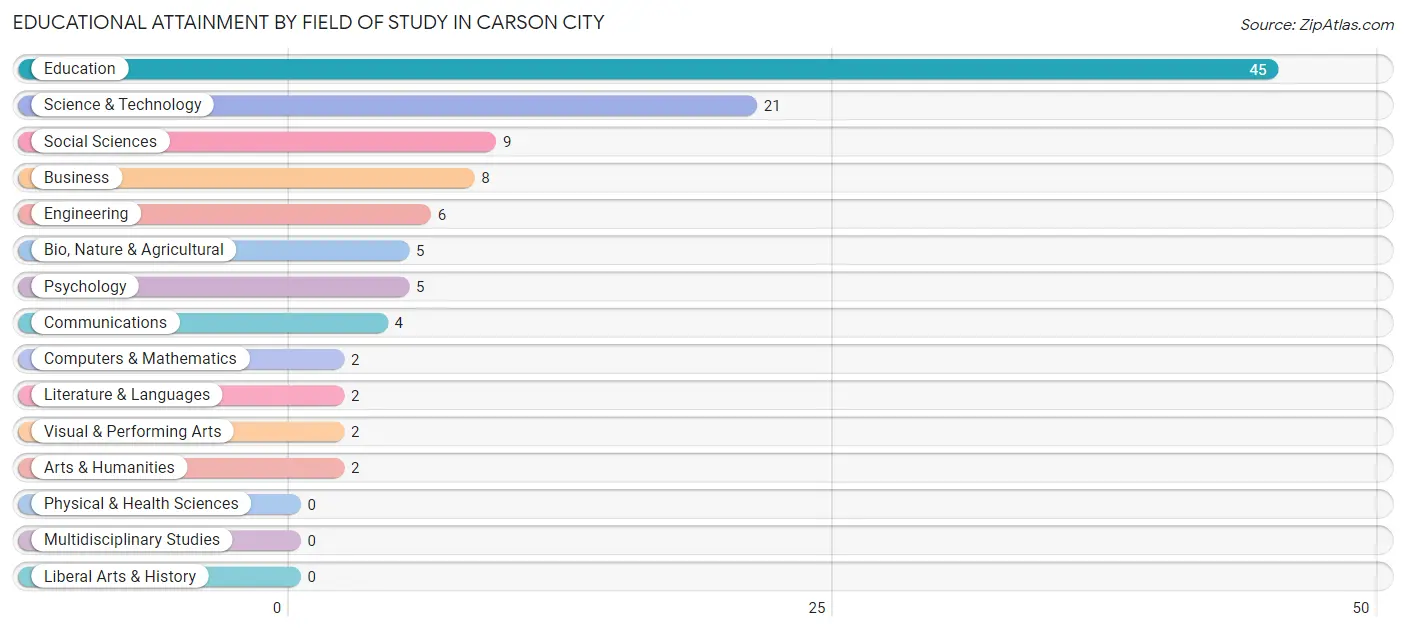
| Field of Study | # Graduates | % Graduates |
| Computers & Mathematics | 2 | 1.8% |
| Bio, Nature & Agricultural | 5 | 4.5% |
| Physical & Health Sciences | 0 | 0.0% |
| Psychology | 5 | 4.5% |
| Social Sciences | 9 | 8.1% |
| Engineering | 6 | 5.4% |
| Multidisciplinary Studies | 0 | 0.0% |
| Science & Technology | 21 | 18.9% |
| Business | 8 | 7.2% |
| Education | 45 | 40.5% |
| Literature & Languages | 2 | 1.8% |
| Liberal Arts & History | 0 | 0.0% |
| Visual & Performing Arts | 2 | 1.8% |
| Communications | 4 | 3.6% |
| Arts & Humanities | 2 | 1.8% |
| Total | 111 | 100.0% |
Transportation & Commute in Carson City
Vehicle Availability by Sex in Carson City
The most prevalent vehicle ownership categories in Carson City are males with 1 vehicle (98, accounting for 41.9%) and females with 1 vehicle (40, making up 55.7%).
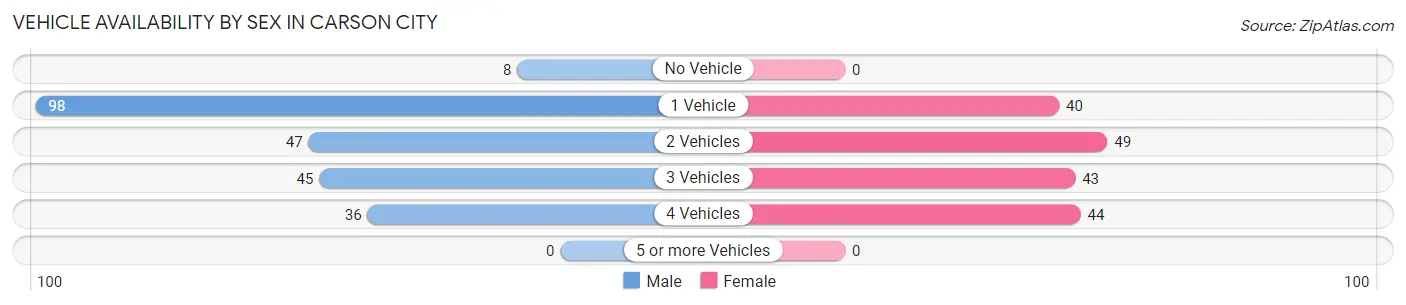
| Vehicles Available | Male | Female |
| No Vehicle | 8 (3.4%) | 0 (0.0%) |
| 1 Vehicle | 98 (41.9%) | 40 (22.7%) |
| 2 Vehicles | 47 (20.1%) | 49 (27.8%) |
| 3 Vehicles | 45 (19.2%) | 43 (24.4%) |
| 4 Vehicles | 36 (15.4%) | 44 (25.0%) |
| 5 or more Vehicles | 0 (0.0%) | 0 (0.0%) |
| Total | 234 (100.0%) | 176 (100.0%) |
Commute Time in Carson City
The most frequently occuring commute durations in Carson City are 5 to 9 minutes (135 commuters, 33.3%), less than 5 minutes (90 commuters, 22.2%), and 30 to 34 minutes (62 commuters, 15.3%).
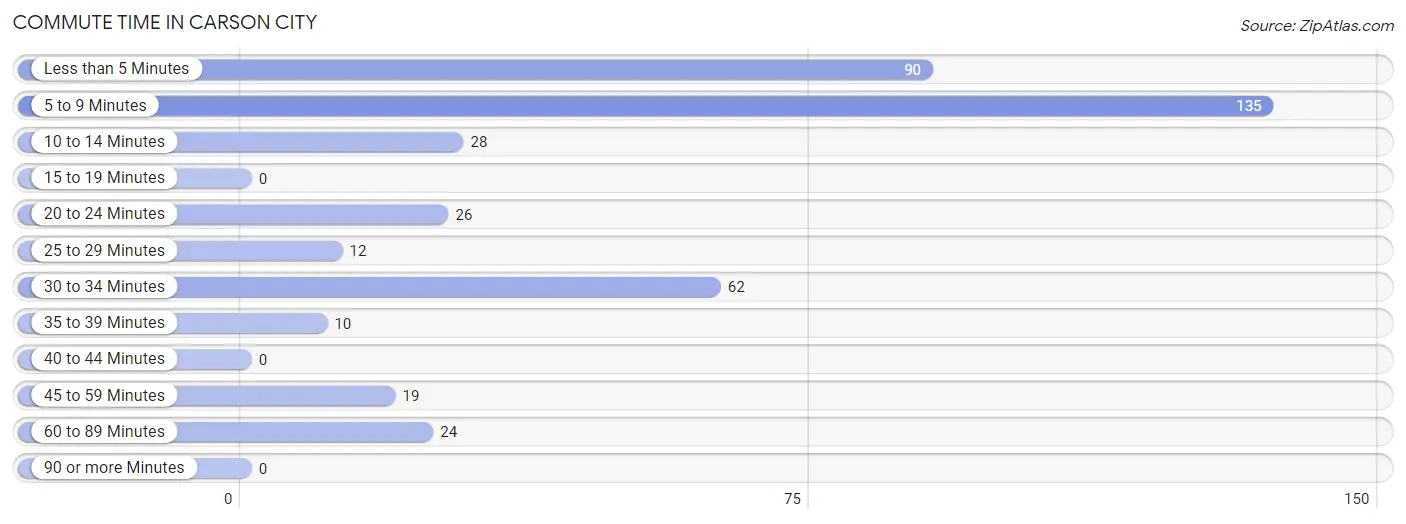
| Commute Time | # Commuters | % Commuters |
| Less than 5 Minutes | 90 | 22.2% |
| 5 to 9 Minutes | 135 | 33.3% |
| 10 to 14 Minutes | 28 | 6.9% |
| 15 to 19 Minutes | 0 | 0.0% |
| 20 to 24 Minutes | 26 | 6.4% |
| 25 to 29 Minutes | 12 | 3.0% |
| 30 to 34 Minutes | 62 | 15.3% |
| 35 to 39 Minutes | 10 | 2.5% |
| 40 to 44 Minutes | 0 | 0.0% |
| 45 to 59 Minutes | 19 | 4.7% |
| 60 to 89 Minutes | 24 | 5.9% |
| 90 or more Minutes | 0 | 0.0% |
Commute Time by Sex in Carson City
The most common commute times in Carson City are 5 to 9 minutes (100 commuters, 42.7%) for males and 30 to 34 minutes (50 commuters, 29.1%) for females.
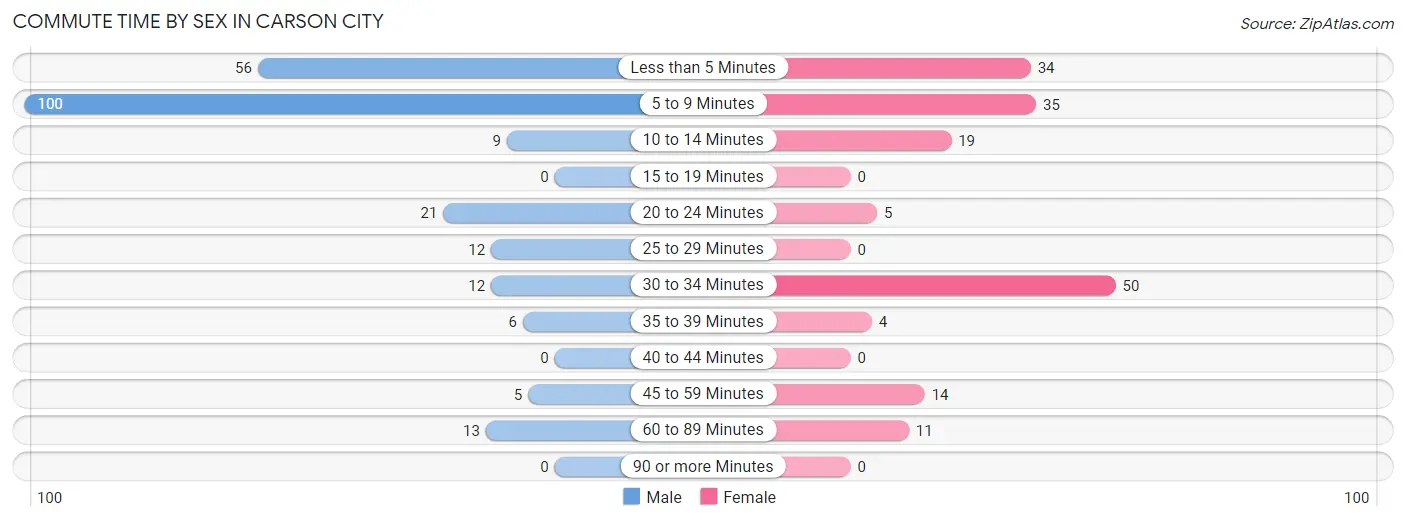
| Commute Time | Male | Female |
| Less than 5 Minutes | 56 (23.9%) | 34 (19.8%) |
| 5 to 9 Minutes | 100 (42.7%) | 35 (20.3%) |
| 10 to 14 Minutes | 9 (3.8%) | 19 (11.1%) |
| 15 to 19 Minutes | 0 (0.0%) | 0 (0.0%) |
| 20 to 24 Minutes | 21 (9.0%) | 5 (2.9%) |
| 25 to 29 Minutes | 12 (5.1%) | 0 (0.0%) |
| 30 to 34 Minutes | 12 (5.1%) | 50 (29.1%) |
| 35 to 39 Minutes | 6 (2.6%) | 4 (2.3%) |
| 40 to 44 Minutes | 0 (0.0%) | 0 (0.0%) |
| 45 to 59 Minutes | 5 (2.1%) | 14 (8.1%) |
| 60 to 89 Minutes | 13 (5.6%) | 11 (6.4%) |
| 90 or more Minutes | 0 (0.0%) | 0 (0.0%) |
Time of Departure to Work by Sex in Carson City
The most frequent times of departure to work in Carson City are 7:30 AM to 7:59 AM (80, 34.2%) for males and 8:00 AM to 8:29 AM (40, 23.3%) for females.
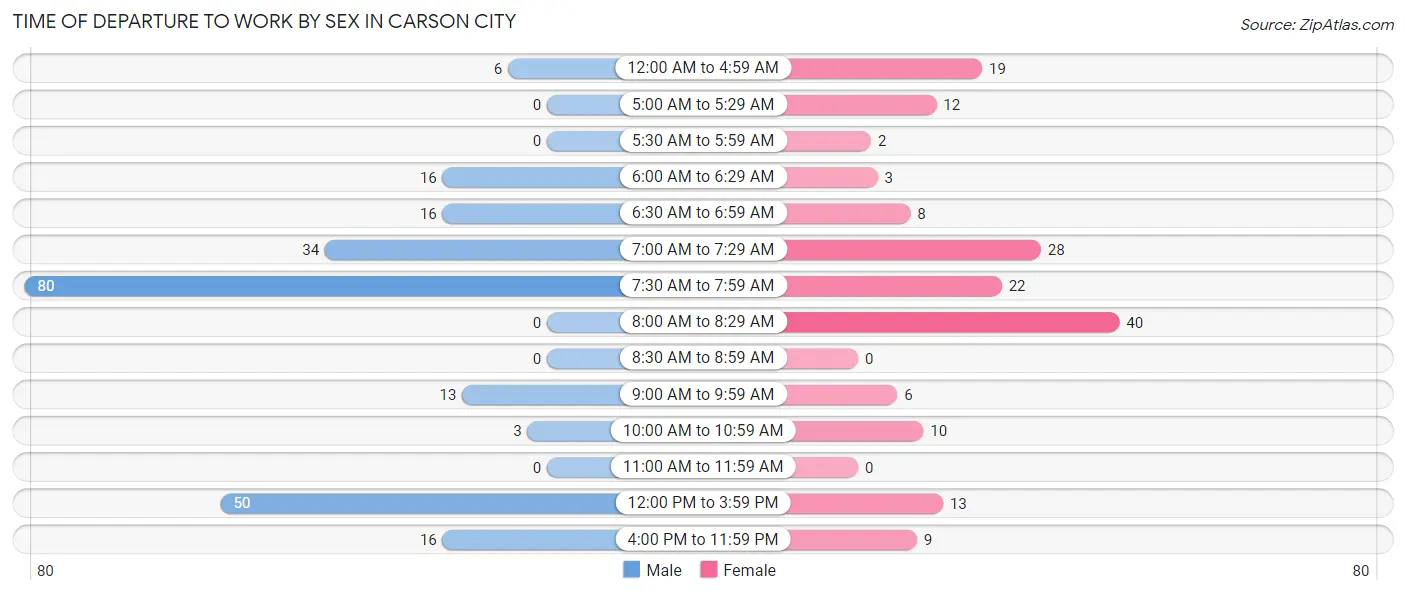
| Time of Departure | Male | Female |
| 12:00 AM to 4:59 AM | 6 (2.6%) | 19 (11.1%) |
| 5:00 AM to 5:29 AM | 0 (0.0%) | 12 (7.0%) |
| 5:30 AM to 5:59 AM | 0 (0.0%) | 2 (1.2%) |
| 6:00 AM to 6:29 AM | 16 (6.8%) | 3 (1.7%) |
| 6:30 AM to 6:59 AM | 16 (6.8%) | 8 (4.6%) |
| 7:00 AM to 7:29 AM | 34 (14.5%) | 28 (16.3%) |
| 7:30 AM to 7:59 AM | 80 (34.2%) | 22 (12.8%) |
| 8:00 AM to 8:29 AM | 0 (0.0%) | 40 (23.3%) |
| 8:30 AM to 8:59 AM | 0 (0.0%) | 0 (0.0%) |
| 9:00 AM to 9:59 AM | 13 (5.6%) | 6 (3.5%) |
| 10:00 AM to 10:59 AM | 3 (1.3%) | 10 (5.8%) |
| 11:00 AM to 11:59 AM | 0 (0.0%) | 0 (0.0%) |
| 12:00 PM to 3:59 PM | 50 (21.4%) | 13 (7.6%) |
| 4:00 PM to 11:59 PM | 16 (6.8%) | 9 (5.2%) |
| Total | 234 (100.0%) | 172 (100.0%) |
Housing Occupancy in Carson City
Occupancy by Ownership in Carson City
Of the total 450 dwellings in Carson City, owner-occupied units account for 223 (49.6%), while renter-occupied units make up 227 (50.4%).
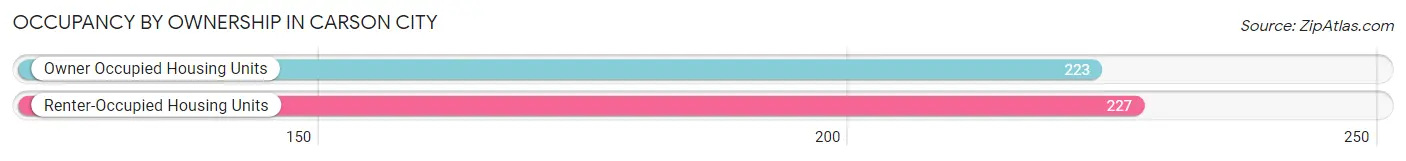
| Occupancy | # Housing Units | % Housing Units |
| Owner Occupied Housing Units | 223 | 49.6% |
| Renter-Occupied Housing Units | 227 | 50.4% |
| Total Occupied Housing Units | 450 | 100.0% |
Occupancy by Household Size in Carson City
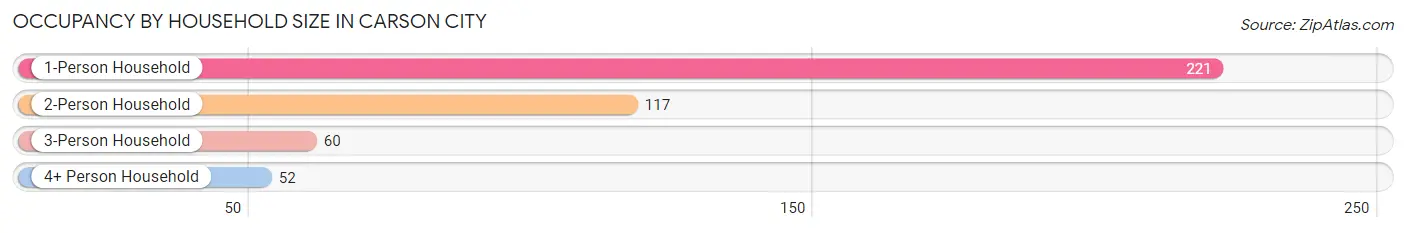
| Household Size | # Housing Units | % Housing Units |
| 1-Person Household | 221 | 49.1% |
| 2-Person Household | 117 | 26.0% |
| 3-Person Household | 60 | 13.3% |
| 4+ Person Household | 52 | 11.6% |
| Total Housing Units | 450 | 100.0% |
Occupancy by Ownership by Household Size in Carson City
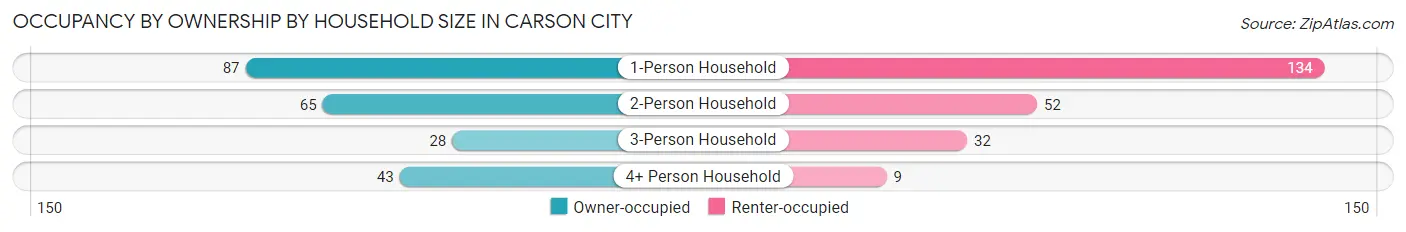
| Household Size | Owner-occupied | Renter-occupied |
| 1-Person Household | 87 (39.4%) | 134 (60.6%) |
| 2-Person Household | 65 (55.6%) | 52 (44.4%) |
| 3-Person Household | 28 (46.7%) | 32 (53.3%) |
| 4+ Person Household | 43 (82.7%) | 9 (17.3%) |
| Total Housing Units | 223 (49.6%) | 227 (50.4%) |
Occupancy by Educational Attainment in Carson City
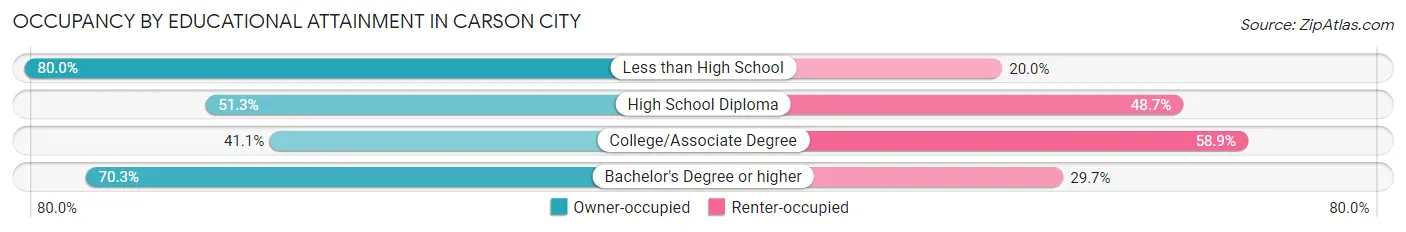
| Household Size | Owner-occupied | Renter-occupied |
| Less than High School | 8 (80.0%) | 2 (20.0%) |
| High School Diploma | 78 (51.3%) | 74 (48.7%) |
| College/Associate Degree | 92 (41.1%) | 132 (58.9%) |
| Bachelor's Degree or higher | 45 (70.3%) | 19 (29.7%) |
Occupancy by Age of Householder in Carson City
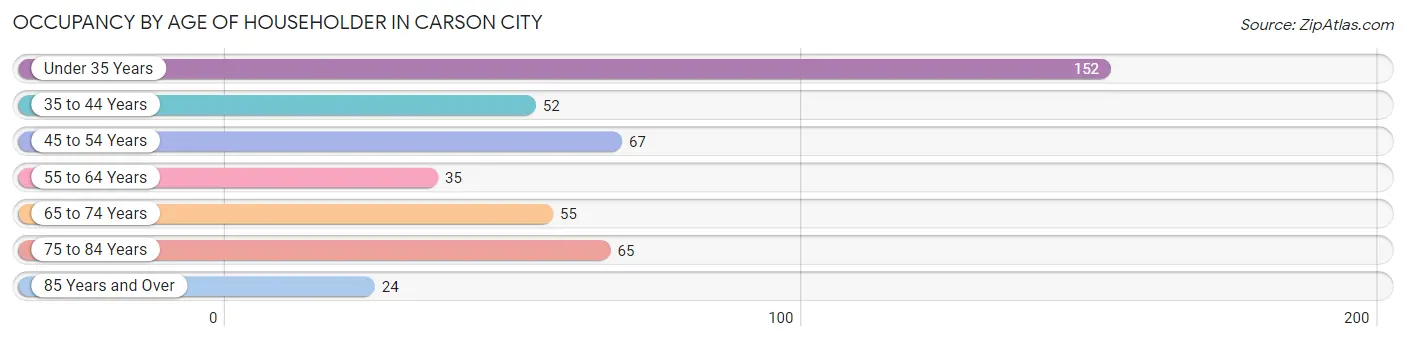
| Age Bracket | # Households | % Households |
| Under 35 Years | 152 | 33.8% |
| 35 to 44 Years | 52 | 11.6% |
| 45 to 54 Years | 67 | 14.9% |
| 55 to 64 Years | 35 | 7.8% |
| 65 to 74 Years | 55 | 12.2% |
| 75 to 84 Years | 65 | 14.4% |
| 85 Years and Over | 24 | 5.3% |
| Total | 450 | 100.0% |
Housing Finances in Carson City
Median Income by Occupancy in Carson City
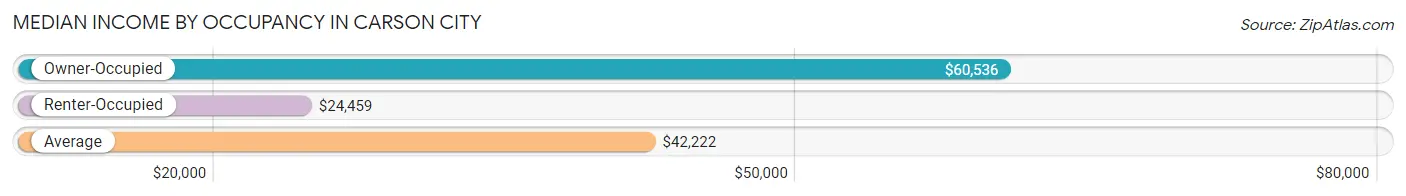
| Occupancy Type | # Households | Median Income |
| Owner-Occupied | 223 (49.6%) | $60,536 |
| Renter-Occupied | 227 (50.4%) | $24,459 |
| Average | 450 (100.0%) | $42,222 |
Occupancy by Householder Income Bracket in Carson City
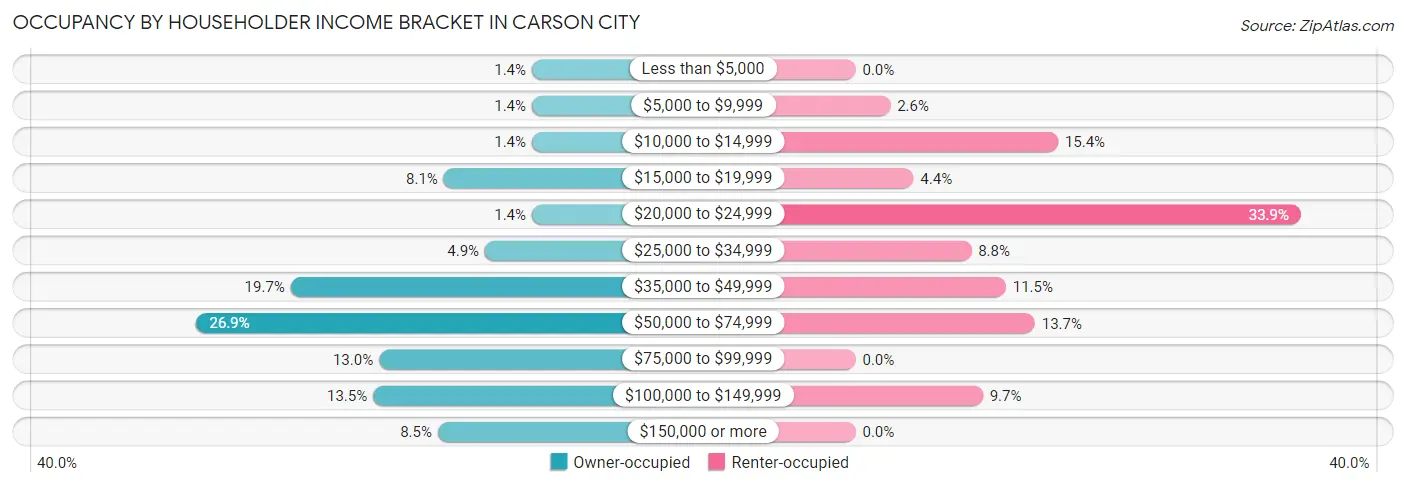
| Income Bracket | Owner-occupied | Renter-occupied |
| Less than $5,000 | 3 (1.3%) | 0 (0.0%) |
| $5,000 to $9,999 | 3 (1.3%) | 6 (2.6%) |
| $10,000 to $14,999 | 3 (1.3%) | 35 (15.4%) |
| $15,000 to $19,999 | 18 (8.1%) | 10 (4.4%) |
| $20,000 to $24,999 | 3 (1.3%) | 77 (33.9%) |
| $25,000 to $34,999 | 11 (4.9%) | 20 (8.8%) |
| $35,000 to $49,999 | 44 (19.7%) | 26 (11.5%) |
| $50,000 to $74,999 | 60 (26.9%) | 31 (13.7%) |
| $75,000 to $99,999 | 29 (13.0%) | 0 (0.0%) |
| $100,000 to $149,999 | 30 (13.5%) | 22 (9.7%) |
| $150,000 or more | 19 (8.5%) | 0 (0.0%) |
| Total | 223 (100.0%) | 227 (100.0%) |
Monthly Housing Cost Tiers in Carson City
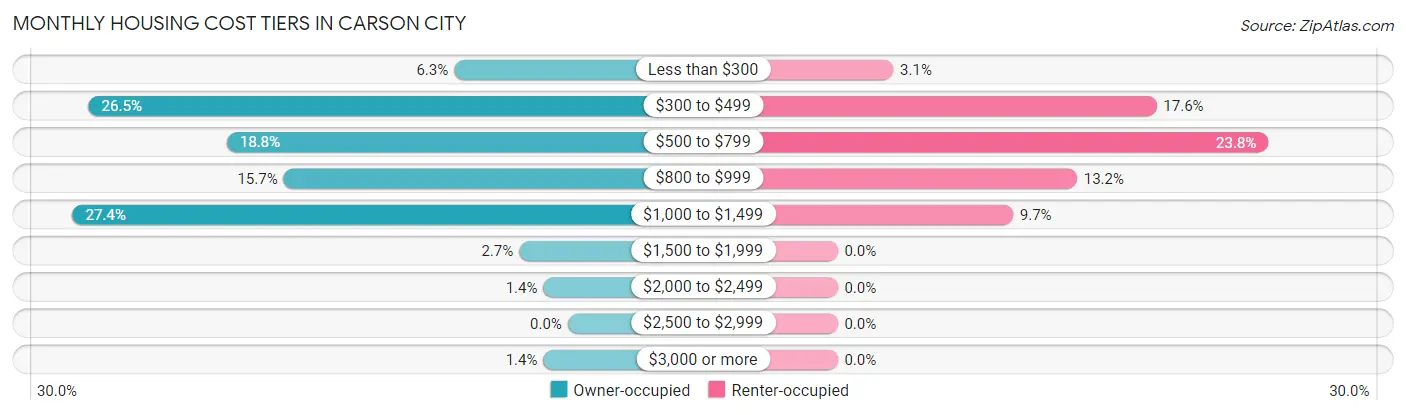
| Monthly Cost | Owner-occupied | Renter-occupied |
| Less than $300 | 14 (6.3%) | 7 (3.1%) |
| $300 to $499 | 59 (26.5%) | 40 (17.6%) |
| $500 to $799 | 42 (18.8%) | 54 (23.8%) |
| $800 to $999 | 35 (15.7%) | 30 (13.2%) |
| $1,000 to $1,499 | 61 (27.4%) | 22 (9.7%) |
| $1,500 to $1,999 | 6 (2.7%) | 0 (0.0%) |
| $2,000 to $2,499 | 3 (1.3%) | 0 (0.0%) |
| $2,500 to $2,999 | 0 (0.0%) | 0 (0.0%) |
| $3,000 or more | 3 (1.3%) | 0 (0.0%) |
| Total | 223 (100.0%) | 227 (100.0%) |
Physical Housing Characteristics in Carson City
Housing Structures in Carson City
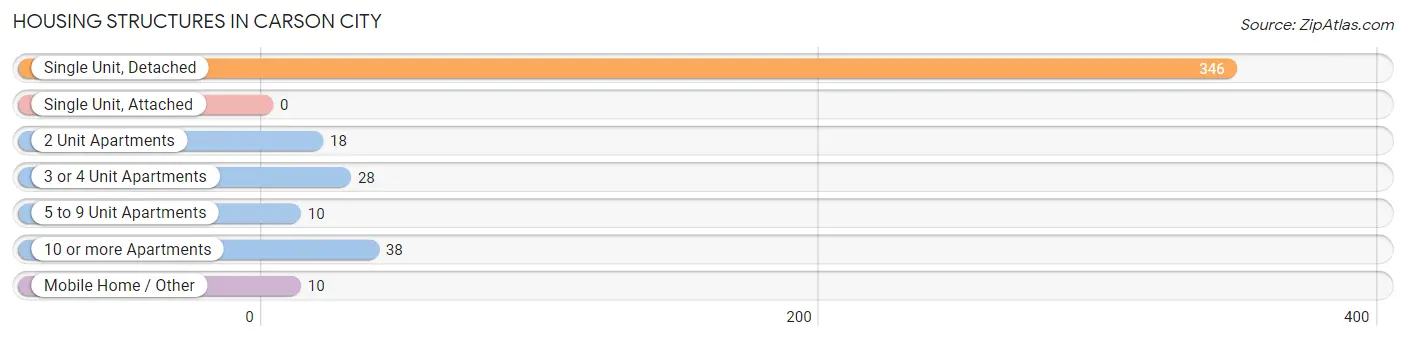
| Structure Type | # Housing Units | % Housing Units |
| Single Unit, Detached | 346 | 76.9% |
| Single Unit, Attached | 0 | 0.0% |
| 2 Unit Apartments | 18 | 4.0% |
| 3 or 4 Unit Apartments | 28 | 6.2% |
| 5 to 9 Unit Apartments | 10 | 2.2% |
| 10 or more Apartments | 38 | 8.4% |
| Mobile Home / Other | 10 | 2.2% |
| Total | 450 | 100.0% |
Housing Structures by Occupancy in Carson City
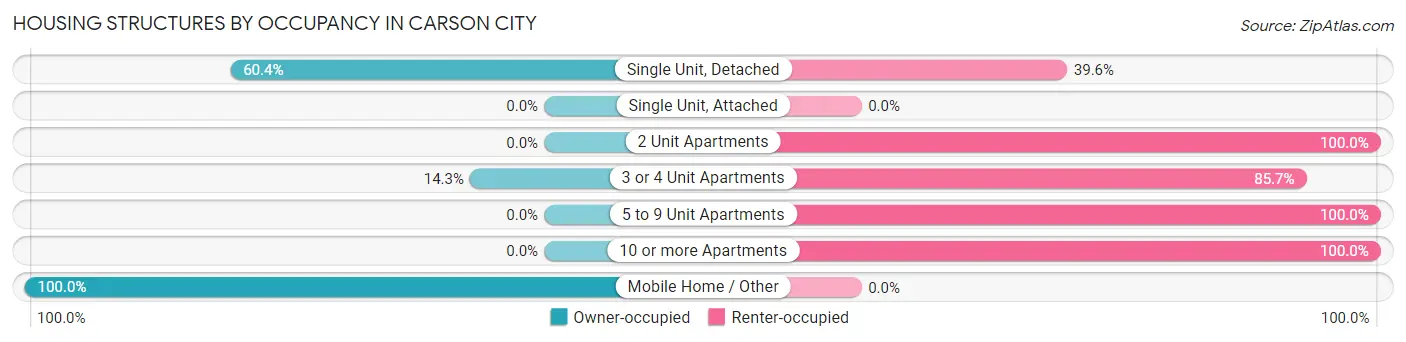
| Structure Type | Owner-occupied | Renter-occupied |
| Single Unit, Detached | 209 (60.4%) | 137 (39.6%) |
| Single Unit, Attached | 0 (0.0%) | 0 (0.0%) |
| 2 Unit Apartments | 0 (0.0%) | 18 (100.0%) |
| 3 or 4 Unit Apartments | 4 (14.3%) | 24 (85.7%) |
| 5 to 9 Unit Apartments | 0 (0.0%) | 10 (100.0%) |
| 10 or more Apartments | 0 (0.0%) | 38 (100.0%) |
| Mobile Home / Other | 10 (100.0%) | 0 (0.0%) |
| Total | 223 (49.6%) | 227 (50.4%) |
Housing Structures by Number of Rooms in Carson City
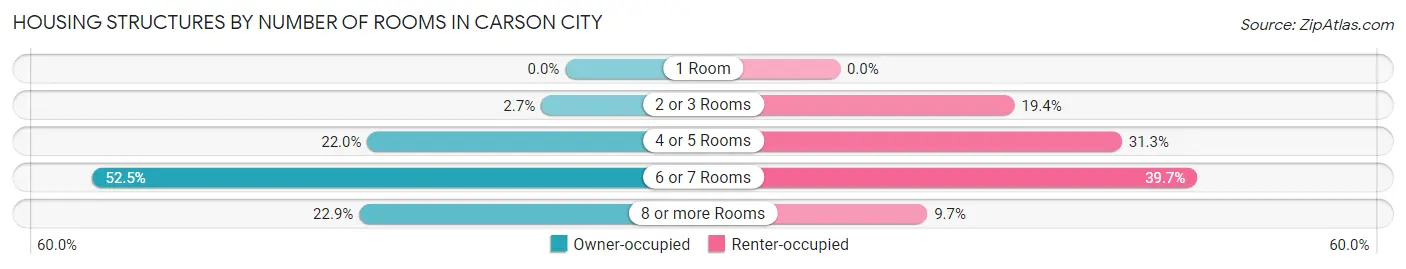
| Number of Rooms | Owner-occupied | Renter-occupied |
| 1 Room | 0 (0.0%) | 0 (0.0%) |
| 2 or 3 Rooms | 6 (2.7%) | 44 (19.4%) |
| 4 or 5 Rooms | 49 (22.0%) | 71 (31.3%) |
| 6 or 7 Rooms | 117 (52.5%) | 90 (39.7%) |
| 8 or more Rooms | 51 (22.9%) | 22 (9.7%) |
| Total | 223 (100.0%) | 227 (100.0%) |
Housing Structure by Heating Type in Carson City
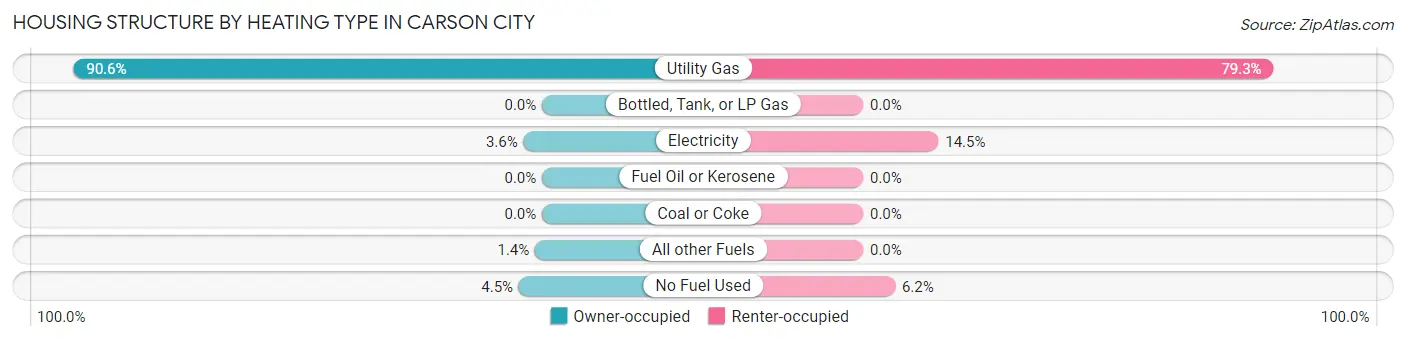
| Heating Type | Owner-occupied | Renter-occupied |
| Utility Gas | 202 (90.6%) | 180 (79.3%) |
| Bottled, Tank, or LP Gas | 0 (0.0%) | 0 (0.0%) |
| Electricity | 8 (3.6%) | 33 (14.5%) |
| Fuel Oil or Kerosene | 0 (0.0%) | 0 (0.0%) |
| Coal or Coke | 0 (0.0%) | 0 (0.0%) |
| All other Fuels | 3 (1.3%) | 0 (0.0%) |
| No Fuel Used | 10 (4.5%) | 14 (6.2%) |
| Total | 223 (100.0%) | 227 (100.0%) |
Household Vehicle Usage in Carson City
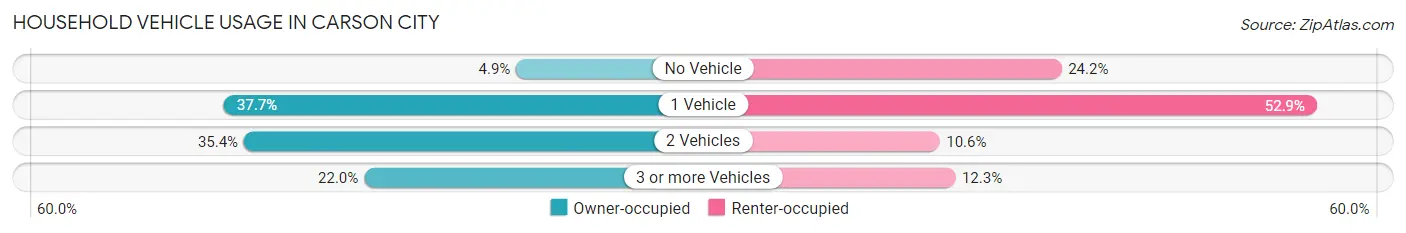
| Vehicles per Household | Owner-occupied | Renter-occupied |
| No Vehicle | 11 (4.9%) | 55 (24.2%) |
| 1 Vehicle | 84 (37.7%) | 120 (52.9%) |
| 2 Vehicles | 79 (35.4%) | 24 (10.6%) |
| 3 or more Vehicles | 49 (22.0%) | 28 (12.3%) |
| Total | 223 (100.0%) | 227 (100.0%) |
Real Estate & Mortgages in Carson City
Real Estate and Mortgage Overview in Carson City
| Characteristic | Without Mortgage | With Mortgage |
| Housing Units | 89 | 134 |
| Median Property Value | $110,400 | $98,800 |
| Median Household Income | $45,893 | $14 |
| Monthly Housing Costs | $373 | $3 |
| Real Estate Taxes | $1,713 | $0 |
Property Value by Mortgage Status in Carson City
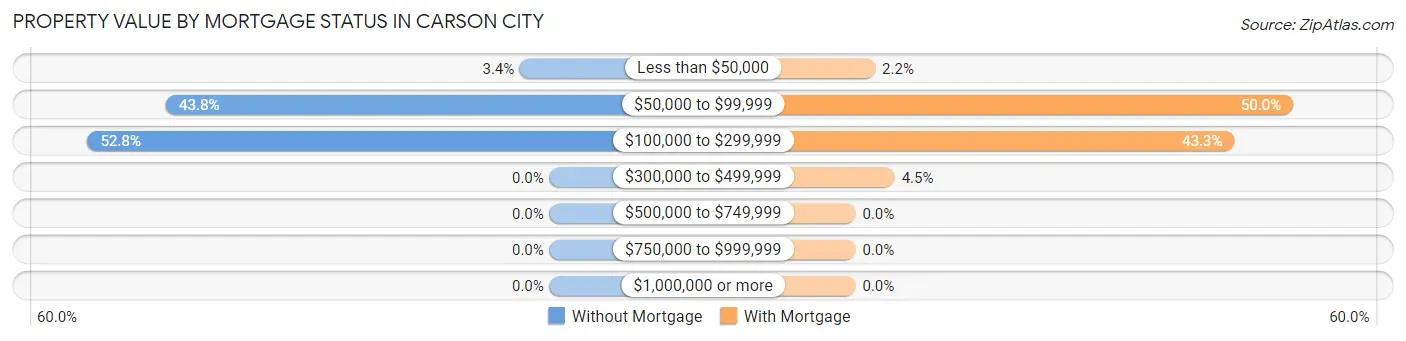
| Property Value | Without Mortgage | With Mortgage |
| Less than $50,000 | 3 (3.4%) | 3 (2.2%) |
| $50,000 to $99,999 | 39 (43.8%) | 67 (50.0%) |
| $100,000 to $299,999 | 47 (52.8%) | 58 (43.3%) |
| $300,000 to $499,999 | 0 (0.0%) | 6 (4.5%) |
| $500,000 to $749,999 | 0 (0.0%) | 0 (0.0%) |
| $750,000 to $999,999 | 0 (0.0%) | 0 (0.0%) |
| $1,000,000 or more | 0 (0.0%) | 0 (0.0%) |
| Total | 89 (100.0%) | 134 (100.0%) |
Household Income by Mortgage Status in Carson City
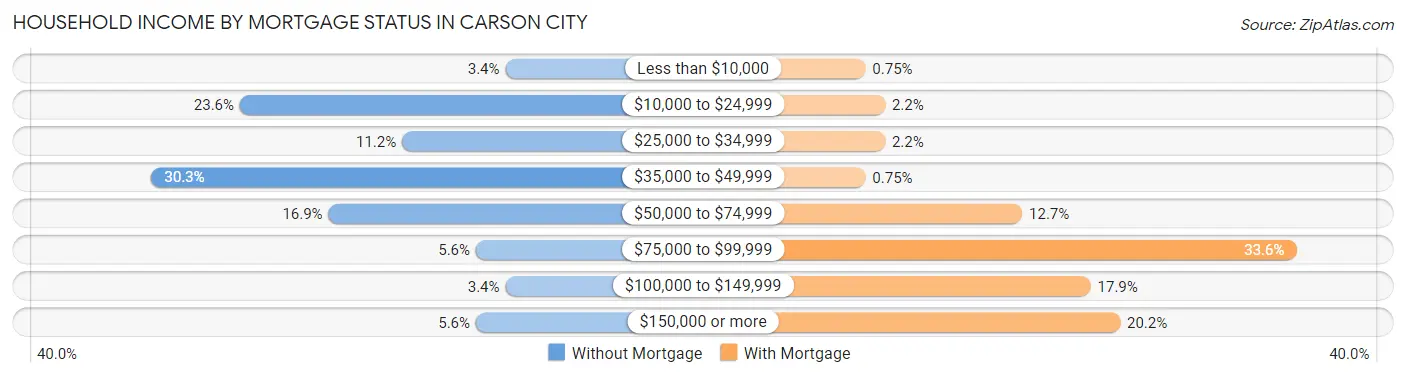
| Household Income | Without Mortgage | With Mortgage |
| Less than $10,000 | 3 (3.4%) | 1 (0.7%) |
| $10,000 to $24,999 | 21 (23.6%) | 3 (2.2%) |
| $25,000 to $34,999 | 10 (11.2%) | 3 (2.2%) |
| $35,000 to $49,999 | 27 (30.3%) | 1 (0.7%) |
| $50,000 to $74,999 | 15 (16.9%) | 17 (12.7%) |
| $75,000 to $99,999 | 5 (5.6%) | 45 (33.6%) |
| $100,000 to $149,999 | 3 (3.4%) | 24 (17.9%) |
| $150,000 or more | 5 (5.6%) | 27 (20.2%) |
| Total | 89 (100.0%) | 134 (100.0%) |
Property Value to Household Income Ratio in Carson City
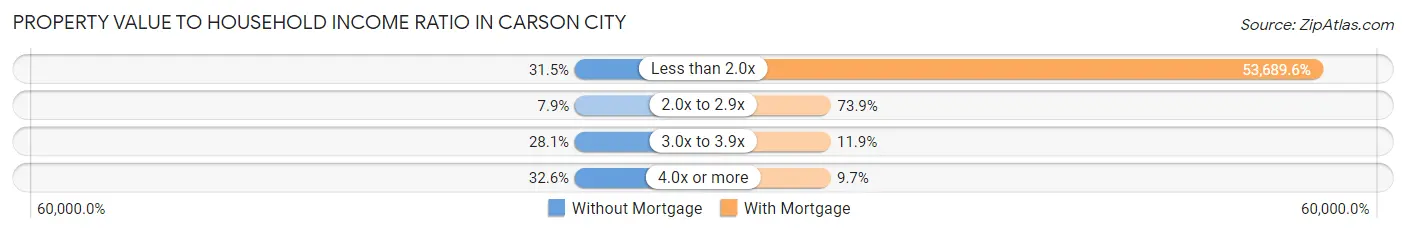
| Value-to-Income Ratio | Without Mortgage | With Mortgage |
| Less than 2.0x | 28 (31.5%) | 71,944 (53,689.5%) |
| 2.0x to 2.9x | 7 (7.9%) | 99 (73.9%) |
| 3.0x to 3.9x | 25 (28.1%) | 16 (11.9%) |
| 4.0x or more | 29 (32.6%) | 13 (9.7%) |
| Total | 89 (100.0%) | 134 (100.0%) |
Real Estate Taxes by Mortgage Status in Carson City
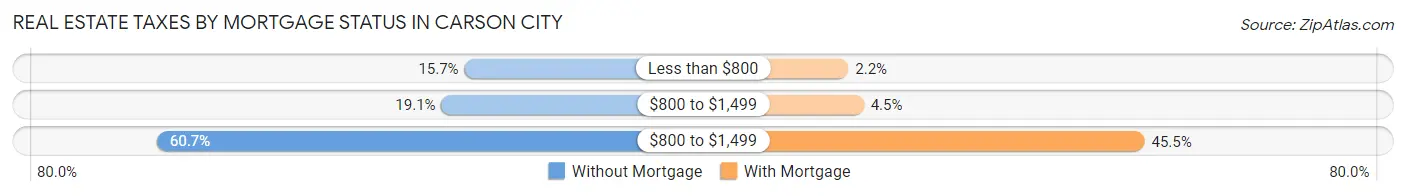
| Property Taxes | Without Mortgage | With Mortgage |
| Less than $800 | 14 (15.7%) | 3 (2.2%) |
| $800 to $1,499 | 17 (19.1%) | 6 (4.5%) |
| $800 to $1,499 | 54 (60.7%) | 61 (45.5%) |
| Total | 89 (100.0%) | 134 (100.0%) |
Health & Disability in Carson City
Health Insurance Coverage by Age in Carson City
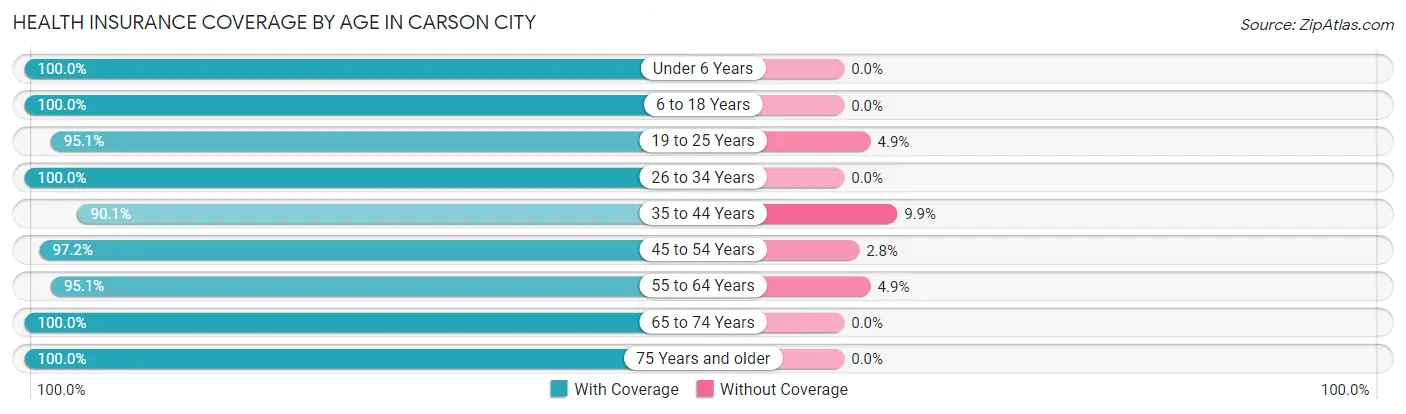
| Age Bracket | With Coverage | Without Coverage |
| Under 6 Years | 34 (100.0%) | 0 (0.0%) |
| 6 to 18 Years | 139 (100.0%) | 0 (0.0%) |
| 19 to 25 Years | 136 (95.1%) | 7 (4.9%) |
| 26 to 34 Years | 91 (100.0%) | 0 (0.0%) |
| 35 to 44 Years | 73 (90.1%) | 8 (9.9%) |
| 45 to 54 Years | 140 (97.2%) | 4 (2.8%) |
| 55 to 64 Years | 58 (95.1%) | 3 (4.9%) |
| 65 to 74 Years | 130 (100.0%) | 0 (0.0%) |
| 75 Years and older | 108 (100.0%) | 0 (0.0%) |
| Total | 909 (97.6%) | 22 (2.4%) |
Health Insurance Coverage by Citizenship Status in Carson City
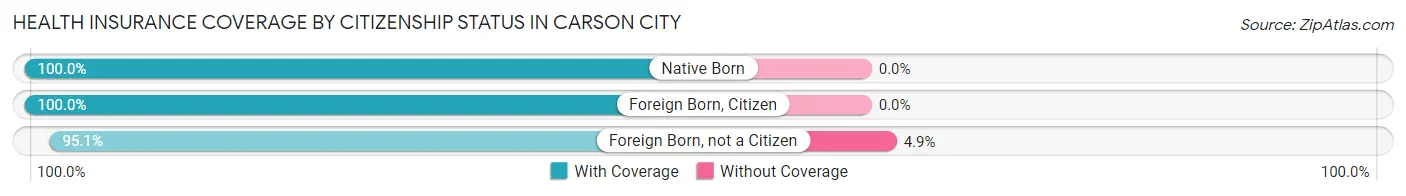
| Citizenship Status | With Coverage | Without Coverage |
| Native Born | 34 (100.0%) | 0 (0.0%) |
| Foreign Born, Citizen | 139 (100.0%) | 0 (0.0%) |
| Foreign Born, not a Citizen | 136 (95.1%) | 7 (4.9%) |
Health Insurance Coverage by Household Income in Carson City
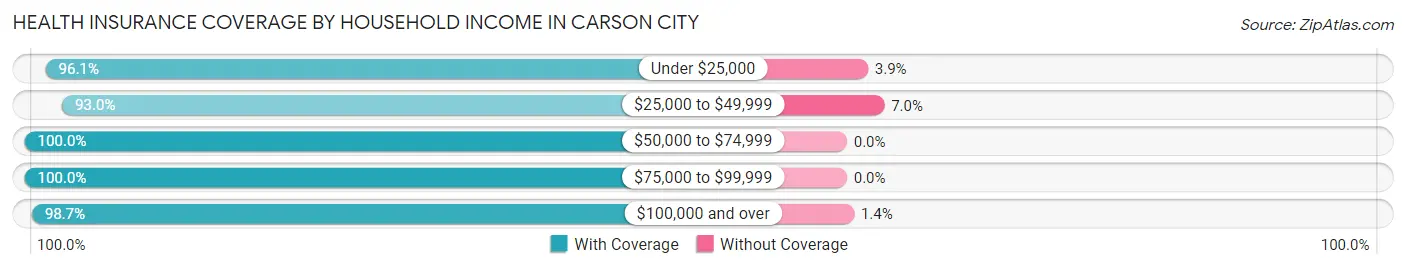
| Household Income | With Coverage | Without Coverage |
| Under $25,000 | 195 (96.1%) | 8 (3.9%) |
| $25,000 to $49,999 | 146 (93.0%) | 11 (7.0%) |
| $50,000 to $74,999 | 253 (100.0%) | 0 (0.0%) |
| $75,000 to $99,999 | 95 (100.0%) | 0 (0.0%) |
| $100,000 and over | 220 (98.7%) | 3 (1.3%) |
Public vs Private Health Insurance Coverage by Age in Carson City
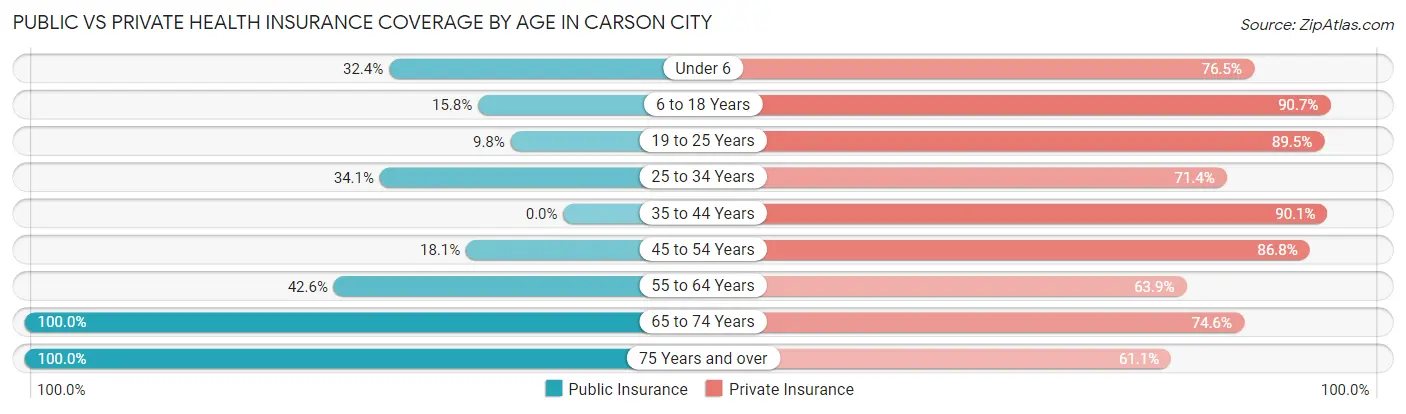
| Age Bracket | Public Insurance | Private Insurance |
| Under 6 | 11 (32.4%) | 26 (76.5%) |
| 6 to 18 Years | 22 (15.8%) | 126 (90.6%) |
| 19 to 25 Years | 14 (9.8%) | 128 (89.5%) |
| 25 to 34 Years | 31 (34.1%) | 65 (71.4%) |
| 35 to 44 Years | 0 (0.0%) | 73 (90.1%) |
| 45 to 54 Years | 26 (18.1%) | 125 (86.8%) |
| 55 to 64 Years | 26 (42.6%) | 39 (63.9%) |
| 65 to 74 Years | 130 (100.0%) | 97 (74.6%) |
| 75 Years and over | 108 (100.0%) | 66 (61.1%) |
| Total | 368 (39.5%) | 745 (80.0%) |
Disability Status by Sex by Age in Carson City
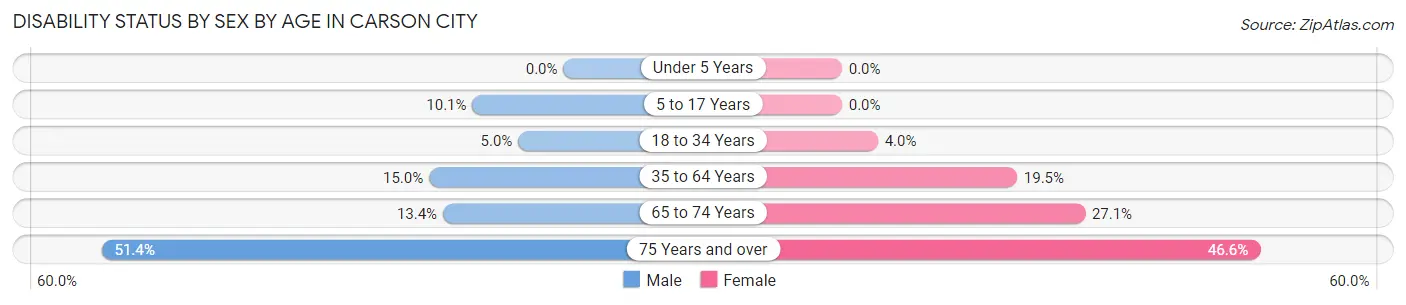
| Age Bracket | Male | Female |
| Under 5 Years | 0 (0.0%) | 0 (0.0%) |
| 5 to 17 Years | 8 (10.1%) | 0 (0.0%) |
| 18 to 34 Years | 8 (5.0%) | 3 (4.0%) |
| 35 to 64 Years | 19 (15.0%) | 31 (19.5%) |
| 65 to 74 Years | 11 (13.4%) | 13 (27.1%) |
| 75 Years and over | 18 (51.4%) | 34 (46.6%) |
Disability Class by Sex by Age in Carson City
Disability Class: Hearing Difficulty
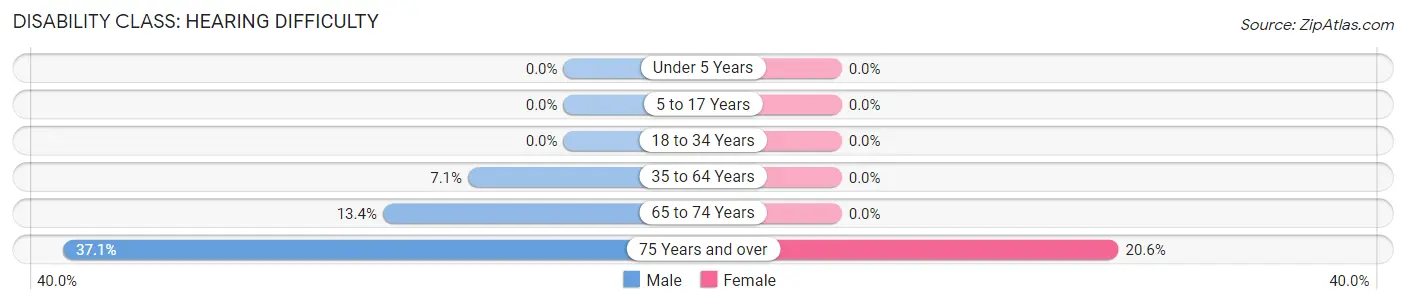
| Age Bracket | Male | Female |
| Under 5 Years | 0 (0.0%) | 0 (0.0%) |
| 5 to 17 Years | 0 (0.0%) | 0 (0.0%) |
| 18 to 34 Years | 0 (0.0%) | 0 (0.0%) |
| 35 to 64 Years | 9 (7.1%) | 0 (0.0%) |
| 65 to 74 Years | 11 (13.4%) | 0 (0.0%) |
| 75 Years and over | 13 (37.1%) | 15 (20.5%) |
Disability Class: Vision Difficulty
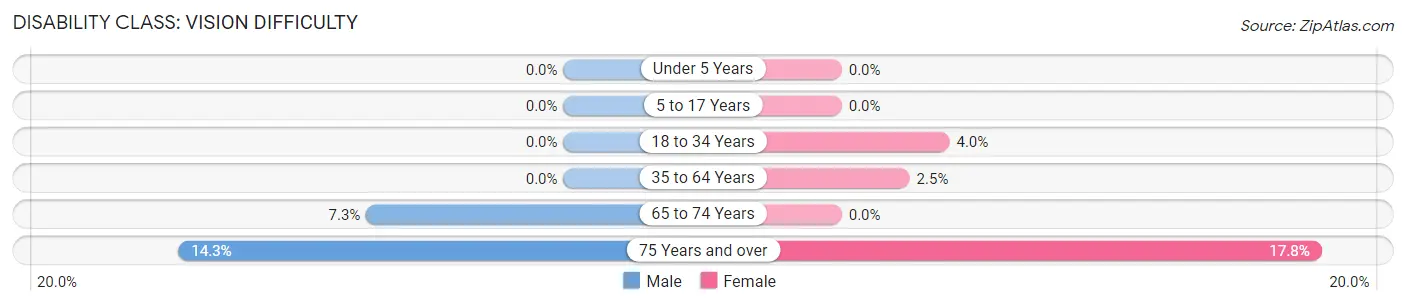
| Age Bracket | Male | Female |
| Under 5 Years | 0 (0.0%) | 0 (0.0%) |
| 5 to 17 Years | 0 (0.0%) | 0 (0.0%) |
| 18 to 34 Years | 0 (0.0%) | 3 (4.0%) |
| 35 to 64 Years | 0 (0.0%) | 4 (2.5%) |
| 65 to 74 Years | 6 (7.3%) | 0 (0.0%) |
| 75 Years and over | 5 (14.3%) | 13 (17.8%) |
Disability Class: Cognitive Difficulty
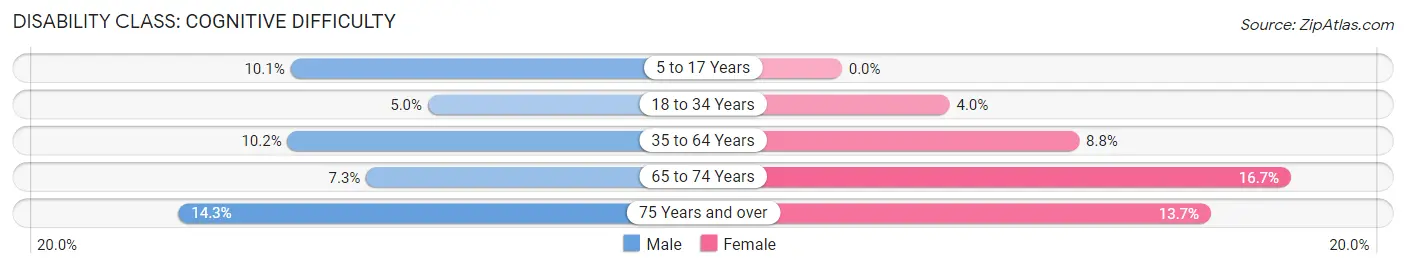
| Age Bracket | Male | Female |
| 5 to 17 Years | 8 (10.1%) | 0 (0.0%) |
| 18 to 34 Years | 8 (5.0%) | 3 (4.0%) |
| 35 to 64 Years | 13 (10.2%) | 14 (8.8%) |
| 65 to 74 Years | 6 (7.3%) | 8 (16.7%) |
| 75 Years and over | 5 (14.3%) | 10 (13.7%) |
Disability Class: Ambulatory Difficulty
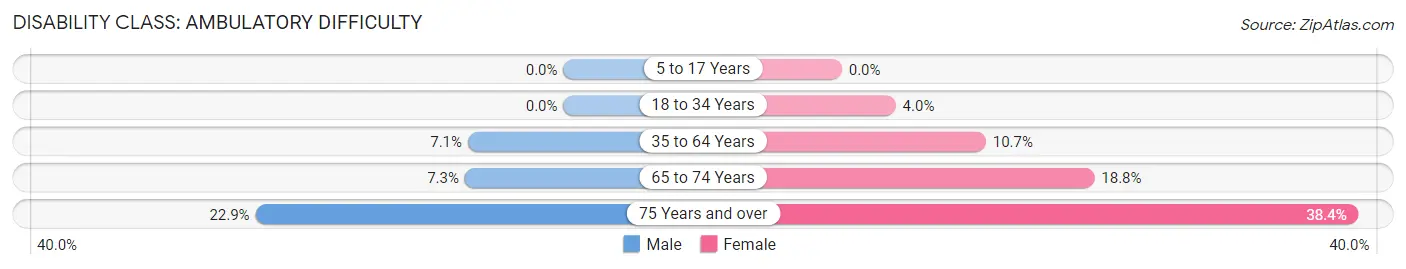
| Age Bracket | Male | Female |
| 5 to 17 Years | 0 (0.0%) | 0 (0.0%) |
| 18 to 34 Years | 0 (0.0%) | 3 (4.0%) |
| 35 to 64 Years | 9 (7.1%) | 17 (10.7%) |
| 65 to 74 Years | 6 (7.3%) | 9 (18.8%) |
| 75 Years and over | 8 (22.9%) | 28 (38.4%) |
Disability Class: Self-Care Difficulty
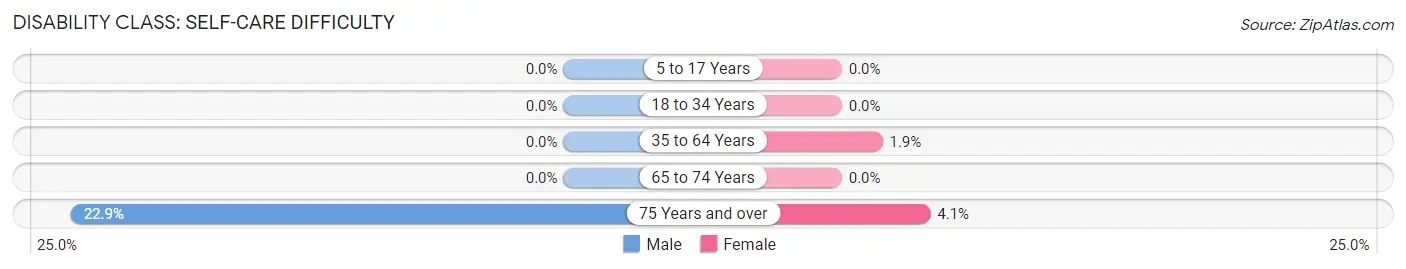
| Age Bracket | Male | Female |
| 5 to 17 Years | 0 (0.0%) | 0 (0.0%) |
| 18 to 34 Years | 0 (0.0%) | 0 (0.0%) |
| 35 to 64 Years | 0 (0.0%) | 3 (1.9%) |
| 65 to 74 Years | 0 (0.0%) | 0 (0.0%) |
| 75 Years and over | 8 (22.9%) | 3 (4.1%) |
Technology Access in Carson City
Computing Device Access in Carson City
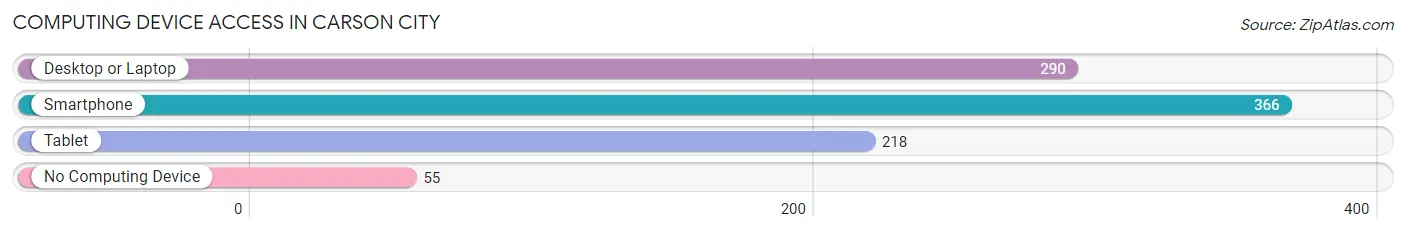
| Device Type | # Households | % Households |
| Desktop or Laptop | 290 | 64.4% |
| Smartphone | 366 | 81.3% |
| Tablet | 218 | 48.4% |
| No Computing Device | 55 | 12.2% |
| Total | 450 | 100.0% |
Internet Access in Carson City
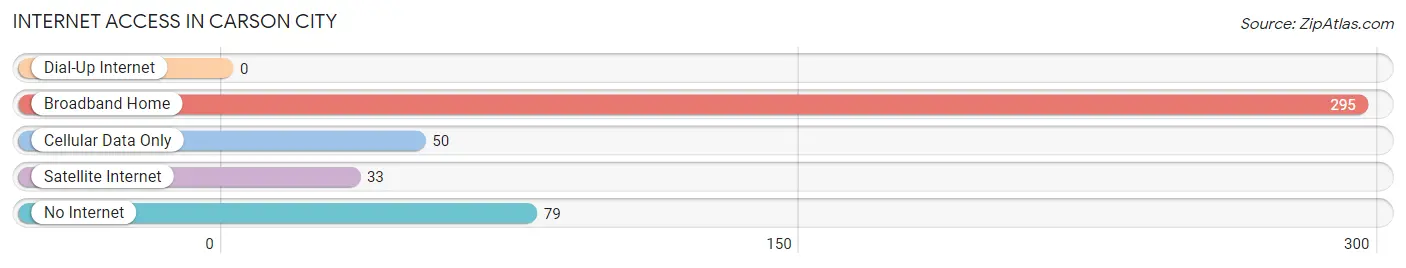
| Internet Type | # Households | % Households |
| Dial-Up Internet | 0 | 0.0% |
| Broadband Home | 295 | 65.6% |
| Cellular Data Only | 50 | 11.1% |
| Satellite Internet | 33 | 7.3% |
| No Internet | 79 | 17.6% |
| Total | 450 | 100.0% |
Carson City Summary
Carson City is a small city located in the state of Michigan in the United States. It is the county seat of Montcalm County and is located in the central part of the state, about 40 miles north of Lansing, the state capital. The city has a population of 1,845 as of the 2010 census, making it the smallest city in Michigan.
History
Carson City was founded in 1854 by William Carson, a settler from Ohio. He purchased the land from the government and named the city after himself. The city was incorporated in 1871 and was the first city in Montcalm County.
The city was an important stop on the Grand Rapids and Indiana Railroad, which was built in 1867. This allowed the city to become a major shipping center for the surrounding area. The railroad also helped to bring in new businesses and industries, such as a sawmill, a grist mill, and a brickyard.
The city was also home to a number of important historical figures, including former Michigan Governor Austin Blair, who was born in Carson City in 1818.
Geography
Carson City is located in the central part of Michigan, about 40 miles north of Lansing, the state capital. The city is situated on the banks of the Maple River, which flows through the city. The city is surrounded by rolling hills and farmland, and is located in the middle of the Michigan Lake Plain.
The city has a total area of 1.3 square miles, all of which is land. The city has a humid continental climate, with cold winters and hot, humid summers.
Economy
Carson City’s economy is largely based on agriculture and manufacturing. The city is home to a number of small businesses, including a sawmill, a grist mill, and a brickyard. The city is also home to a number of manufacturing companies, including a furniture factory, a plastics factory, and a metal fabrication plant.
The city is also home to a number of retail stores, including a grocery store, a hardware store, and a number of restaurants.
Demographics
As of the 2010 census, Carson City had a population of 1,845. The racial makeup of the city was 95.3% White, 0.7% African American, 0.3% Native American, 0.2% Asian, 0.1% Pacific Islander, 1.2% from other races, and 2.3% from two or more races. Hispanic or Latino of any race were 3.2% of the population.
The median income for a household in the city was $37,500, and the median income for a family was $45,000. The per capita income for the city was $19,000. About 11.3% of families and 14.2% of the population were below the poverty line, including 18.2% of those under age 18 and 8.3% of those age 65 or over.
Common Questions
What is Per Capita Income in Carson City?
Per Capita income in Carson City is $28,359.
What is the Median Family Income in Carson City?
Median Family Income in Carson City is $70,536.
What is the Median Household income in Carson City?
Median Household Income in Carson City is $42,222.
What is Income or Wage Gap in Carson City?
Income or Wage Gap in Carson City is 34.9%.
Women in Carson City earn 65.1 cents for every dollar earned by a man.
What is Family Income Deficit in Carson City?
Family Income Deficit in Carson City is $8,346.
Families that are below poverty line in Carson City earn $8,346 less on average than the poverty threshold level.
What is Inequality or Gini Index in Carson City?
Inequality or Gini Index in Carson City is 0.41.
What is the Total Population of Carson City?
Total Population of Carson City is 1,006.
What is the Total Male Population of Carson City?
Total Male Population of Carson City is 502.
What is the Total Female Population of Carson City?
Total Female Population of Carson City is 504.
What is the Ratio of Males per 100 Females in Carson City?
There are 99.60 Males per 100 Females in Carson City.
What is the Ratio of Females per 100 Males in Carson City?
There are 100.40 Females per 100 Males in Carson City.
What is the Median Population Age in Carson City?
Median Population Age in Carson City is 45.8 Years.
What is the Average Family Size in Carson City
Average Family Size in Carson City is 3.1 People.
What is the Average Household Size in Carson City
Average Household Size in Carson City is 2.1 People.
How Large is the Labor Force in Carson City?
There are 432 People in the Labor Forcein in Carson City.
What is the Percentage of People in the Labor Force in Carson City?
50.2% of People are in the Labor Force in Carson City.
What is the Unemployment Rate in Carson City?
Unemployment Rate in Carson City is 4.2%.