Marine City, MI Map & Demographics
Marine City Map
Marine City Overview
$35,498
PER CAPITA INCOME
$78,571
AVG FAMILY INCOME
$61,270
AVG HOUSEHOLD INCOME
68.9%
WAGE / INCOME GAP [ % ]
31.1¢/ $1
WAGE / INCOME GAP [ $ ]
0.39
INEQUALITY / GINI INDEX
4,068
TOTAL POPULATION
2,061
MALE POPULATION
2,007
FEMALE POPULATION
102.69
MALES / 100 FEMALES
97.38
FEMALES / 100 MALES
49.5
MEDIAN AGE
2.7
AVG FAMILY SIZE
2.1
AVG HOUSEHOLD SIZE
2,185
LABOR FORCE [ PEOPLE ]
62.0%
PERCENT IN LABOR FORCE
8.4%
UNEMPLOYMENT RATE
Marine City Zip Codes
Marine City Area Codes
Income in Marine City
Income Overview in Marine City
Per Capita Income in Marine City is $35,498, while median incomes of families and households are $78,571 and $61,270 respectively.
| Characteristic | Number | Measure |
| Per Capita Income | 4,068 | $35,498 |
| Median Family Income | 1,152 | $78,571 |
| Mean Family Income | 1,152 | $80,911 |
| Median Household Income | 1,948 | $61,270 |
| Mean Household Income | 1,948 | $73,301 |
| Income Deficit | 1,152 | $0 |
| Wage / Income Gap (%) | 4,068 | 68.89% |
| Wage / Income Gap ($) | 4,068 | 31.11¢ per $1 |
| Gini / Inequality Index | 4,068 | 0.39 |
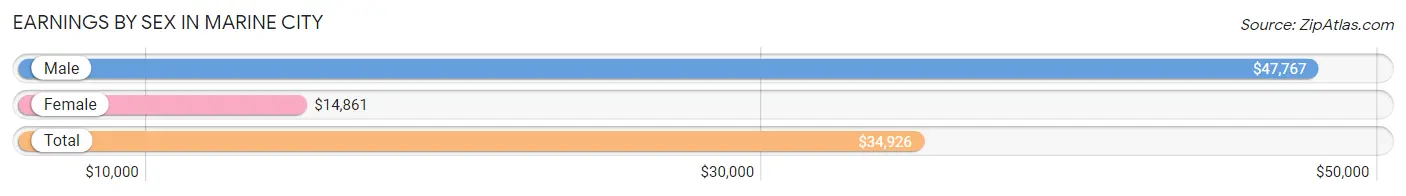
Earnings by Sex in Marine City
Average Earnings in Marine City are $34,926, $47,767 for men and $14,861 for women, a difference of 68.9%.
| Sex | Number | Average Earnings |
| Male | 1,218 (53.3%) | $47,767 |
| Female | 1,069 (46.7%) | $14,861 |
| Total | 2,287 (100.0%) | $34,926 |
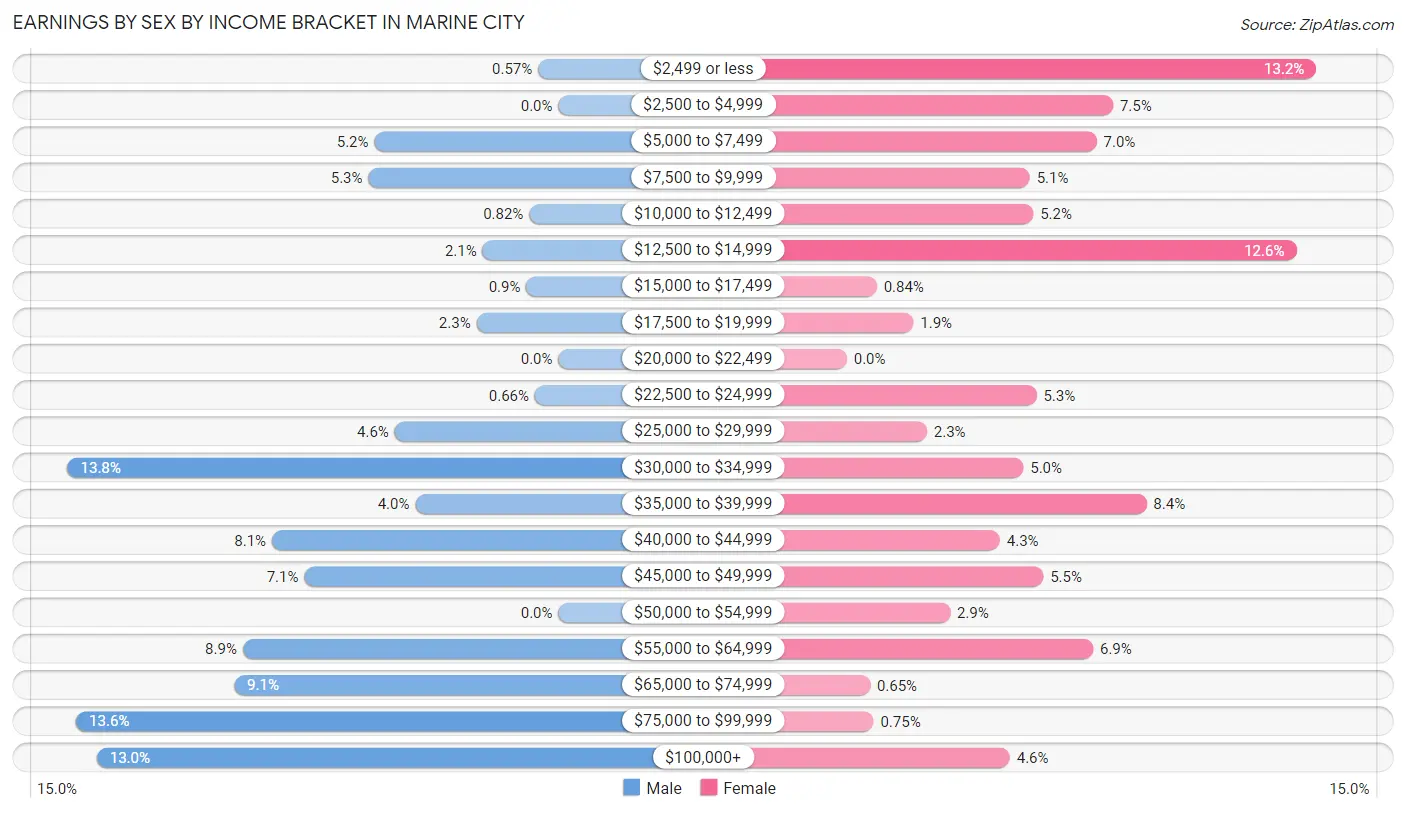
Earnings by Sex by Income Bracket in Marine City
The most common earnings brackets in Marine City are $30,000 to $34,999 for men (168 | 13.8%) and $2,499 or less for women (141 | 13.2%).
| Income | Male | Female |
| $2,499 or less | 7 (0.6%) | 141 (13.2%) |
| $2,500 to $4,999 | 0 (0.0%) | 80 (7.5%) |
| $5,000 to $7,499 | 63 (5.2%) | 75 (7.0%) |
| $7,500 to $9,999 | 65 (5.3%) | 55 (5.1%) |
| $10,000 to $12,499 | 10 (0.8%) | 56 (5.2%) |
| $12,500 to $14,999 | 26 (2.1%) | 135 (12.6%) |
| $15,000 to $17,499 | 11 (0.9%) | 9 (0.8%) |
| $17,500 to $19,999 | 28 (2.3%) | 20 (1.9%) |
| $20,000 to $22,499 | 0 (0.0%) | 0 (0.0%) |
| $22,500 to $24,999 | 8 (0.7%) | 57 (5.3%) |
| $25,000 to $29,999 | 56 (4.6%) | 24 (2.2%) |
| $30,000 to $34,999 | 168 (13.8%) | 53 (5.0%) |
| $35,000 to $39,999 | 49 (4.0%) | 90 (8.4%) |
| $40,000 to $44,999 | 98 (8.1%) | 46 (4.3%) |
| $45,000 to $49,999 | 87 (7.1%) | 59 (5.5%) |
| $50,000 to $54,999 | 0 (0.0%) | 31 (2.9%) |
| $55,000 to $64,999 | 108 (8.9%) | 74 (6.9%) |
| $65,000 to $74,999 | 111 (9.1%) | 7 (0.6%) |
| $75,000 to $99,999 | 165 (13.6%) | 8 (0.7%) |
| $100,000+ | 158 (13.0%) | 49 (4.6%) |
| Total | 1,218 (100.0%) | 1,069 (100.0%) |
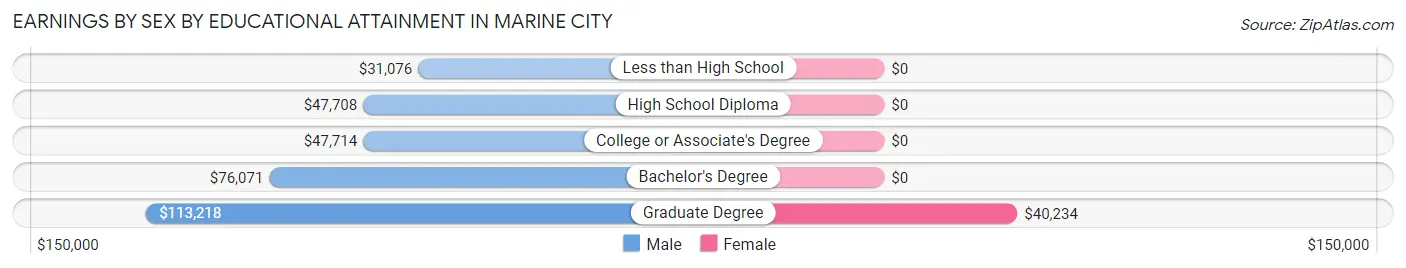
Earnings by Sex by Educational Attainment in Marine City
Average earnings in Marine City are $55,058 for men and $14,787 for women, a difference of 73.1%. Men with an educational attainment of graduate degree enjoy the highest average annual earnings of $113,218, while those with less than high school education earn the least with $31,076. Women with an educational attainment of graduate degree earn the most with the average annual earnings of $40,234, while those with graduate degree education have the smallest earnings of $40,234.
| Educational Attainment | Male Income | Female Income |
| Less than High School | $31,076 | $0 |
| High School Diploma | $47,708 | $0 |
| College or Associate's Degree | $47,714 | $0 |
| Bachelor's Degree | $76,071 | $0 |
| Graduate Degree | $113,218 | $40,234 |
| Total | $55,058 | $14,787 |
Family Income in Marine City
Family Income Brackets in Marine City
According to the Marine City family income data, there are 304 families falling into the $75,000 to $99,999 income range, which is the most common income bracket and makes up 26.4% of all families. Conversely, the $10,000 to $14,999 income bracket is the least frequent group with only 10 families (0.9%) belonging to this category.
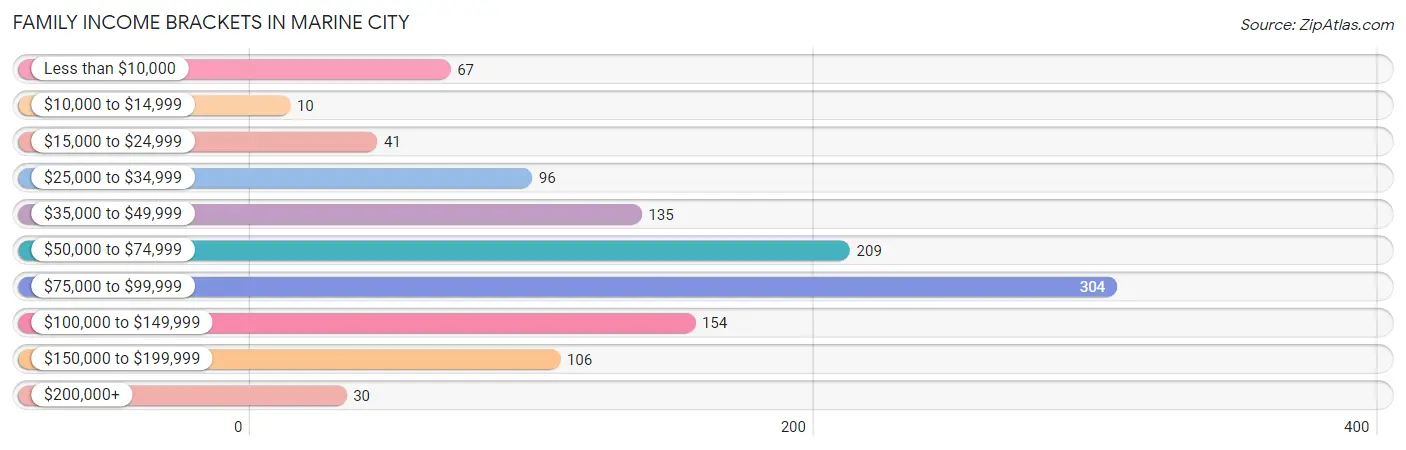
| Income Bracket | # Families | % Families |
| Less than $10,000 | 67 | 5.8% |
| $10,000 to $14,999 | 10 | 0.9% |
| $15,000 to $24,999 | 41 | 3.6% |
| $25,000 to $34,999 | 96 | 8.3% |
| $35,000 to $49,999 | 135 | 11.7% |
| $50,000 to $74,999 | 209 | 18.1% |
| $75,000 to $99,999 | 304 | 26.4% |
| $100,000 to $149,999 | 154 | 13.4% |
| $150,000 to $199,999 | 106 | 9.2% |
| $200,000+ | 30 | 2.6% |
Family Income by Famaliy Size in Marine City
4-person families (161 | 14.0%) account for the highest median family income in Marine City with $101,094 per family, while 2-person families (639 | 55.5%) have the highest median income of $30,734 per family member.
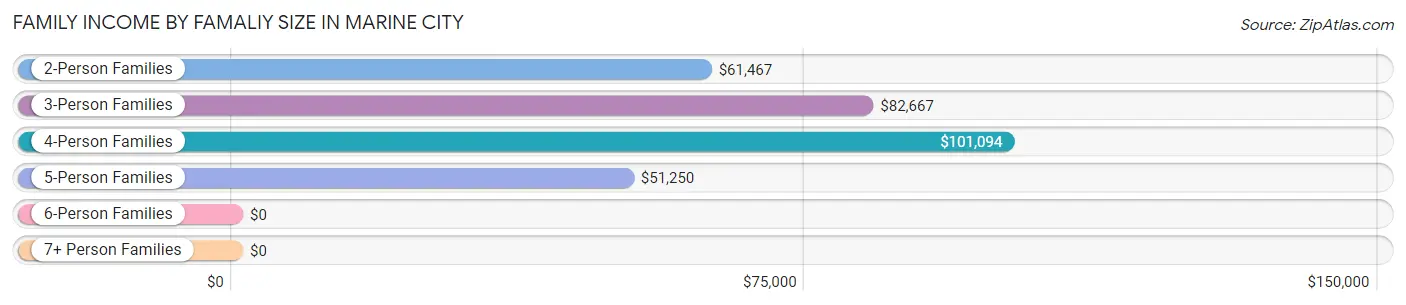
| Income Bracket | # Families | Median Income |
| 2-Person Families | 639 (55.5%) | $61,467 |
| 3-Person Families | 276 (24.0%) | $82,667 |
| 4-Person Families | 161 (14.0%) | $101,094 |
| 5-Person Families | 68 (5.9%) | $51,250 |
| 6-Person Families | 0 (0.0%) | $0 |
| 7+ Person Families | 8 (0.7%) | $0 |
| Total | 1,152 (100.0%) | $78,571 |
Family Income by Number of Earners in Marine City
The median family income in Marine City is $78,571, with families comprising 3+ earners (178) having the highest median family income of $113,750, while families with no earners (172) have the lowest median family income of $51,346, accounting for 15.4% and 14.9% of families, respectively.
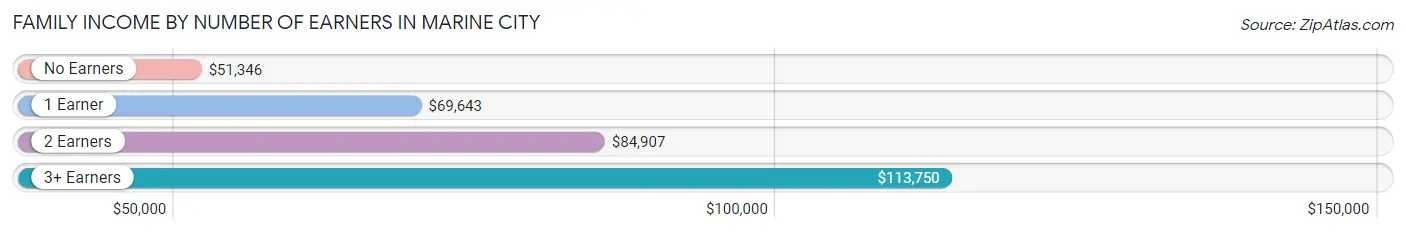
| Number of Earners | # Families | Median Income |
| No Earners | 172 (14.9%) | $51,346 |
| 1 Earner | 434 (37.7%) | $69,643 |
| 2 Earners | 368 (31.9%) | $84,907 |
| 3+ Earners | 178 (15.4%) | $113,750 |
| Total | 1,152 (100.0%) | $78,571 |
Household Income in Marine City
Household Income Brackets in Marine City
With 413 households falling in the category, the $75,000 to $99,999 income range is the most frequent in Marine City, accounting for 21.2% of all households. In contrast, only 29 households (1.5%) fall into the $200,000+ income bracket, making it the least populous group.
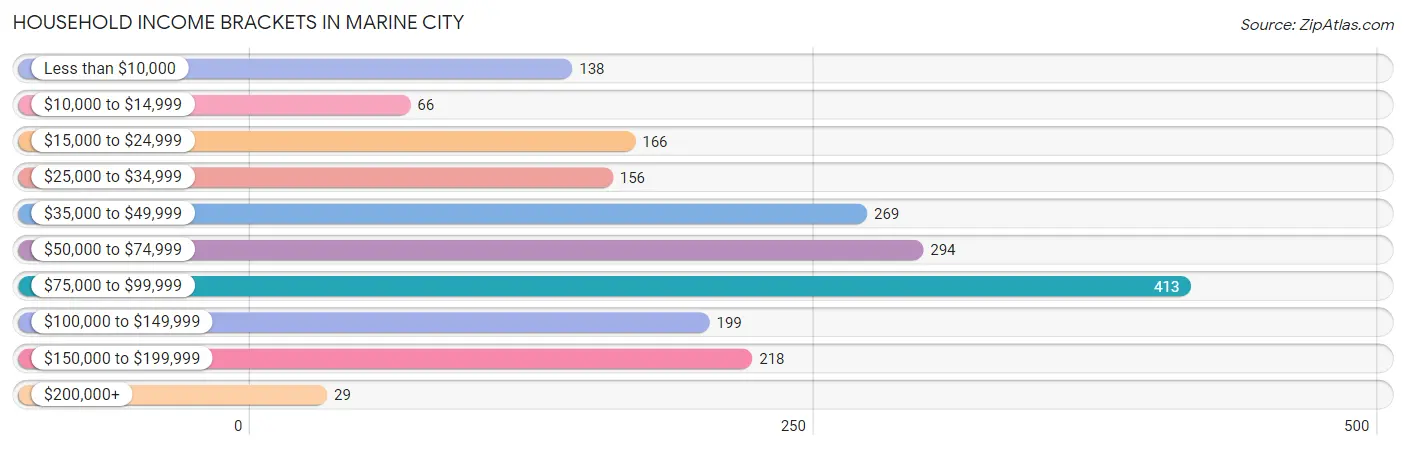
| Income Bracket | # Households | % Households |
| Less than $10,000 | 138 | 7.1% |
| $10,000 to $14,999 | 66 | 3.4% |
| $15,000 to $24,999 | 166 | 8.5% |
| $25,000 to $34,999 | 156 | 8.0% |
| $35,000 to $49,999 | 269 | 13.8% |
| $50,000 to $74,999 | 294 | 15.1% |
| $75,000 to $99,999 | 413 | 21.2% |
| $100,000 to $149,999 | 199 | 10.2% |
| $150,000 to $199,999 | 218 | 11.2% |
| $200,000+ | 29 | 1.5% |
Household Income by Householder Age in Marine City
The median household income in Marine City is $61,270, with the highest median household income of $78,824 found in the 25 to 44 years age bracket for the primary householder. A total of 422 households (21.7%) fall into this category. Meanwhile, the 15 to 24 years age bracket for the primary householder has the lowest median household income of $0, with 51 households (2.6%) in this group.
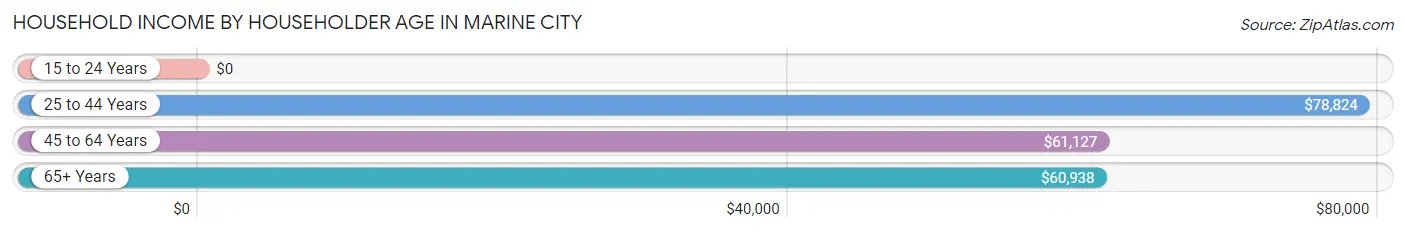
| Income Bracket | # Households | Median Income |
| 15 to 24 Years | 51 (2.6%) | $0 |
| 25 to 44 Years | 422 (21.7%) | $78,824 |
| 45 to 64 Years | 734 (37.7%) | $61,127 |
| 65+ Years | 741 (38.0%) | $60,938 |
| Total | 1,948 (100.0%) | $61,270 |
Poverty in Marine City
Income Below Poverty by Sex and Age in Marine City
With 9.8% poverty level for males and 15.4% for females among the residents of Marine City, under 5 year old males and 5 year old females are the most vulnerable to poverty, with 22 males (35.5%) and 9 females (100.0%) in their respective age groups living below the poverty level.
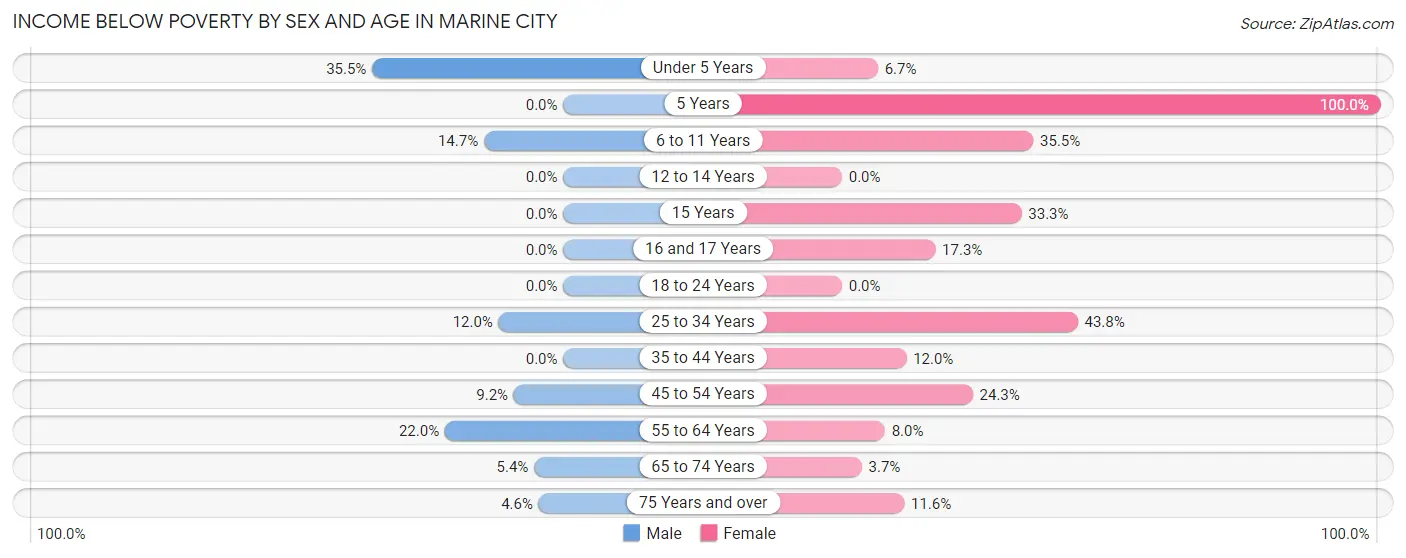
| Age Bracket | Male | Female |
| Under 5 Years | 22 (35.5%) | 8 (6.7%) |
| 5 Years | 0 (0.0%) | 9 (100.0%) |
| 6 to 11 Years | 19 (14.7%) | 38 (35.5%) |
| 12 to 14 Years | 0 (0.0%) | 0 (0.0%) |
| 15 Years | 0 (0.0%) | 8 (33.3%) |
| 16 and 17 Years | 0 (0.0%) | 13 (17.3%) |
| 18 to 24 Years | 0 (0.0%) | 0 (0.0%) |
| 25 to 34 Years | 21 (12.0%) | 77 (43.8%) |
| 35 to 44 Years | 0 (0.0%) | 30 (11.9%) |
| 45 to 54 Years | 33 (9.2%) | 76 (24.3%) |
| 55 to 64 Years | 78 (22.0%) | 20 (8.0%) |
| 65 to 74 Years | 22 (5.4%) | 13 (3.7%) |
| 75 Years and over | 7 (4.5%) | 17 (11.6%) |
| Total | 202 (9.8%) | 309 (15.4%) |
Income Above Poverty by Sex and Age in Marine City
According to the poverty statistics in Marine City, males aged 12 to 14 years and females aged 12 to 14 years are the age groups that are most secure financially, with 100.0% of males and 100.0% of females in these age groups living above the poverty line.
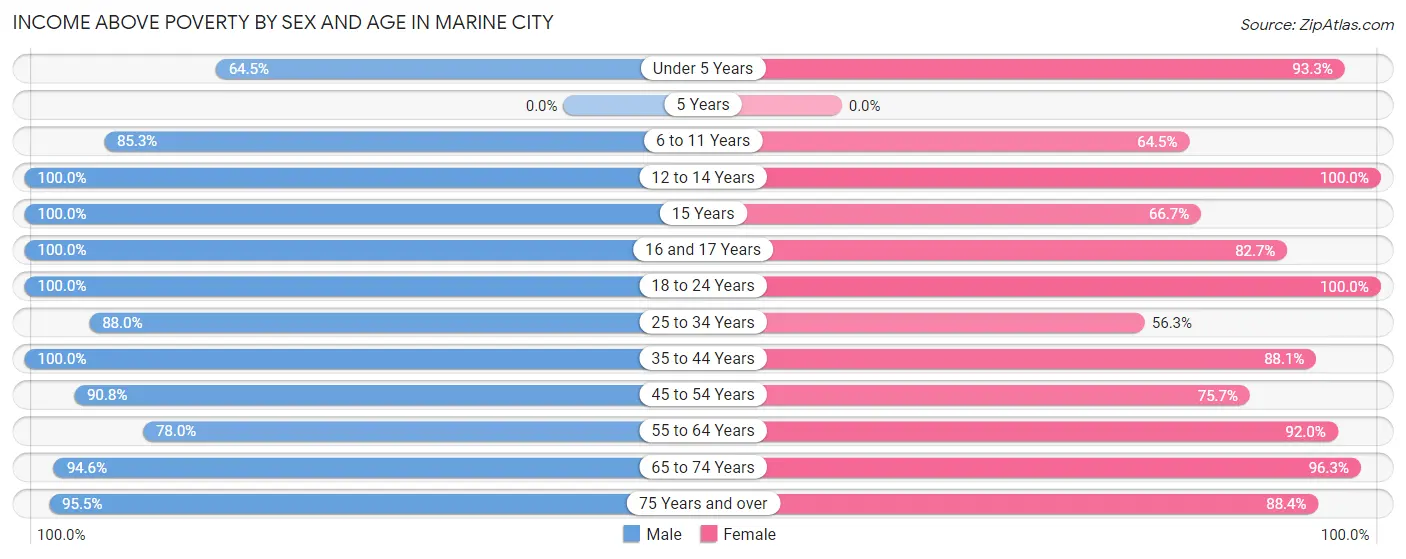
| Age Bracket | Male | Female |
| Under 5 Years | 40 (64.5%) | 112 (93.3%) |
| 5 Years | 0 (0.0%) | 0 (0.0%) |
| 6 to 11 Years | 110 (85.3%) | 69 (64.5%) |
| 12 to 14 Years | 29 (100.0%) | 56 (100.0%) |
| 15 Years | 8 (100.0%) | 16 (66.7%) |
| 16 and 17 Years | 12 (100.0%) | 62 (82.7%) |
| 18 to 24 Years | 152 (100.0%) | 125 (100.0%) |
| 25 to 34 Years | 154 (88.0%) | 99 (56.2%) |
| 35 to 44 Years | 218 (100.0%) | 221 (88.0%) |
| 45 to 54 Years | 327 (90.8%) | 237 (75.7%) |
| 55 to 64 Years | 277 (78.0%) | 231 (92.0%) |
| 65 to 74 Years | 385 (94.6%) | 340 (96.3%) |
| 75 Years and over | 147 (95.5%) | 130 (88.4%) |
| Total | 1,859 (90.2%) | 1,698 (84.6%) |
Income Below Poverty Among Married-Couple Families in Marine City
The poverty statistics for married-couple families in Marine City show that 7.0% or 61 of the total 873 families live below the poverty line. Families with 1 or 2 children have the highest poverty rate of 7.1%, comprising of 18 families. On the other hand, families with 5 or more children have the lowest poverty rate of 0.0%, which includes 0 families.
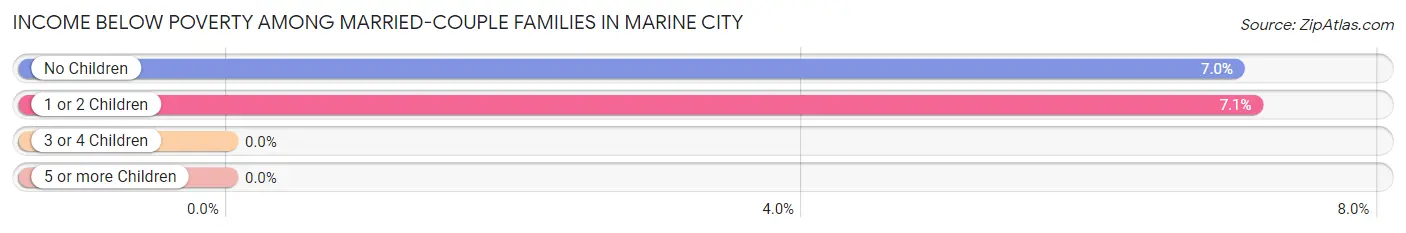
| Children | Above Poverty | Below Poverty |
| No Children | 570 (93.0%) | 43 (7.0%) |
| 1 or 2 Children | 234 (92.9%) | 18 (7.1%) |
| 3 or 4 Children | 0 (0.0%) | 0 (0.0%) |
| 5 or more Children | 8 (100.0%) | 0 (0.0%) |
| Total | 812 (93.0%) | 61 (7.0%) |
Income Below Poverty Among Single-Parent Households in Marine City
According to the poverty data in Marine City, 8.8% or 8 single-father households and 33.5% or 63 single-mother households are living below the poverty line. Among single-father households, those with no children have the highest poverty rate, with 8 households (9.6%) experiencing poverty. Likewise, among single-mother households, those with 3 or 4 children have the highest poverty rate, with 8 households (100.0%) falling below the poverty line.
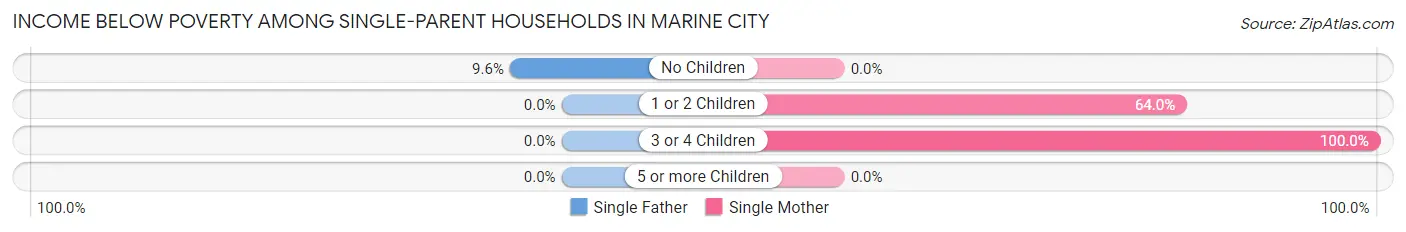
| Children | Single Father | Single Mother |
| No Children | 8 (9.6%) | 0 (0.0%) |
| 1 or 2 Children | 0 (0.0%) | 55 (63.9%) |
| 3 or 4 Children | 0 (0.0%) | 8 (100.0%) |
| 5 or more Children | 0 (0.0%) | 0 (0.0%) |
| Total | 8 (8.8%) | 63 (33.5%) |
Income Below Poverty Among Married-Couple vs Single-Parent Households in Marine City
The poverty data for Marine City shows that 61 of the married-couple family households (7.0%) and 71 of the single-parent households (25.5%) are living below the poverty level. Within the married-couple family households, those with 1 or 2 children have the highest poverty rate, with 18 households (7.1%) falling below the poverty line. Among the single-parent households, those with 3 or 4 children have the highest poverty rate, with 8 household (100.0%) living below poverty.
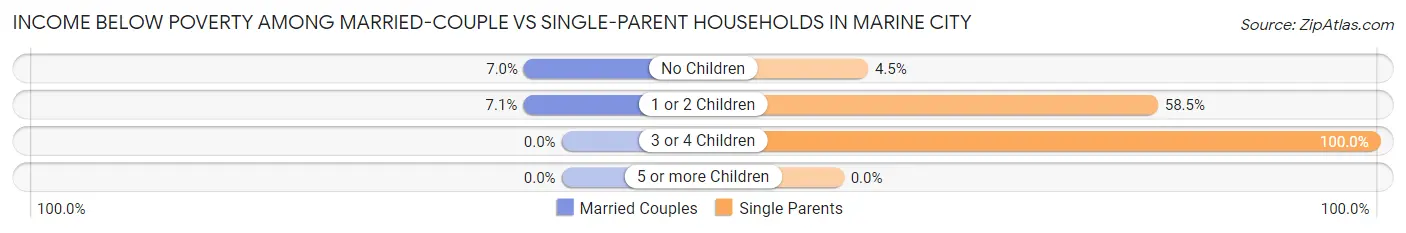
| Children | Married-Couple Families | Single-Parent Households |
| No Children | 43 (7.0%) | 8 (4.5%) |
| 1 or 2 Children | 18 (7.1%) | 55 (58.5%) |
| 3 or 4 Children | 0 (0.0%) | 8 (100.0%) |
| 5 or more Children | 0 (0.0%) | 0 (0.0%) |
| Total | 61 (7.0%) | 71 (25.5%) |
Race in Marine City
The most populous races in Marine City are White / Caucasian (3,979 | 97.8%), Two or more Races (81 | 2.0%), and Hispanic or Latino (79 | 1.9%).
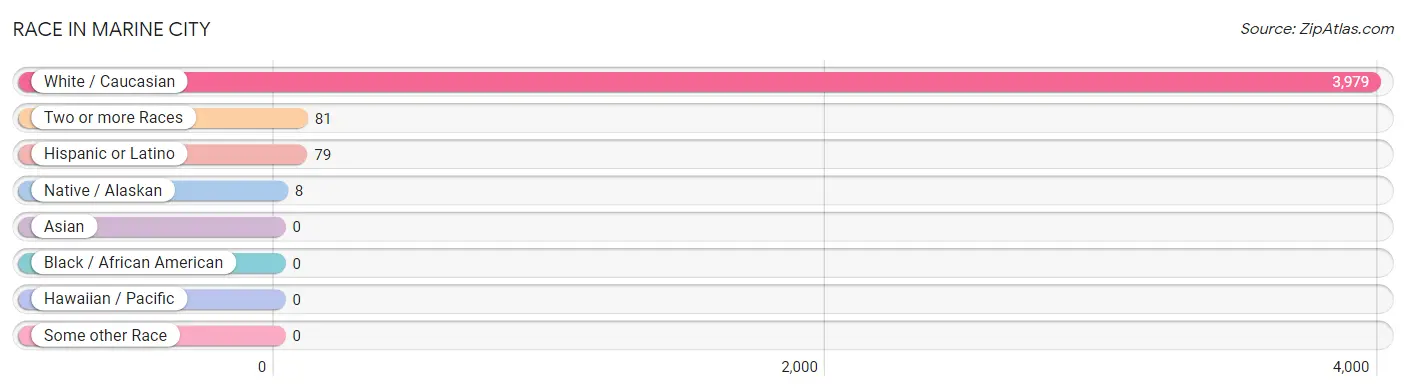
| Race | # Population | % Population |
| Asian | 0 | 0.0% |
| Black / African American | 0 | 0.0% |
| Hawaiian / Pacific | 0 | 0.0% |
| Hispanic or Latino | 79 | 1.9% |
| Native / Alaskan | 8 | 0.2% |
| White / Caucasian | 3,979 | 97.8% |
| Two or more Races | 81 | 2.0% |
| Some other Race | 0 | 0.0% |
| Total | 4,068 | 100.0% |
Ancestry in Marine City
The most populous ancestries reported in Marine City are German (1,277 | 31.4%), Irish (751 | 18.5%), Polish (588 | 14.4%), English (430 | 10.6%), and French (258 | 6.3%), together accounting for 81.2% of all Marine City residents.
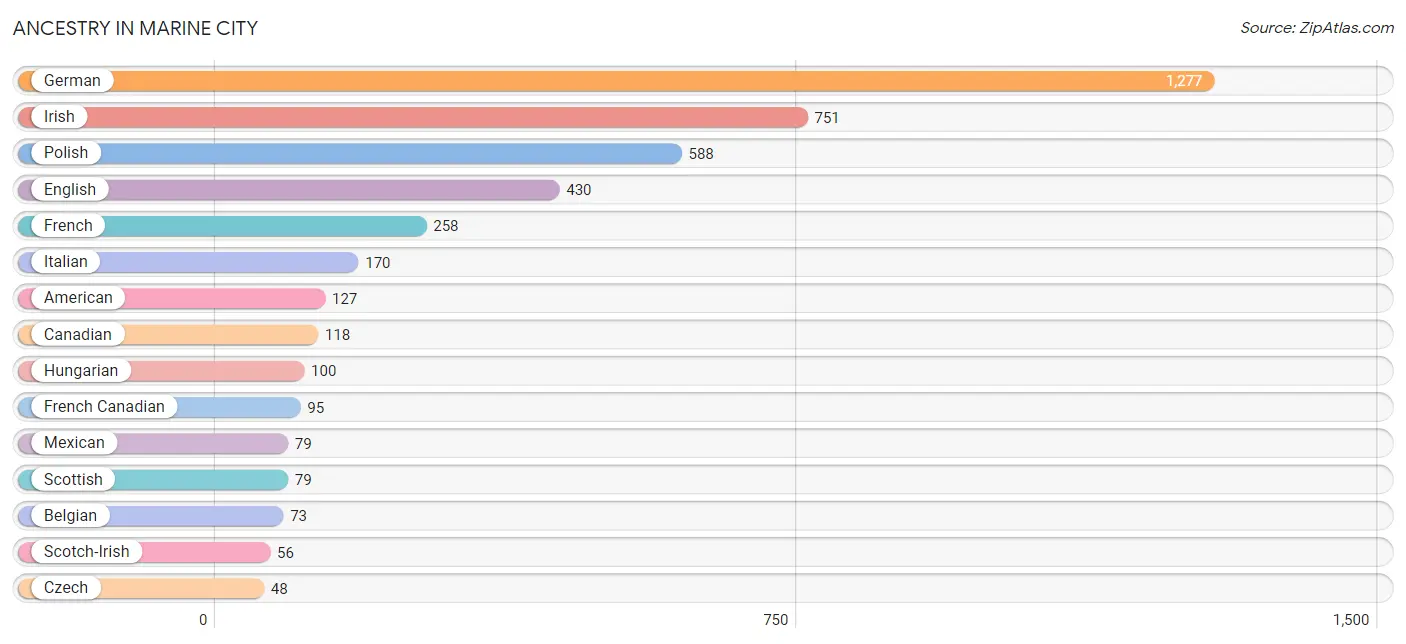
| Ancestry | # Population | % Population |
| American | 127 | 3.1% |
| Belgian | 73 | 1.8% |
| Canadian | 118 | 2.9% |
| Cherokee | 5 | 0.1% |
| Choctaw | 8 | 0.2% |
| Croatian | 7 | 0.2% |
| Czech | 48 | 1.2% |
| Danish | 8 | 0.2% |
| Dutch | 33 | 0.8% |
| Eastern European | 19 | 0.5% |
| English | 430 | 10.6% |
| European | 22 | 0.5% |
| French | 258 | 6.3% |
| French Canadian | 95 | 2.3% |
| German | 1,277 | 31.4% |
| Hungarian | 100 | 2.5% |
| Irish | 751 | 18.5% |
| Italian | 170 | 4.2% |
| Lithuanian | 5 | 0.1% |
| Mexican | 79 | 1.9% |
| Northern European | 24 | 0.6% |
| Polish | 588 | 14.4% |
| Scotch-Irish | 56 | 1.4% |
| Scottish | 79 | 1.9% |
| Serbian | 16 | 0.4% |
| Swedish | 48 | 1.2% | View All 26 Rows |
Immigrants in Marine City
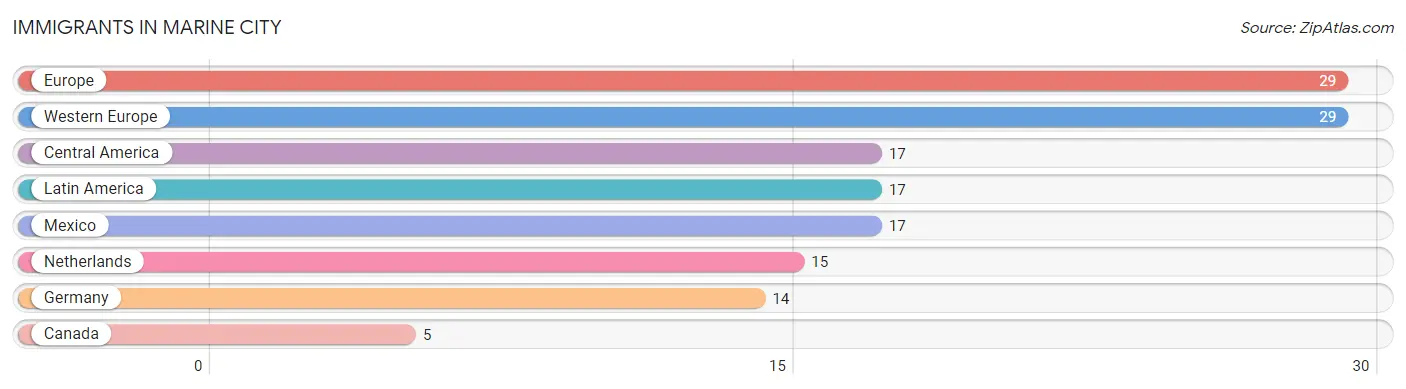
The most numerous immigrant groups reported in Marine City came from Europe (29 | 0.7%), Western Europe (29 | 0.7%), Central America (17 | 0.4%), Latin America (17 | 0.4%), and Mexico (17 | 0.4%), together accounting for 2.7% of all Marine City residents.
| Immigration Origin | # Population | % Population |
| Canada | 5 | 0.1% |
| Central America | 17 | 0.4% |
| Europe | 29 | 0.7% |
| Germany | 14 | 0.3% |
| Latin America | 17 | 0.4% |
| Mexico | 17 | 0.4% |
| Netherlands | 15 | 0.4% |
| Western Europe | 29 | 0.7% | View All 8 Rows |
Sex and Age in Marine City
Sex and Age in Marine City
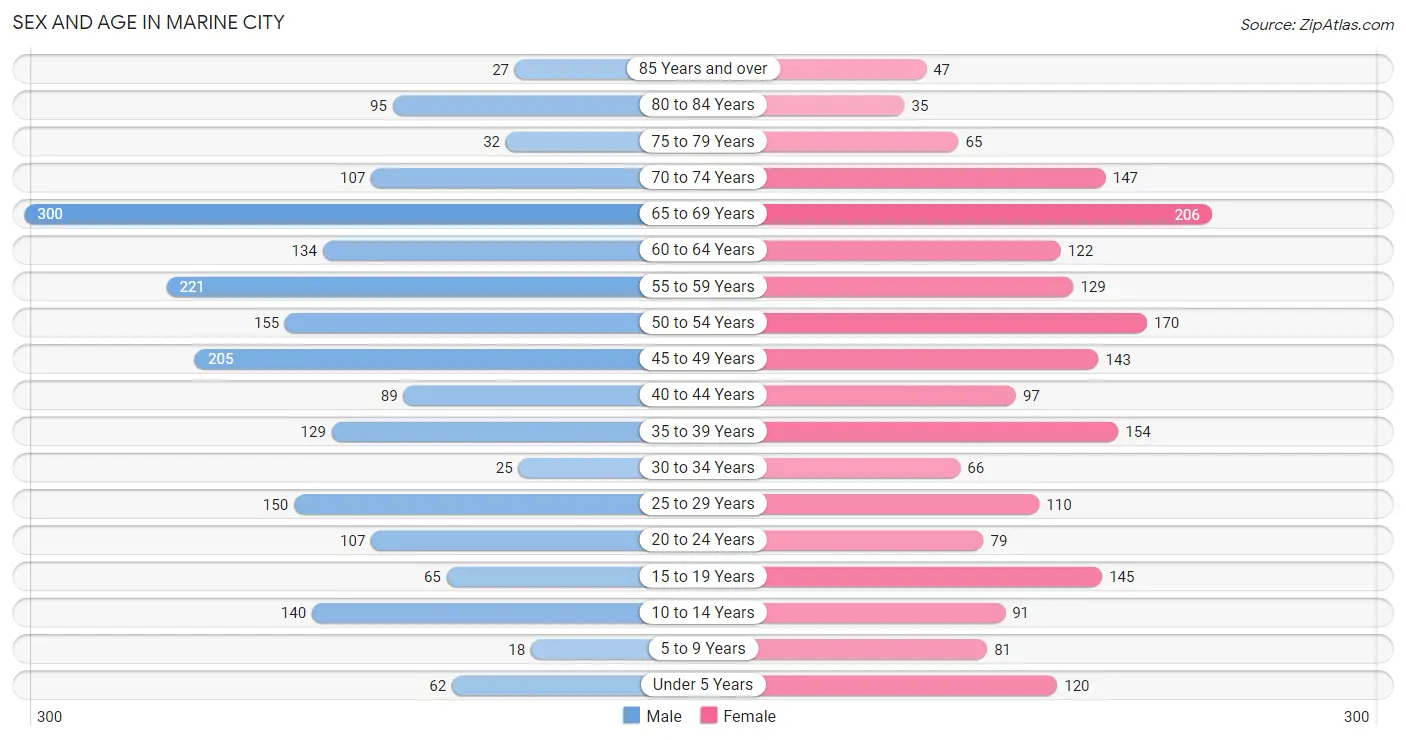
The most populous age groups in Marine City are 65 to 69 Years (300 | 14.6%) for men and 65 to 69 Years (206 | 10.3%) for women.
| Age Bracket | Male | Female |
| Under 5 Years | 62 (3.0%) | 120 (6.0%) |
| 5 to 9 Years | 18 (0.9%) | 81 (4.0%) |
| 10 to 14 Years | 140 (6.8%) | 91 (4.5%) |
| 15 to 19 Years | 65 (3.2%) | 145 (7.2%) |
| 20 to 24 Years | 107 (5.2%) | 79 (3.9%) |
| 25 to 29 Years | 150 (7.3%) | 110 (5.5%) |
| 30 to 34 Years | 25 (1.2%) | 66 (3.3%) |
| 35 to 39 Years | 129 (6.3%) | 154 (7.7%) |
| 40 to 44 Years | 89 (4.3%) | 97 (4.8%) |
| 45 to 49 Years | 205 (10.0%) | 143 (7.1%) |
| 50 to 54 Years | 155 (7.5%) | 170 (8.5%) |
| 55 to 59 Years | 221 (10.7%) | 129 (6.4%) |
| 60 to 64 Years | 134 (6.5%) | 122 (6.1%) |
| 65 to 69 Years | 300 (14.6%) | 206 (10.3%) |
| 70 to 74 Years | 107 (5.2%) | 147 (7.3%) |
| 75 to 79 Years | 32 (1.5%) | 65 (3.2%) |
| 80 to 84 Years | 95 (4.6%) | 35 (1.7%) |
| 85 Years and over | 27 (1.3%) | 47 (2.3%) |
| Total | 2,061 (100.0%) | 2,007 (100.0%) |
Families and Households in Marine City
Median Family Size in Marine City
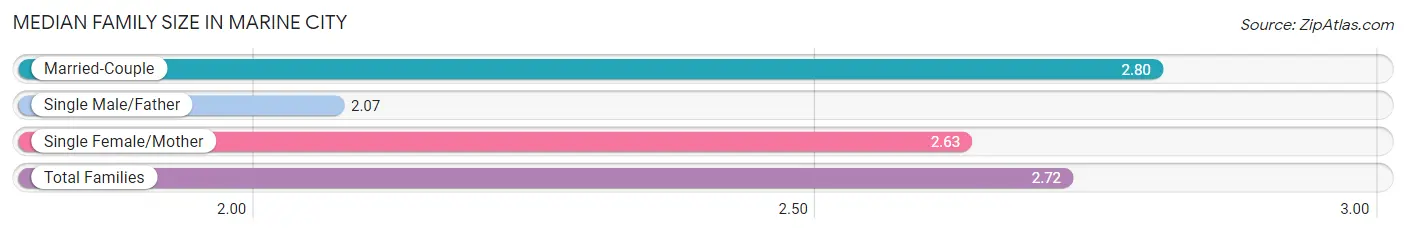
The median family size in Marine City is 2.72 persons per family, with married-couple families (873 | 75.8%) accounting for the largest median family size of 2.8 persons per family. On the other hand, single male/father families (91 | 7.9%) represent the smallest median family size with 2.07 persons per family.
| Family Type | # Families | Family Size |
| Married-Couple | 873 (75.8%) | 2.80 |
| Single Male/Father | 91 (7.9%) | 2.07 |
| Single Female/Mother | 188 (16.3%) | 2.63 |
| Total Families | 1,152 (100.0%) | 2.72 |
Median Household Size in Marine City
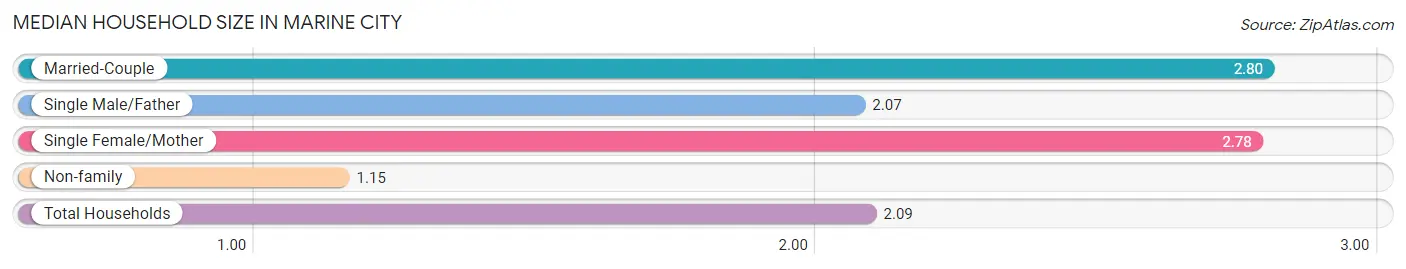
The median household size in Marine City is 2.09 persons per household, with married-couple households (873 | 44.8%) accounting for the largest median household size of 2.8 persons per household. non-family households (796 | 40.9%) represent the smallest median household size with 1.15 persons per household.
| Household Type | # Households | Household Size |
| Married-Couple | 873 (44.8%) | 2.80 |
| Single Male/Father | 91 (4.7%) | 2.07 |
| Single Female/Mother | 188 (9.7%) | 2.78 |
| Non-family | 796 (40.9%) | 1.15 |
| Total Households | 1,948 (100.0%) | 2.09 |
Household Size by Marriage Status in Marine City
Out of a total of 1,948 households in Marine City, 1,152 (59.1%) are family households, while 796 (40.9%) are nonfamily households. The most numerous type of family households are 2-person households, comprising 639, and the most common type of nonfamily households are 1-person households, comprising 705.
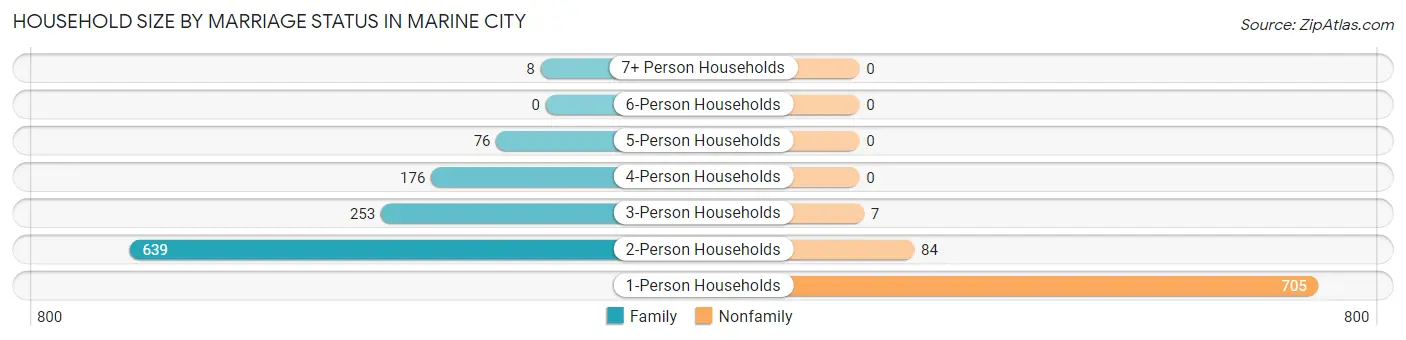
| Household Size | Family Households | Nonfamily Households |
| 1-Person Households | - | 705 (36.2%) |
| 2-Person Households | 639 (32.8%) | 84 (4.3%) |
| 3-Person Households | 253 (13.0%) | 7 (0.4%) |
| 4-Person Households | 176 (9.0%) | 0 (0.0%) |
| 5-Person Households | 76 (3.9%) | 0 (0.0%) |
| 6-Person Households | 0 (0.0%) | 0 (0.0%) |
| 7+ Person Households | 8 (0.4%) | 0 (0.0%) |
| Total | 1,152 (59.1%) | 796 (40.9%) |
Female Fertility in Marine City
Fertility by Age in Marine City
Average fertility rate in Marine City is 49.0 births per 1,000 women. Women in the age bracket of 35 to 50 years have the highest fertility rate with 62.0 births per 1,000 women. Women in the age bracket of 35 to 50 years acount for 65.0% of all women with births.
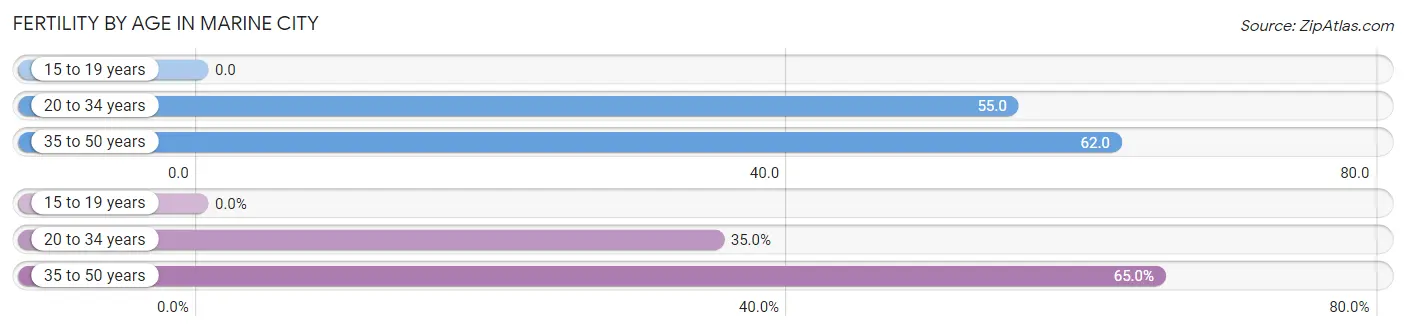
| Age Bracket | Women with Births | Births / 1,000 Women |
| 15 to 19 years | 0 (0.0%) | 0.0 |
| 20 to 34 years | 14 (35.0%) | 55.0 |
| 35 to 50 years | 26 (65.0%) | 62.0 |
| Total | 40 (100.0%) | 49.0 |
Fertility by Age by Marriage Status in Marine City
65.0% of women with births (40) in Marine City are married. The highest percentage of unmarried women with births falls into 20 to 34 years age bracket with 100.0% of them unmarried at the time of birth, while the lowest percentage of unmarried women with births belong to 35 to 50 years age bracket with 0.0% of them unmarried.
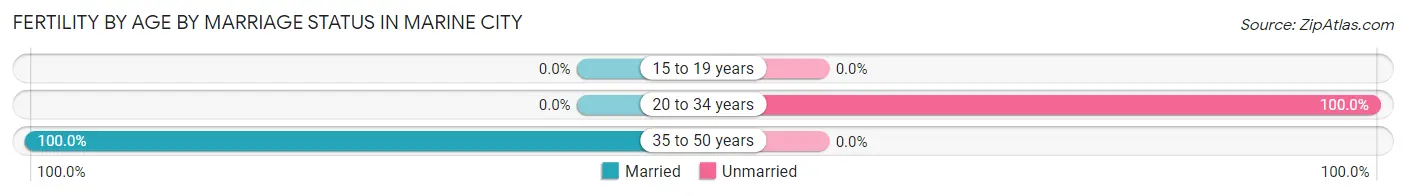
| Age Bracket | Married | Unmarried |
| 15 to 19 years | 0 (0.0%) | 0 (0.0%) |
| 20 to 34 years | 0 (0.0%) | 14 (100.0%) |
| 35 to 50 years | 26 (100.0%) | 0 (0.0%) |
| Total | 26 (65.0%) | 14 (35.0%) |
Fertility by Education in Marine City
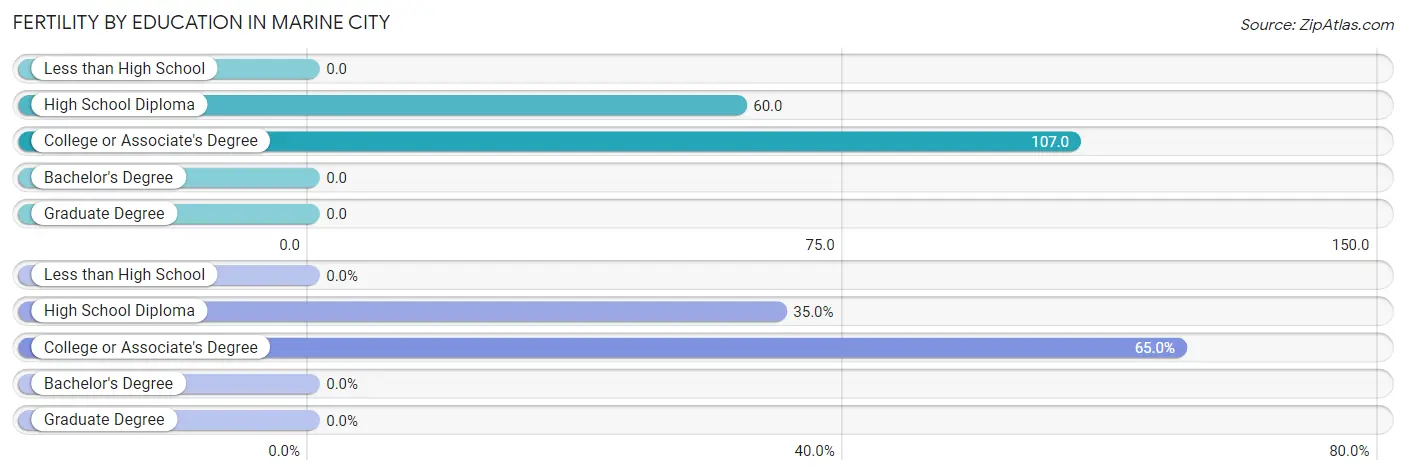
| Educational Attainment | Women with Births | Births / 1,000 Women |
| Less than High School | 0 (0.0%) | 0.0 |
| High School Diploma | 14 (35.0%) | 60.0 |
| College or Associate's Degree | 26 (65.0%) | 107.0 |
| Bachelor's Degree | 0 (0.0%) | 0.0 |
| Graduate Degree | 0 (0.0%) | 0.0 |
| Total | 40 (100.0%) | 49.0 |
Fertility by Education by Marriage Status in Marine City
35.0% of women with births in Marine City are unmarried. Women with the educational attainment of college or associate's degree are most likely to be married with 100.0% of them married at childbirth, while women with the educational attainment of high school diploma are least likely to be married with 100.0% of them unmarried at childbirth.
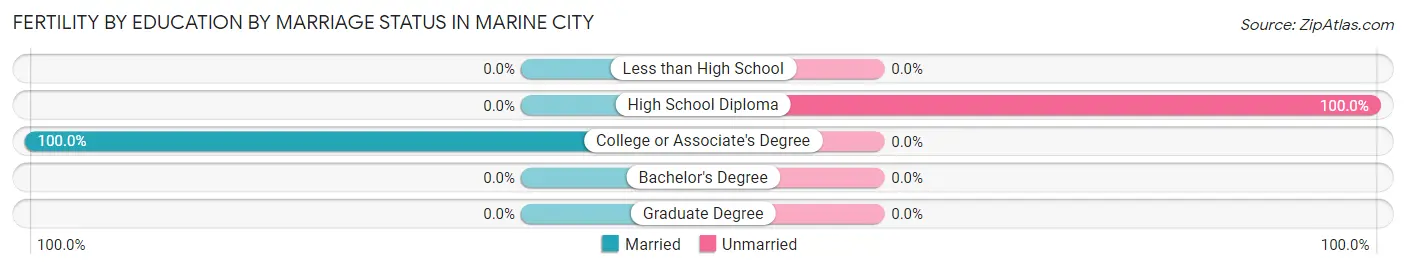
| Educational Attainment | Married | Unmarried |
| Less than High School | 0 (0.0%) | 0 (0.0%) |
| High School Diploma | 0 (0.0%) | 14 (100.0%) |
| College or Associate's Degree | 26 (100.0%) | 0 (0.0%) |
| Bachelor's Degree | 0 (0.0%) | 0 (0.0%) |
| Graduate Degree | 0 (0.0%) | 0 (0.0%) |
| Total | 26 (65.0%) | 14 (35.0%) |
Employment Characteristics in Marine City
Employment by Class of Employer in Marine City
Among the 1,968 employed individuals in Marine City, private company employees (1,405 | 71.4%), self-employed (not incorporated) (138 | 7.0%), and not-for-profit organizations (137 | 7.0%) make up the most common classes of employment.
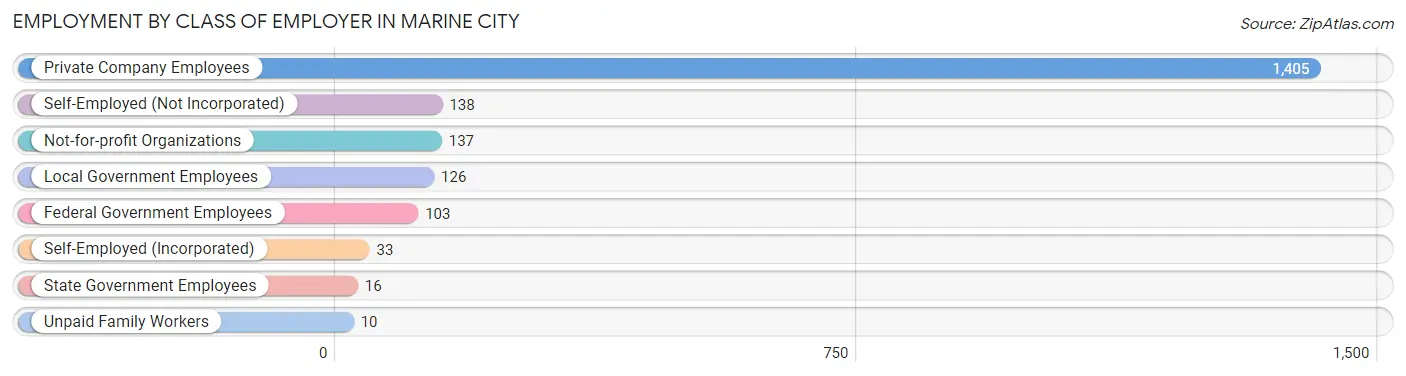
| Employer Class | # Employees | % Employees |
| Private Company Employees | 1,405 | 71.4% |
| Self-Employed (Incorporated) | 33 | 1.7% |
| Self-Employed (Not Incorporated) | 138 | 7.0% |
| Not-for-profit Organizations | 137 | 7.0% |
| Local Government Employees | 126 | 6.4% |
| State Government Employees | 16 | 0.8% |
| Federal Government Employees | 103 | 5.2% |
| Unpaid Family Workers | 10 | 0.5% |
| Total | 1,968 | 100.0% |
Employment Status by Age in Marine City
According to the labor force statistics for Marine City, out of the total population over 16 years of age (3,524), 62.0% or 2,185 individuals are in the labor force, with 8.4% or 184 of them unemployed. The age group with the highest labor force participation rate is 20 to 24 years, with 100.0% or 186 individuals in the labor force. Within the labor force, the 65 to 74 years age range has the highest percentage of unemployed individuals, with 37.2% or 87 of them being unemployed.
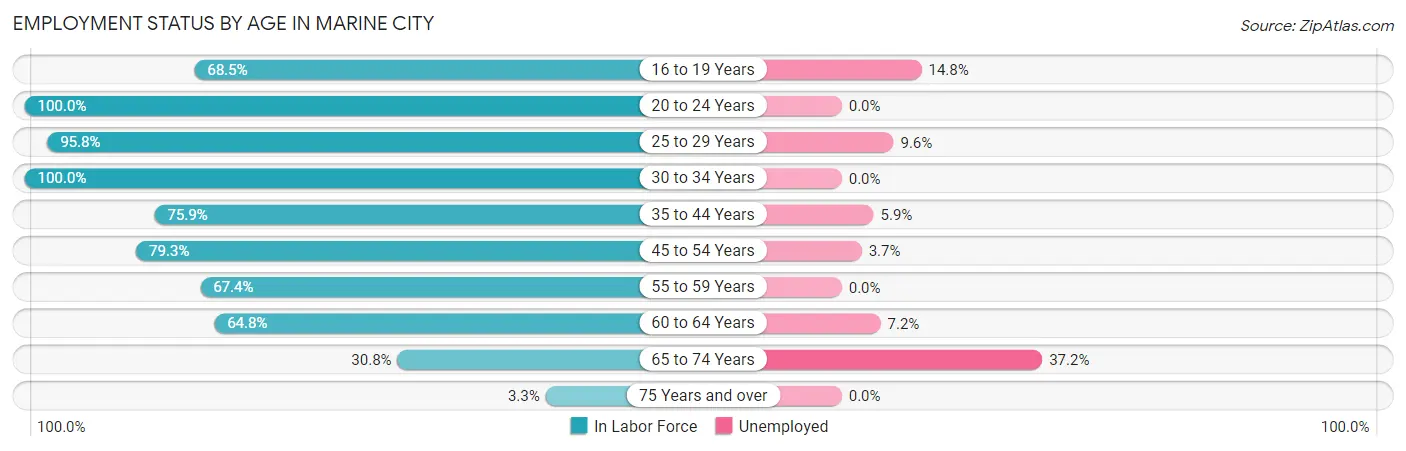
| Age Bracket | In Labor Force | Unemployed |
| 16 to 19 Years | 122 (68.5%) | 18 (14.8%) |
| 20 to 24 Years | 186 (100.0%) | 0 (0.0%) |
| 25 to 29 Years | 249 (95.8%) | 24 (9.6%) |
| 30 to 34 Years | 91 (100.0%) | 0 (0.0%) |
| 35 to 44 Years | 356 (75.9%) | 21 (5.9%) |
| 45 to 54 Years | 534 (79.3%) | 20 (3.7%) |
| 55 to 59 Years | 236 (67.4%) | 0 (0.0%) |
| 60 to 64 Years | 166 (64.8%) | 12 (7.2%) |
| 65 to 74 Years | 234 (30.8%) | 87 (37.2%) |
| 75 Years and over | 10 (3.3%) | 0 (0.0%) |
| Total | 2,185 (62.0%) | 184 (8.4%) |
Employment Status by Educational Attainment in Marine City
According to labor force statistics for Marine City, 77.8% of individuals (1,633) out of the total population between 25 and 64 years of age (2,099) are in the labor force, with 4.7% or 77 of them being unemployed. The group with the highest labor force participation rate are those with the educational attainment of college / associate degree, with 90.9% or 705 individuals in the labor force. Within the labor force, individuals with high school diploma education have the highest percentage of unemployment, with 6.8% or 42 of them being unemployed.
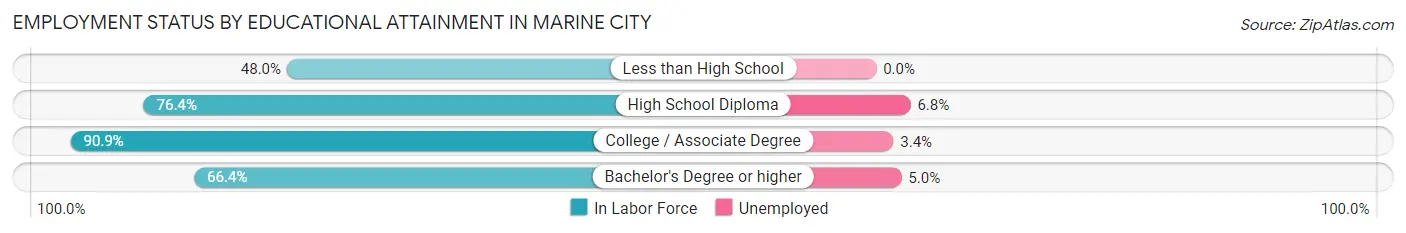
| Educational Attainment | In Labor Force | Unemployed |
| Less than High School | 86 (48.0%) | 0 (0.0%) |
| High School Diploma | 620 (76.4%) | 55 (6.8%) |
| College / Associate Degree | 705 (90.9%) | 26 (3.4%) |
| Bachelor's Degree or higher | 221 (66.4%) | 17 (5.0%) |
| Total | 1,633 (77.8%) | 99 (4.7%) |
Employment Occupations by Sex in Marine City
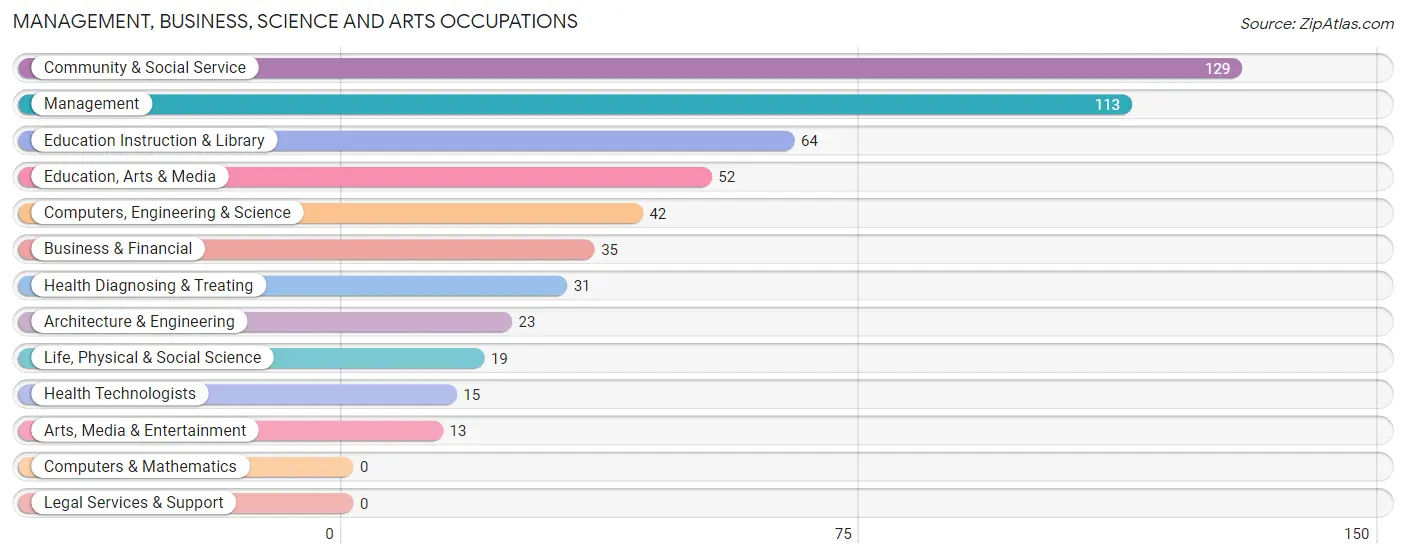
Management, Business, Science and Arts Occupations
The most common Management, Business, Science and Arts occupations in Marine City are Community & Social Service (129 | 6.5%), Management (113 | 5.7%), Education Instruction & Library (64 | 3.2%), Education, Arts & Media (52 | 2.6%), and Computers, Engineering & Science (42 | 2.1%).
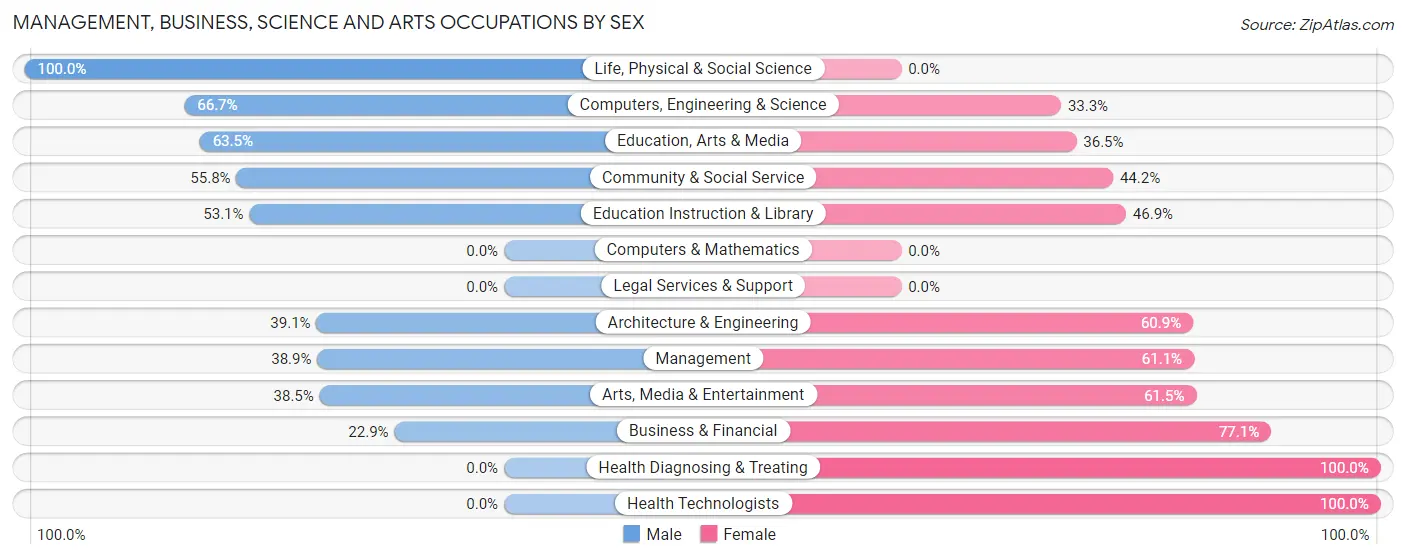
Management, Business, Science and Arts Occupations by Sex
Within the Management, Business, Science and Arts occupations in Marine City, the most male-oriented occupations are Life, Physical & Social Science (100.0%), Computers, Engineering & Science (66.7%), and Education, Arts & Media (63.5%), while the most female-oriented occupations are Health Diagnosing & Treating (100.0%), Health Technologists (100.0%), and Business & Financial (77.1%).
| Occupation | Male | Female |
| Management | 44 (38.9%) | 69 (61.1%) |
| Business & Financial | 8 (22.9%) | 27 (77.1%) |
| Computers, Engineering & Science | 28 (66.7%) | 14 (33.3%) |
| Computers & Mathematics | 0 (0.0%) | 0 (0.0%) |
| Architecture & Engineering | 9 (39.1%) | 14 (60.9%) |
| Life, Physical & Social Science | 19 (100.0%) | 0 (0.0%) |
| Community & Social Service | 72 (55.8%) | 57 (44.2%) |
| Education, Arts & Media | 33 (63.5%) | 19 (36.5%) |
| Legal Services & Support | 0 (0.0%) | 0 (0.0%) |
| Education Instruction & Library | 34 (53.1%) | 30 (46.9%) |
| Arts, Media & Entertainment | 5 (38.5%) | 8 (61.5%) |
| Health Diagnosing & Treating | 0 (0.0%) | 31 (100.0%) |
| Health Technologists | 0 (0.0%) | 15 (100.0%) |
| Total (Category) | 152 (43.4%) | 198 (56.6%) |
| Total (Overall) | 1,077 (54.0%) | 916 (46.0%) |
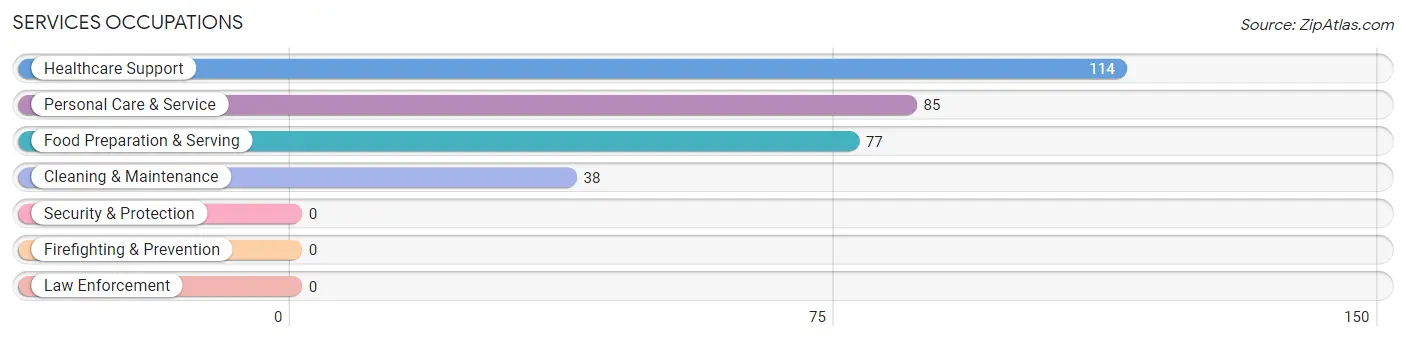
Services Occupations
The most common Services occupations in Marine City are Healthcare Support (114 | 5.7%), Personal Care & Service (85 | 4.3%), Food Preparation & Serving (77 | 3.9%), and Cleaning & Maintenance (38 | 1.9%).
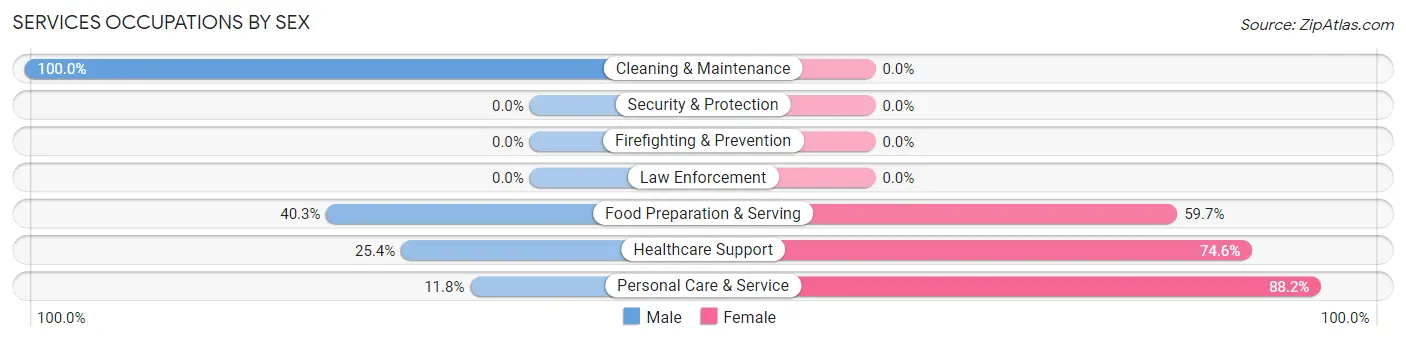
Services Occupations by Sex
Within the Services occupations in Marine City, the most male-oriented occupations are Cleaning & Maintenance (100.0%), Food Preparation & Serving (40.3%), and Healthcare Support (25.4%), while the most female-oriented occupations are Personal Care & Service (88.2%), Healthcare Support (74.6%), and Food Preparation & Serving (59.7%).
| Occupation | Male | Female |
| Healthcare Support | 29 (25.4%) | 85 (74.6%) |
| Security & Protection | 0 (0.0%) | 0 (0.0%) |
| Firefighting & Prevention | 0 (0.0%) | 0 (0.0%) |
| Law Enforcement | 0 (0.0%) | 0 (0.0%) |
| Food Preparation & Serving | 31 (40.3%) | 46 (59.7%) |
| Cleaning & Maintenance | 38 (100.0%) | 0 (0.0%) |
| Personal Care & Service | 10 (11.8%) | 75 (88.2%) |
| Total (Category) | 108 (34.4%) | 206 (65.6%) |
| Total (Overall) | 1,077 (54.0%) | 916 (46.0%) |
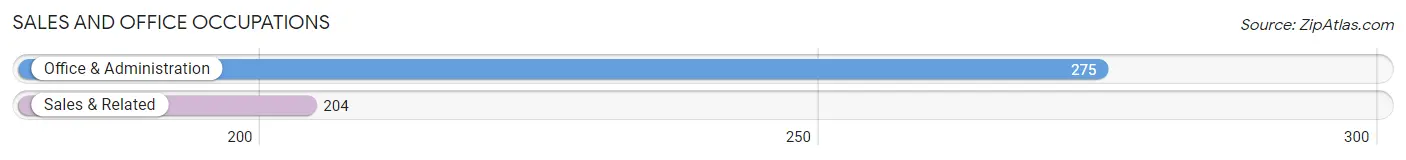
Sales and Office Occupations
The most common Sales and Office occupations in Marine City are Office & Administration (275 | 13.8%), and Sales & Related (204 | 10.2%).
Sales and Office Occupations by Sex
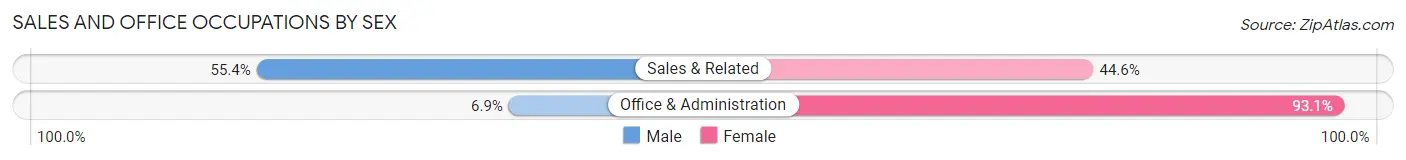
| Occupation | Male | Female |
| Sales & Related | 113 (55.4%) | 91 (44.6%) |
| Office & Administration | 19 (6.9%) | 256 (93.1%) |
| Total (Category) | 132 (27.6%) | 347 (72.4%) |
| Total (Overall) | 1,077 (54.0%) | 916 (46.0%) |
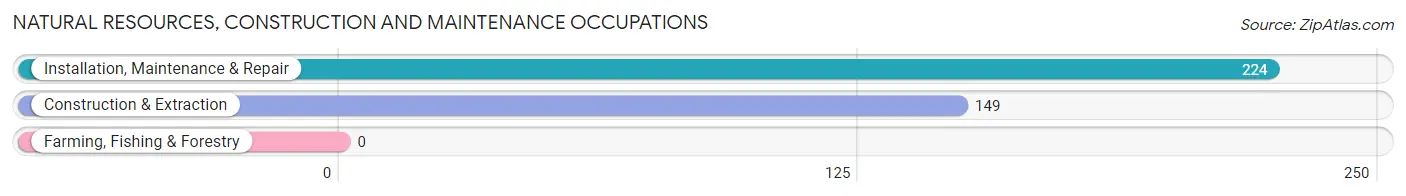
Natural Resources, Construction and Maintenance Occupations
The most common Natural Resources, Construction and Maintenance occupations in Marine City are Installation, Maintenance & Repair (224 | 11.2%), and Construction & Extraction (149 | 7.5%).
Natural Resources, Construction and Maintenance Occupations by Sex
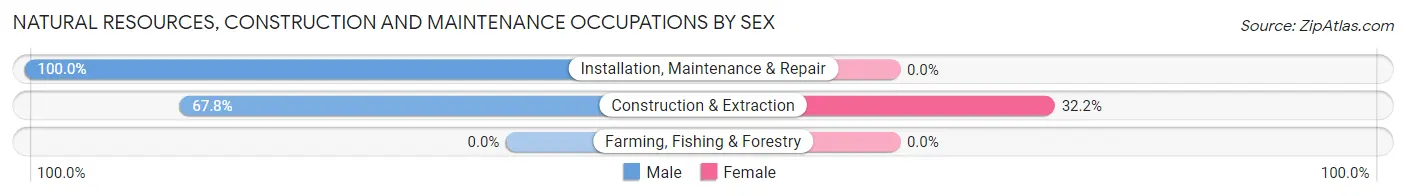
| Occupation | Male | Female |
| Farming, Fishing & Forestry | 0 (0.0%) | 0 (0.0%) |
| Construction & Extraction | 101 (67.8%) | 48 (32.2%) |
| Installation, Maintenance & Repair | 224 (100.0%) | 0 (0.0%) |
| Total (Category) | 325 (87.1%) | 48 (12.9%) |
| Total (Overall) | 1,077 (54.0%) | 916 (46.0%) |
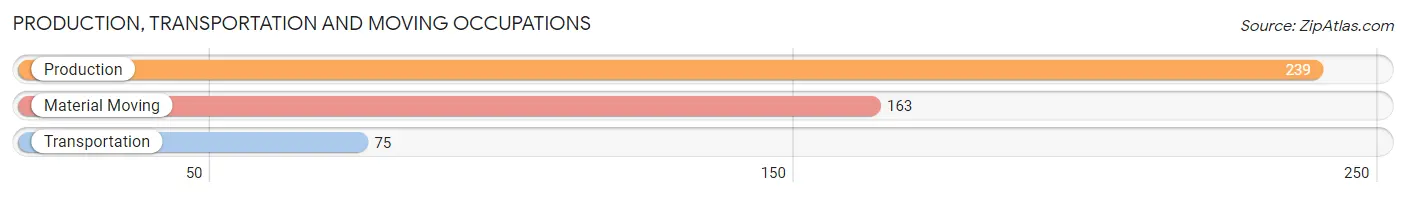
Production, Transportation and Moving Occupations
The most common Production, Transportation and Moving occupations in Marine City are Production (239 | 12.0%), Material Moving (163 | 8.2%), and Transportation (75 | 3.8%).
Production, Transportation and Moving Occupations by Sex
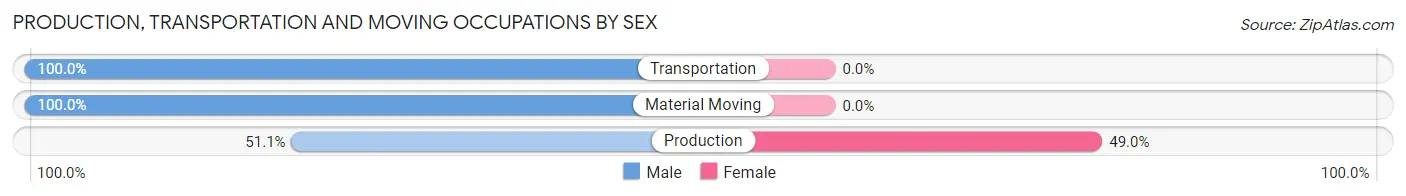
| Occupation | Male | Female |
| Production | 122 (51.0%) | 117 (48.9%) |
| Transportation | 75 (100.0%) | 0 (0.0%) |
| Material Moving | 163 (100.0%) | 0 (0.0%) |
| Total (Category) | 360 (75.5%) | 117 (24.5%) |
| Total (Overall) | 1,077 (54.0%) | 916 (46.0%) |
Employment Industries by Sex in Marine City
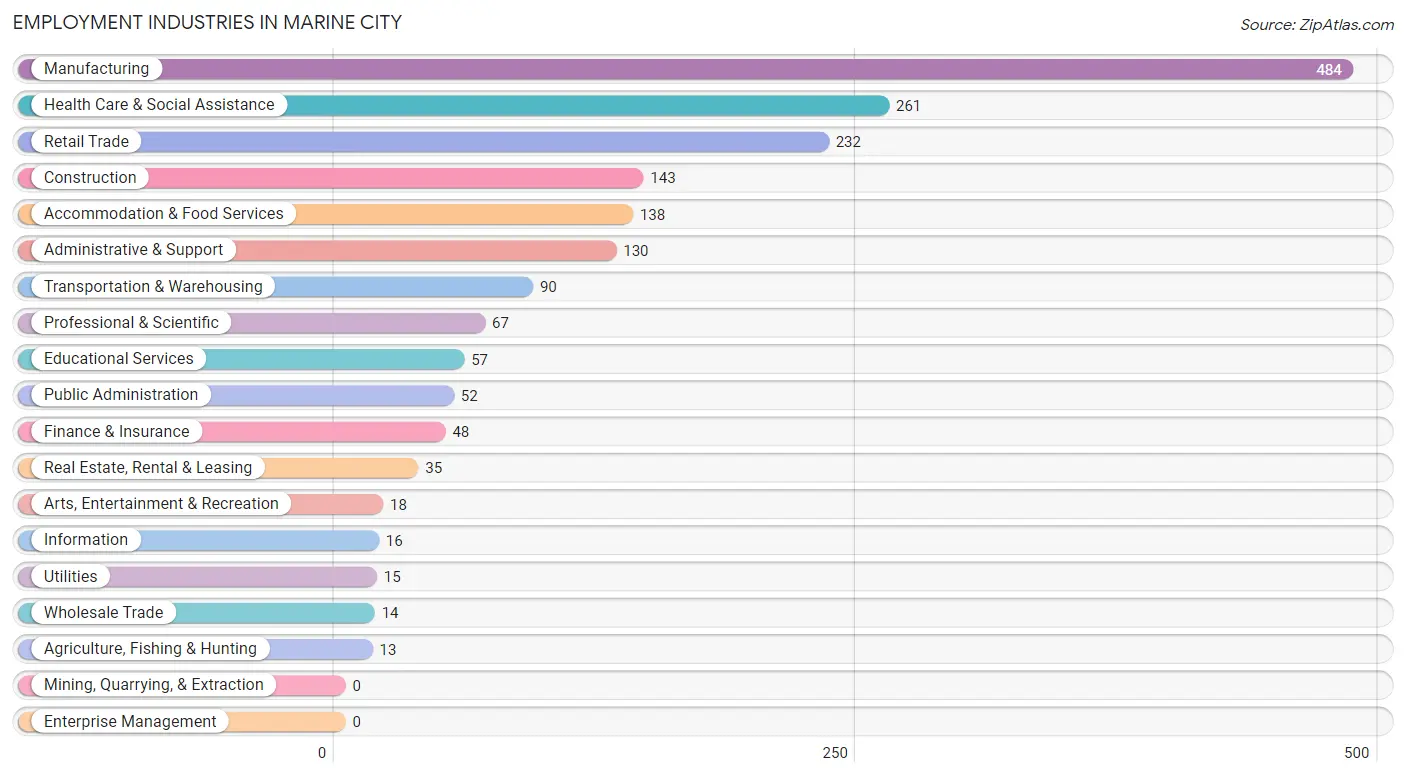
Employment Industries in Marine City
The major employment industries in Marine City include Manufacturing (484 | 24.3%), Health Care & Social Assistance (261 | 13.1%), Retail Trade (232 | 11.6%), Construction (143 | 7.2%), and Accommodation & Food Services (138 | 6.9%).
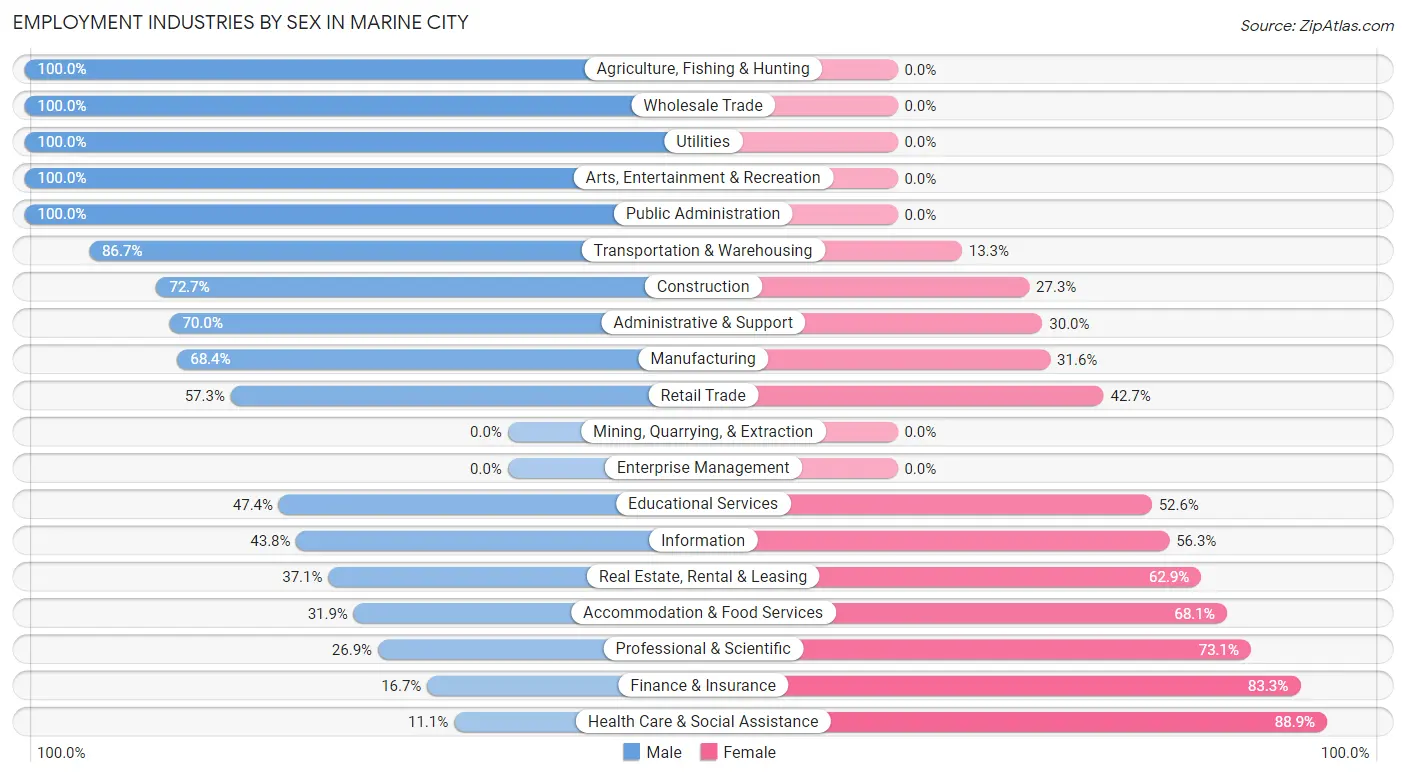
Employment Industries by Sex in Marine City
The Marine City industries that see more men than women are Agriculture, Fishing & Hunting (100.0%), Wholesale Trade (100.0%), and Utilities (100.0%), whereas the industries that tend to have a higher number of women are Health Care & Social Assistance (88.9%), Finance & Insurance (83.3%), and Professional & Scientific (73.1%).
| Industry | Male | Female |
| Agriculture, Fishing & Hunting | 13 (100.0%) | 0 (0.0%) |
| Mining, Quarrying, & Extraction | 0 (0.0%) | 0 (0.0%) |
| Construction | 104 (72.7%) | 39 (27.3%) |
| Manufacturing | 331 (68.4%) | 153 (31.6%) |
| Wholesale Trade | 14 (100.0%) | 0 (0.0%) |
| Retail Trade | 133 (57.3%) | 99 (42.7%) |
| Transportation & Warehousing | 78 (86.7%) | 12 (13.3%) |
| Utilities | 15 (100.0%) | 0 (0.0%) |
| Information | 7 (43.8%) | 9 (56.2%) |
| Finance & Insurance | 8 (16.7%) | 40 (83.3%) |
| Real Estate, Rental & Leasing | 13 (37.1%) | 22 (62.9%) |
| Professional & Scientific | 18 (26.9%) | 49 (73.1%) |
| Enterprise Management | 0 (0.0%) | 0 (0.0%) |
| Administrative & Support | 91 (70.0%) | 39 (30.0%) |
| Educational Services | 27 (47.4%) | 30 (52.6%) |
| Health Care & Social Assistance | 29 (11.1%) | 232 (88.9%) |
| Arts, Entertainment & Recreation | 18 (100.0%) | 0 (0.0%) |
| Accommodation & Food Services | 44 (31.9%) | 94 (68.1%) |
| Public Administration | 52 (100.0%) | 0 (0.0%) |
| Total | 1,077 (54.0%) | 916 (46.0%) |
Education in Marine City
School Enrollment in Marine City
The most common levels of schooling among the 693 students in Marine City are middle school (191 | 27.6%), college / undergraduate (153 | 22.1%), and high school (142 | 20.5%).
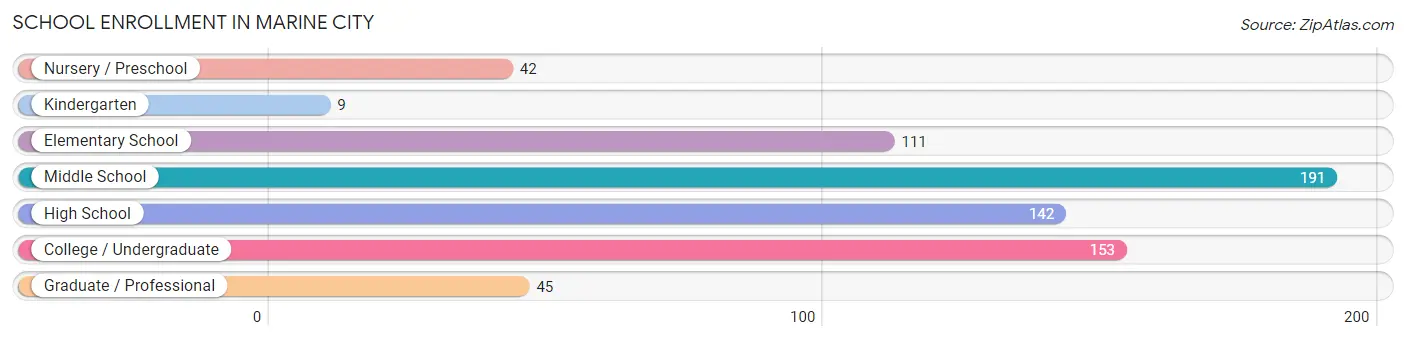
| School Level | # Students | % Students |
| Nursery / Preschool | 42 | 6.1% |
| Kindergarten | 9 | 1.3% |
| Elementary School | 111 | 16.0% |
| Middle School | 191 | 27.6% |
| High School | 142 | 20.5% |
| College / Undergraduate | 153 | 22.1% |
| Graduate / Professional | 45 | 6.5% |
| Total | 693 | 100.0% |
School Enrollment by Age by Funding Source in Marine City
Out of a total of 693 students who are enrolled in schools in Marine City, 75 (10.8%) attend a private institution, while the remaining 618 (89.2%) are enrolled in public schools. The age group of 25 to 34 year olds has the highest likelihood of being enrolled in private schools, with 19 (30.6% in the age bracket) enrolled. Conversely, the age group of 15 to 17 year olds has the lowest likelihood of being enrolled in a private school, with 119 (100.0% in the age bracket) attending a public institution.
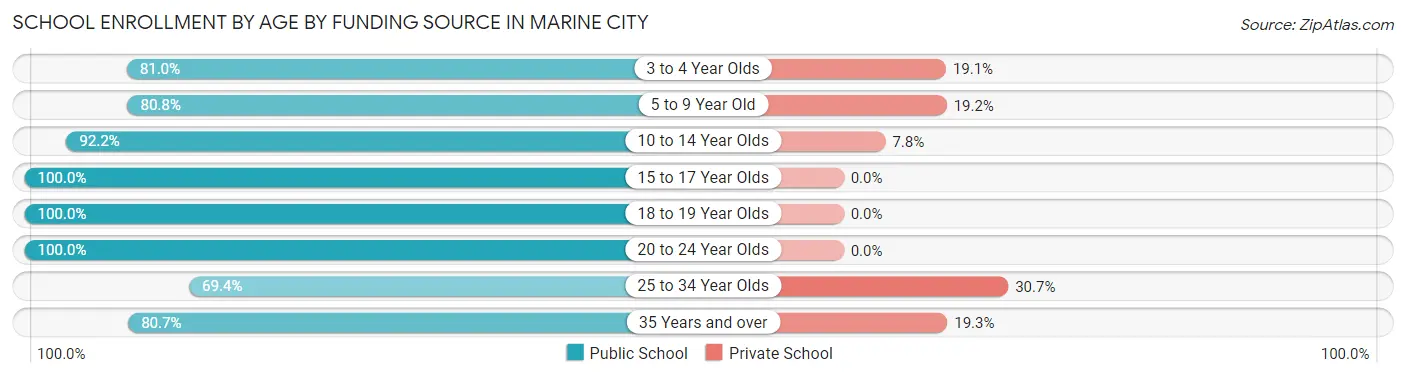
| Age Bracket | Public School | Private School |
| 3 to 4 Year Olds | 34 (80.9%) | 8 (19.1%) |
| 5 to 9 Year Old | 80 (80.8%) | 19 (19.2%) |
| 10 to 14 Year Olds | 213 (92.2%) | 18 (7.8%) |
| 15 to 17 Year Olds | 119 (100.0%) | 0 (0.0%) |
| 18 to 19 Year Olds | 56 (100.0%) | 0 (0.0%) |
| 20 to 24 Year Olds | 27 (100.0%) | 0 (0.0%) |
| 25 to 34 Year Olds | 43 (69.4%) | 19 (30.6%) |
| 35 Years and over | 46 (80.7%) | 11 (19.3%) |
| Total | 618 (89.2%) | 75 (10.8%) |
Educational Attainment by Field of Study in Marine City
Engineering (95 | 18.4%), education (89 | 17.2%), liberal arts & history (59 | 11.4%), business (57 | 11.0%), and literature & languages (57 | 11.0%) are the most common fields of study among 517 individuals in Marine City who have obtained a bachelor's degree or higher.
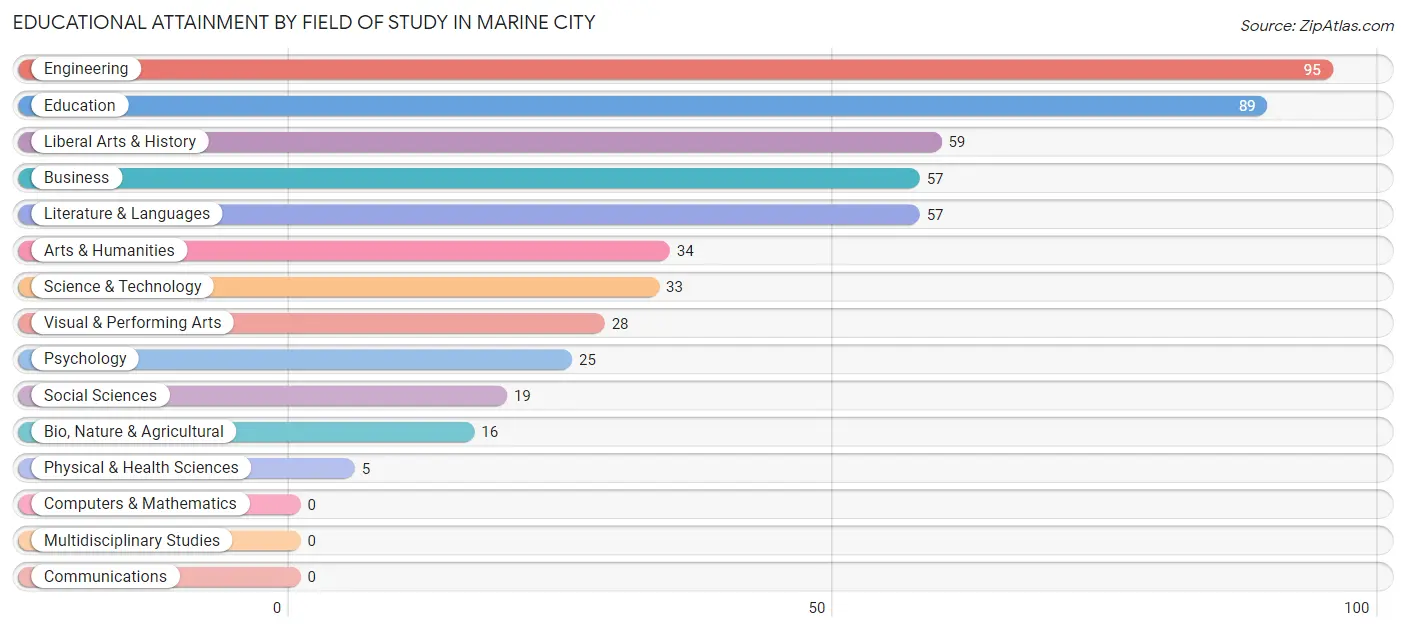
| Field of Study | # Graduates | % Graduates |
| Computers & Mathematics | 0 | 0.0% |
| Bio, Nature & Agricultural | 16 | 3.1% |
| Physical & Health Sciences | 5 | 1.0% |
| Psychology | 25 | 4.8% |
| Social Sciences | 19 | 3.7% |
| Engineering | 95 | 18.4% |
| Multidisciplinary Studies | 0 | 0.0% |
| Science & Technology | 33 | 6.4% |
| Business | 57 | 11.0% |
| Education | 89 | 17.2% |
| Literature & Languages | 57 | 11.0% |
| Liberal Arts & History | 59 | 11.4% |
| Visual & Performing Arts | 28 | 5.4% |
| Communications | 0 | 0.0% |
| Arts & Humanities | 34 | 6.6% |
| Total | 517 | 100.0% |
Transportation & Commute in Marine City
Vehicle Availability by Sex in Marine City
The most prevalent vehicle ownership categories in Marine City are males with 2 vehicles (588, accounting for 54.1%) and females with 2 vehicles (375, making up 66.7%).
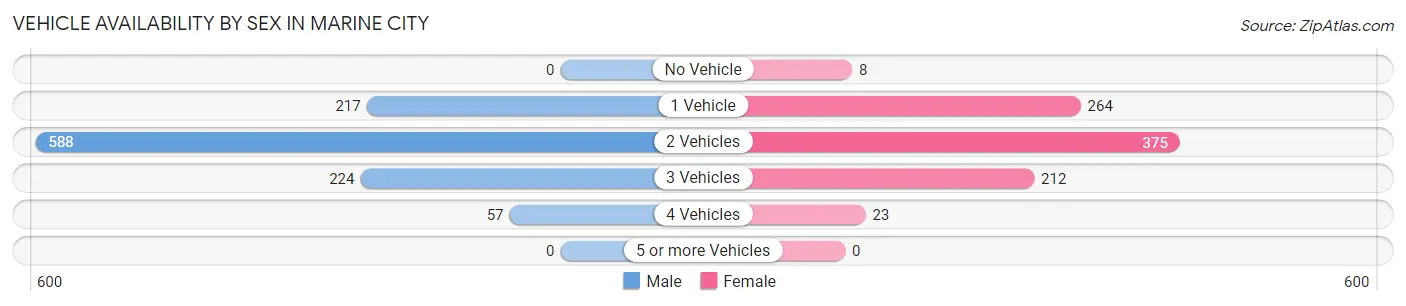
| Vehicles Available | Male | Female |
| No Vehicle | 0 (0.0%) | 8 (0.9%) |
| 1 Vehicle | 217 (20.0%) | 264 (29.9%) |
| 2 Vehicles | 588 (54.1%) | 375 (42.5%) |
| 3 Vehicles | 224 (20.6%) | 212 (24.0%) |
| 4 Vehicles | 57 (5.2%) | 23 (2.6%) |
| 5 or more Vehicles | 0 (0.0%) | 0 (0.0%) |
| Total | 1,086 (100.0%) | 882 (100.0%) |
Commute Time in Marine City
The most frequently occuring commute durations in Marine City are 45 to 59 minutes (326 commuters, 17.3%), 5 to 9 minutes (324 commuters, 17.2%), and 15 to 19 minutes (236 commuters, 12.5%).
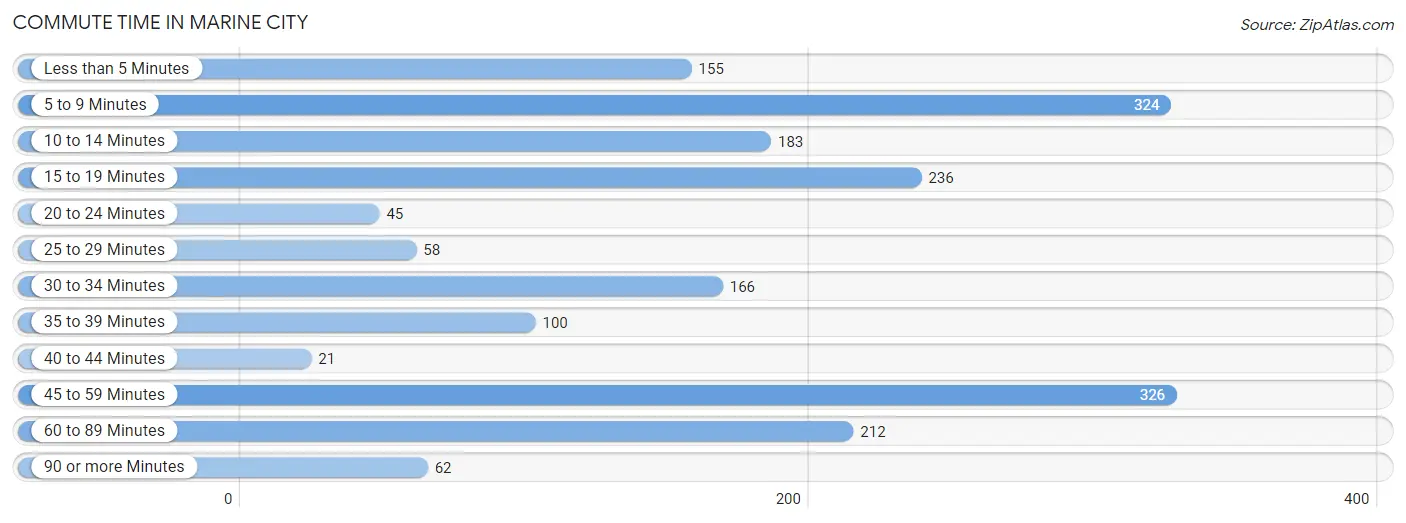
| Commute Time | # Commuters | % Commuters |
| Less than 5 Minutes | 155 | 8.2% |
| 5 to 9 Minutes | 324 | 17.2% |
| 10 to 14 Minutes | 183 | 9.7% |
| 15 to 19 Minutes | 236 | 12.5% |
| 20 to 24 Minutes | 45 | 2.4% |
| 25 to 29 Minutes | 58 | 3.1% |
| 30 to 34 Minutes | 166 | 8.8% |
| 35 to 39 Minutes | 100 | 5.3% |
| 40 to 44 Minutes | 21 | 1.1% |
| 45 to 59 Minutes | 326 | 17.3% |
| 60 to 89 Minutes | 212 | 11.2% |
| 90 or more Minutes | 62 | 3.3% |
Commute Time by Sex in Marine City
The most common commute times in Marine City are 45 to 59 minutes (244 commuters, 23.4%) for males and 5 to 9 minutes (180 commuters, 21.3%) for females.
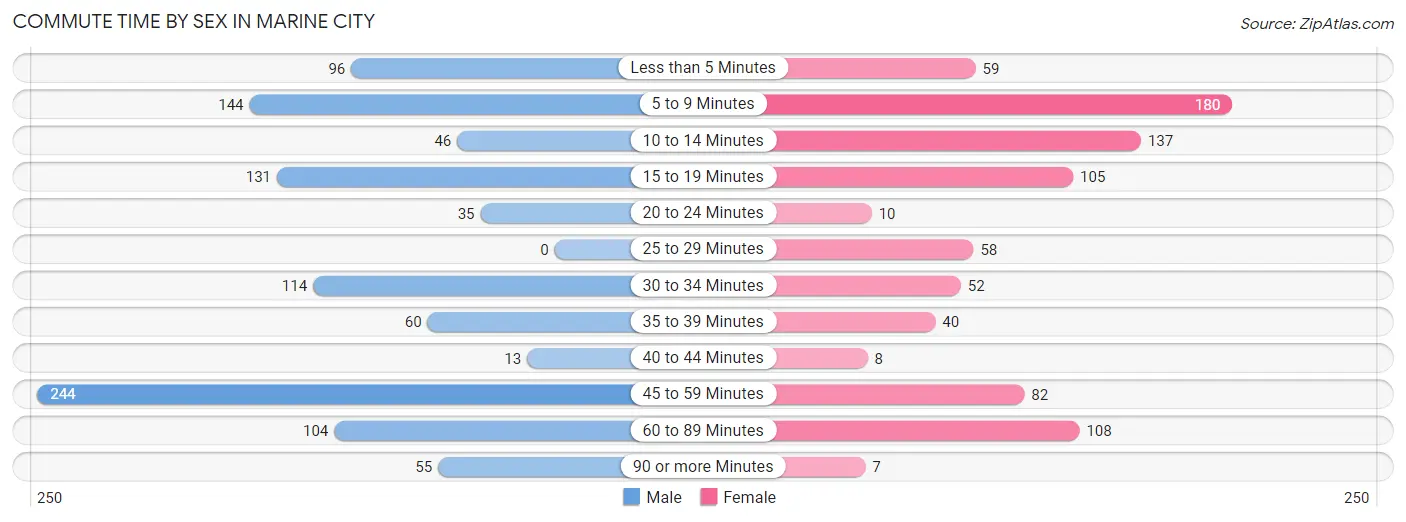
| Commute Time | Male | Female |
| Less than 5 Minutes | 96 (9.2%) | 59 (7.0%) |
| 5 to 9 Minutes | 144 (13.8%) | 180 (21.3%) |
| 10 to 14 Minutes | 46 (4.4%) | 137 (16.2%) |
| 15 to 19 Minutes | 131 (12.6%) | 105 (12.4%) |
| 20 to 24 Minutes | 35 (3.4%) | 10 (1.2%) |
| 25 to 29 Minutes | 0 (0.0%) | 58 (6.9%) |
| 30 to 34 Minutes | 114 (10.9%) | 52 (6.1%) |
| 35 to 39 Minutes | 60 (5.8%) | 40 (4.7%) |
| 40 to 44 Minutes | 13 (1.3%) | 8 (0.9%) |
| 45 to 59 Minutes | 244 (23.4%) | 82 (9.7%) |
| 60 to 89 Minutes | 104 (10.0%) | 108 (12.8%) |
| 90 or more Minutes | 55 (5.3%) | 7 (0.8%) |
Time of Departure to Work by Sex in Marine City
The most frequent times of departure to work in Marine City are 12:00 AM to 4:59 AM (197, 18.9%) for males and 9:00 AM to 9:59 AM (155, 18.3%) for females.
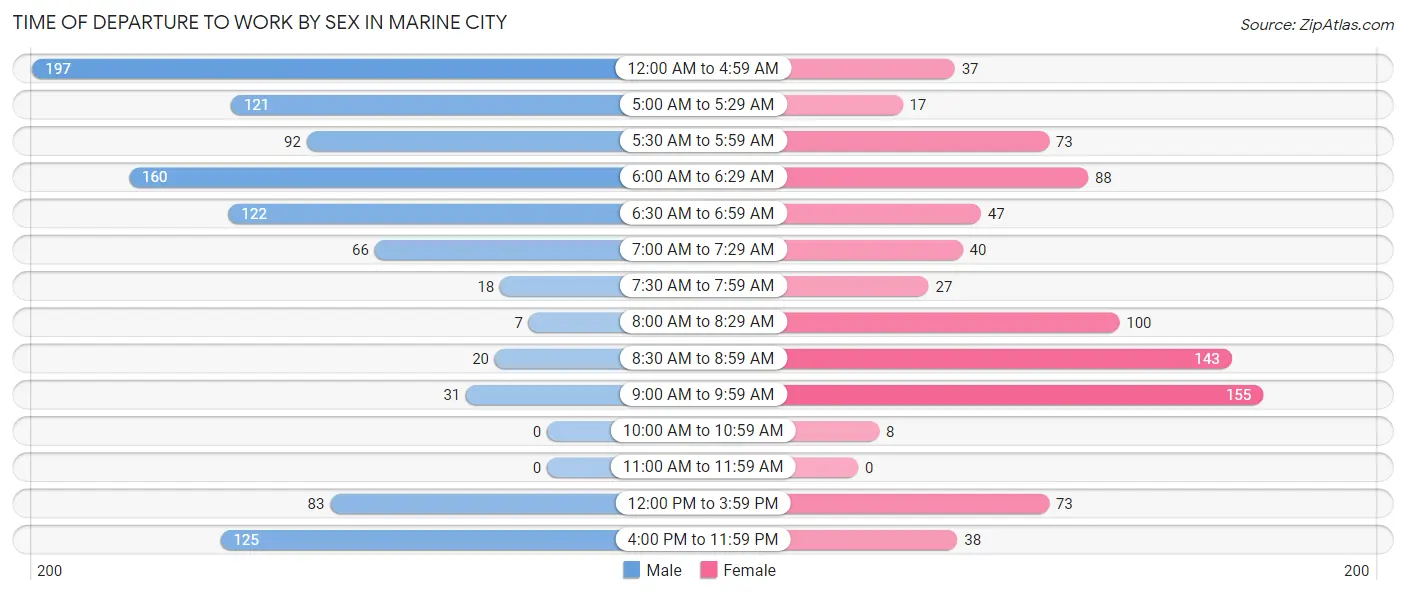
| Time of Departure | Male | Female |
| 12:00 AM to 4:59 AM | 197 (18.9%) | 37 (4.4%) |
| 5:00 AM to 5:29 AM | 121 (11.6%) | 17 (2.0%) |
| 5:30 AM to 5:59 AM | 92 (8.8%) | 73 (8.6%) |
| 6:00 AM to 6:29 AM | 160 (15.4%) | 88 (10.4%) |
| 6:30 AM to 6:59 AM | 122 (11.7%) | 47 (5.6%) |
| 7:00 AM to 7:29 AM | 66 (6.3%) | 40 (4.7%) |
| 7:30 AM to 7:59 AM | 18 (1.7%) | 27 (3.2%) |
| 8:00 AM to 8:29 AM | 7 (0.7%) | 100 (11.8%) |
| 8:30 AM to 8:59 AM | 20 (1.9%) | 143 (16.9%) |
| 9:00 AM to 9:59 AM | 31 (3.0%) | 155 (18.3%) |
| 10:00 AM to 10:59 AM | 0 (0.0%) | 8 (0.9%) |
| 11:00 AM to 11:59 AM | 0 (0.0%) | 0 (0.0%) |
| 12:00 PM to 3:59 PM | 83 (8.0%) | 73 (8.6%) |
| 4:00 PM to 11:59 PM | 125 (12.0%) | 38 (4.5%) |
| Total | 1,042 (100.0%) | 846 (100.0%) |
Housing Occupancy in Marine City
Occupancy by Ownership in Marine City
Of the total 1,948 dwellings in Marine City, owner-occupied units account for 1,595 (81.9%), while renter-occupied units make up 353 (18.1%).
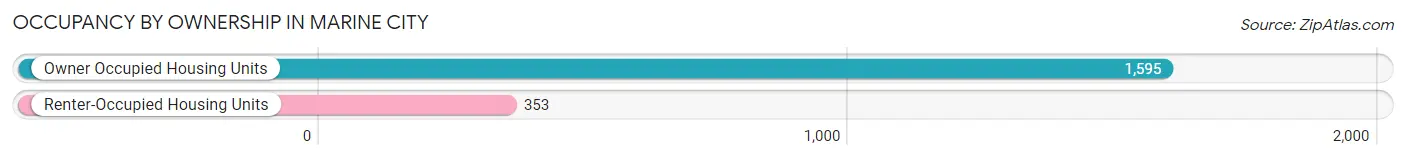
| Occupancy | # Housing Units | % Housing Units |
| Owner Occupied Housing Units | 1,595 | 81.9% |
| Renter-Occupied Housing Units | 353 | 18.1% |
| Total Occupied Housing Units | 1,948 | 100.0% |
Occupancy by Household Size in Marine City
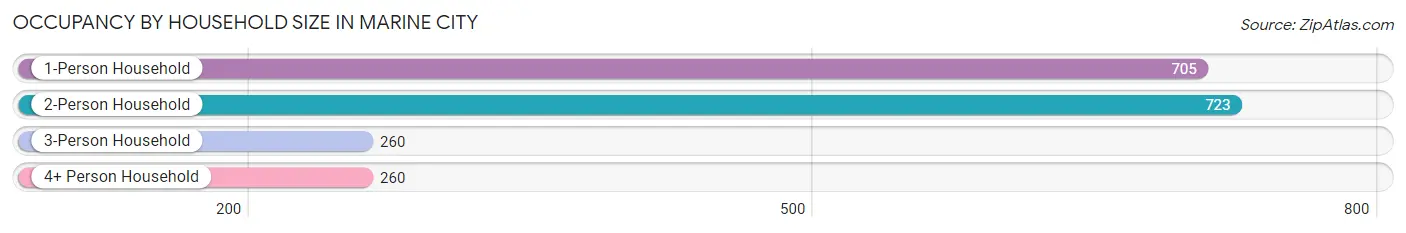
| Household Size | # Housing Units | % Housing Units |
| 1-Person Household | 705 | 36.2% |
| 2-Person Household | 723 | 37.1% |
| 3-Person Household | 260 | 13.4% |
| 4+ Person Household | 260 | 13.4% |
| Total Housing Units | 1,948 | 100.0% |
Occupancy by Ownership by Household Size in Marine City
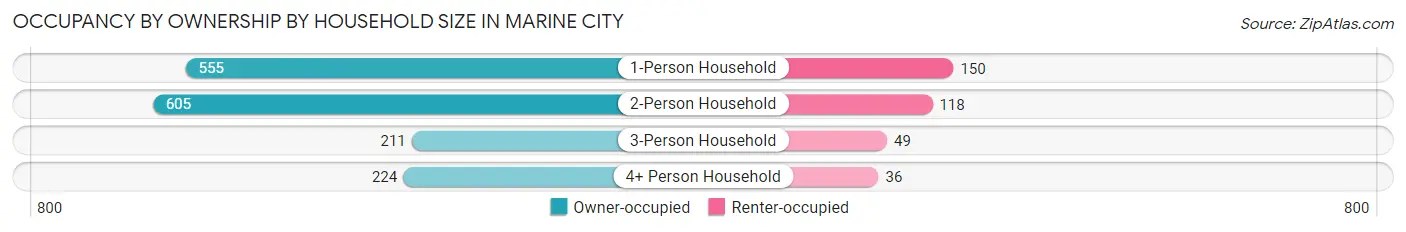
| Household Size | Owner-occupied | Renter-occupied |
| 1-Person Household | 555 (78.7%) | 150 (21.3%) |
| 2-Person Household | 605 (83.7%) | 118 (16.3%) |
| 3-Person Household | 211 (81.1%) | 49 (18.9%) |
| 4+ Person Household | 224 (86.2%) | 36 (13.9%) |
| Total Housing Units | 1,595 (81.9%) | 353 (18.1%) |
Occupancy by Educational Attainment in Marine City
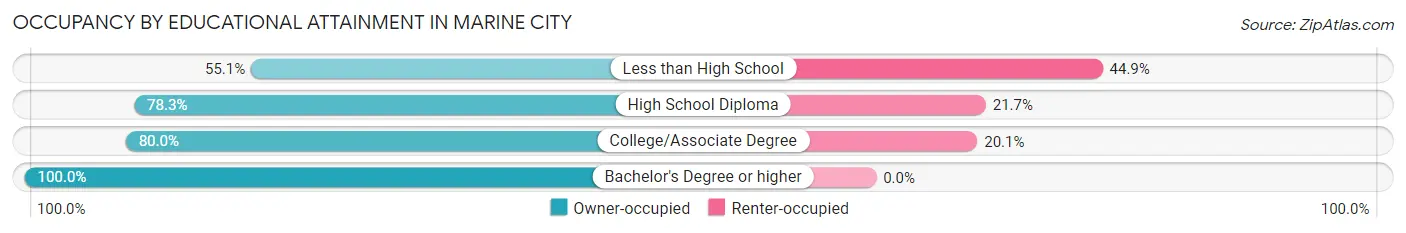
| Household Size | Owner-occupied | Renter-occupied |
| Less than High School | 54 (55.1%) | 44 (44.9%) |
| High School Diploma | 562 (78.3%) | 156 (21.7%) |
| College/Associate Degree | 610 (79.9%) | 153 (20.1%) |
| Bachelor's Degree or higher | 369 (100.0%) | 0 (0.0%) |
Occupancy by Age of Householder in Marine City
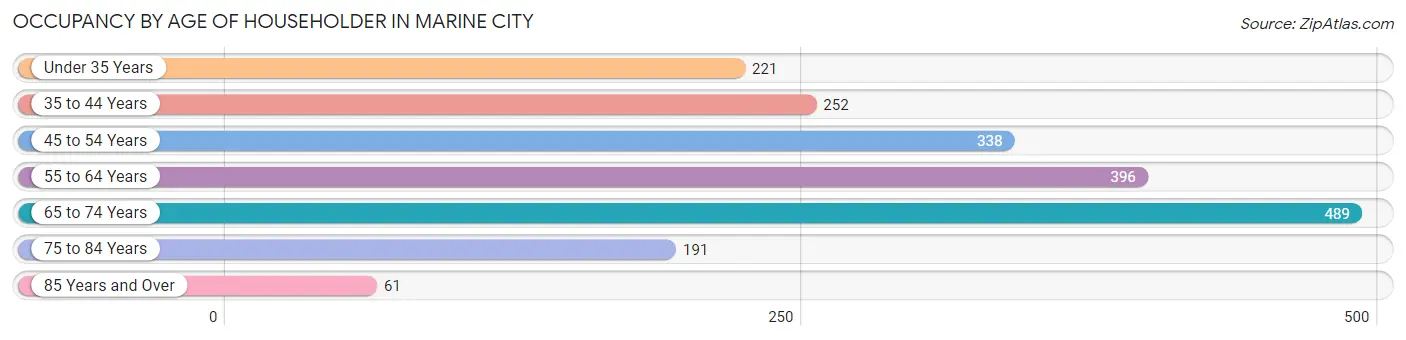
| Age Bracket | # Households | % Households |
| Under 35 Years | 221 | 11.3% |
| 35 to 44 Years | 252 | 12.9% |
| 45 to 54 Years | 338 | 17.3% |
| 55 to 64 Years | 396 | 20.3% |
| 65 to 74 Years | 489 | 25.1% |
| 75 to 84 Years | 191 | 9.8% |
| 85 Years and Over | 61 | 3.1% |
| Total | 1,948 | 100.0% |
Housing Finances in Marine City
Median Income by Occupancy in Marine City
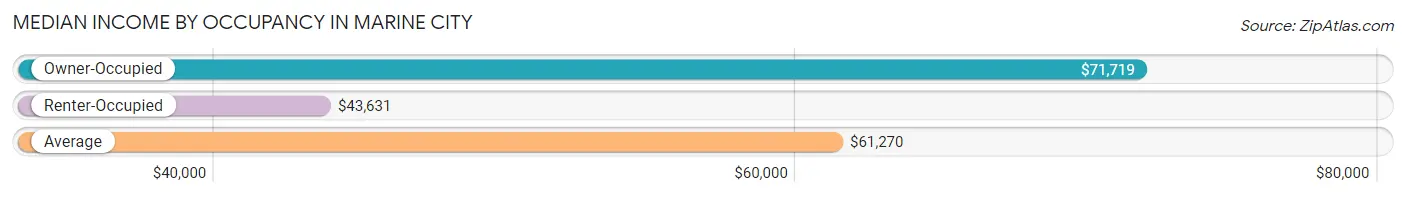
| Occupancy Type | # Households | Median Income |
| Owner-Occupied | 1,595 (81.9%) | $71,719 |
| Renter-Occupied | 353 (18.1%) | $43,631 |
| Average | 1,948 (100.0%) | $61,270 |
Occupancy by Householder Income Bracket in Marine City
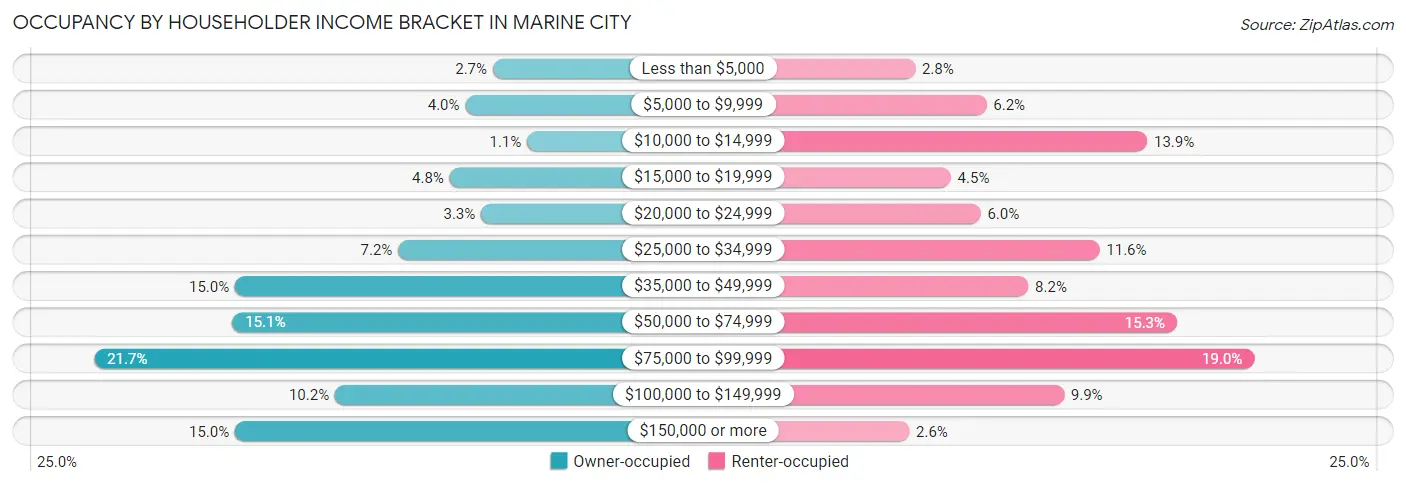
| Income Bracket | Owner-occupied | Renter-occupied |
| Less than $5,000 | 43 (2.7%) | 10 (2.8%) |
| $5,000 to $9,999 | 64 (4.0%) | 22 (6.2%) |
| $10,000 to $14,999 | 17 (1.1%) | 49 (13.9%) |
| $15,000 to $19,999 | 76 (4.8%) | 16 (4.5%) |
| $20,000 to $24,999 | 52 (3.3%) | 21 (5.9%) |
| $25,000 to $34,999 | 115 (7.2%) | 41 (11.6%) |
| $35,000 to $49,999 | 239 (15.0%) | 29 (8.2%) |
| $50,000 to $74,999 | 241 (15.1%) | 54 (15.3%) |
| $75,000 to $99,999 | 346 (21.7%) | 67 (19.0%) |
| $100,000 to $149,999 | 163 (10.2%) | 35 (9.9%) |
| $150,000 or more | 239 (15.0%) | 9 (2.5%) |
| Total | 1,595 (100.0%) | 353 (100.0%) |
Monthly Housing Cost Tiers in Marine City
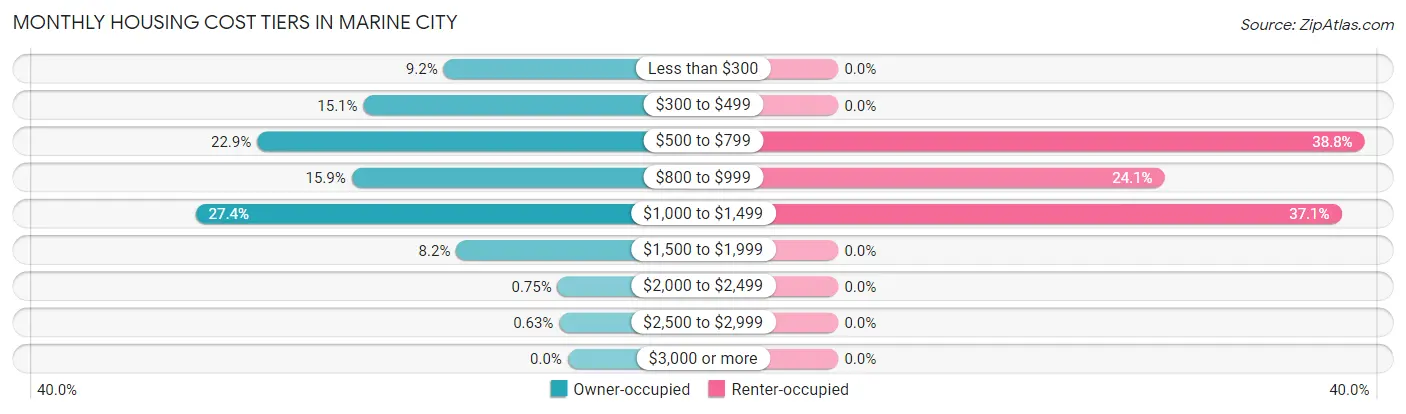
| Monthly Cost | Owner-occupied | Renter-occupied |
| Less than $300 | 146 (9.1%) | 0 (0.0%) |
| $300 to $499 | 240 (15.0%) | 0 (0.0%) |
| $500 to $799 | 365 (22.9%) | 137 (38.8%) |
| $800 to $999 | 254 (15.9%) | 85 (24.1%) |
| $1,000 to $1,499 | 437 (27.4%) | 131 (37.1%) |
| $1,500 to $1,999 | 131 (8.2%) | 0 (0.0%) |
| $2,000 to $2,499 | 12 (0.7%) | 0 (0.0%) |
| $2,500 to $2,999 | 10 (0.6%) | 0 (0.0%) |
| $3,000 or more | 0 (0.0%) | 0 (0.0%) |
| Total | 1,595 (100.0%) | 353 (100.0%) |
Physical Housing Characteristics in Marine City
Housing Structures in Marine City
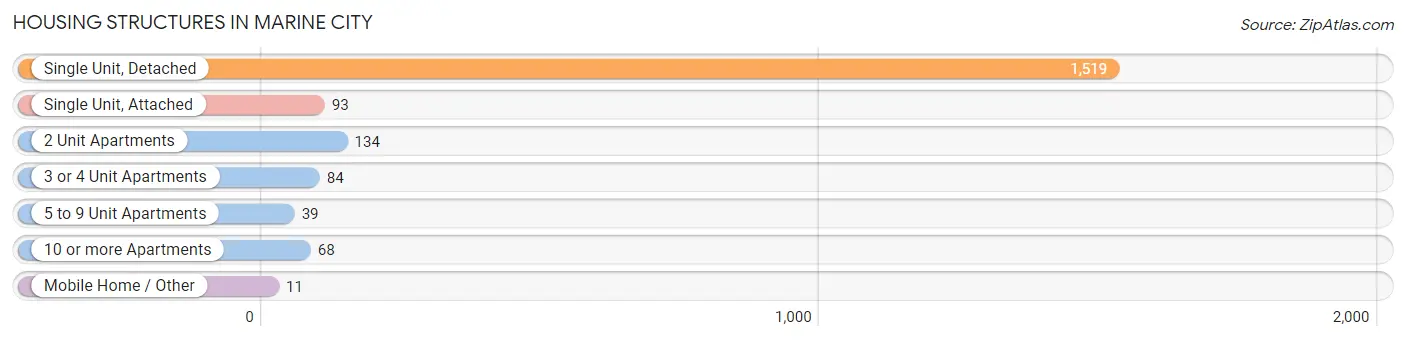
| Structure Type | # Housing Units | % Housing Units |
| Single Unit, Detached | 1,519 | 78.0% |
| Single Unit, Attached | 93 | 4.8% |
| 2 Unit Apartments | 134 | 6.9% |
| 3 or 4 Unit Apartments | 84 | 4.3% |
| 5 to 9 Unit Apartments | 39 | 2.0% |
| 10 or more Apartments | 68 | 3.5% |
| Mobile Home / Other | 11 | 0.6% |
| Total | 1,948 | 100.0% |
Housing Structures by Occupancy in Marine City
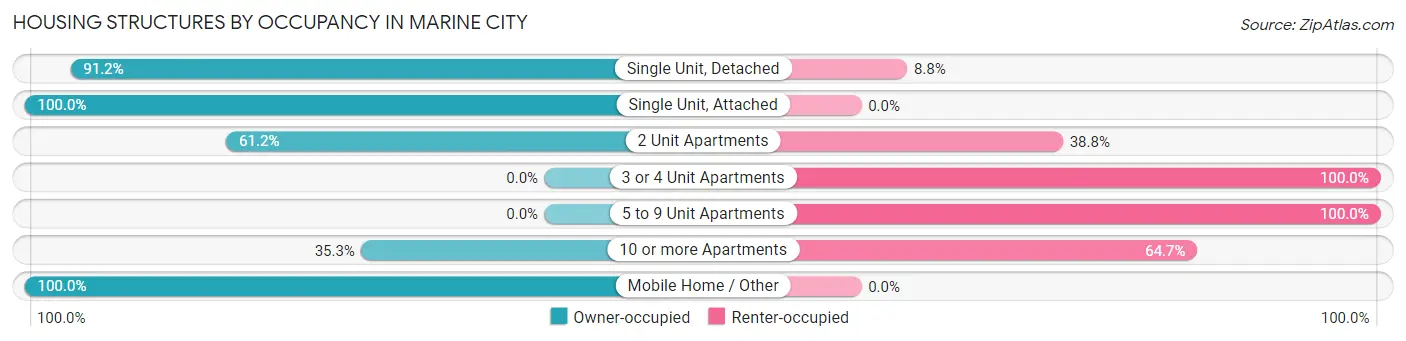
| Structure Type | Owner-occupied | Renter-occupied |
| Single Unit, Detached | 1,385 (91.2%) | 134 (8.8%) |
| Single Unit, Attached | 93 (100.0%) | 0 (0.0%) |
| 2 Unit Apartments | 82 (61.2%) | 52 (38.8%) |
| 3 or 4 Unit Apartments | 0 (0.0%) | 84 (100.0%) |
| 5 to 9 Unit Apartments | 0 (0.0%) | 39 (100.0%) |
| 10 or more Apartments | 24 (35.3%) | 44 (64.7%) |
| Mobile Home / Other | 11 (100.0%) | 0 (0.0%) |
| Total | 1,595 (81.9%) | 353 (18.1%) |
Housing Structures by Number of Rooms in Marine City
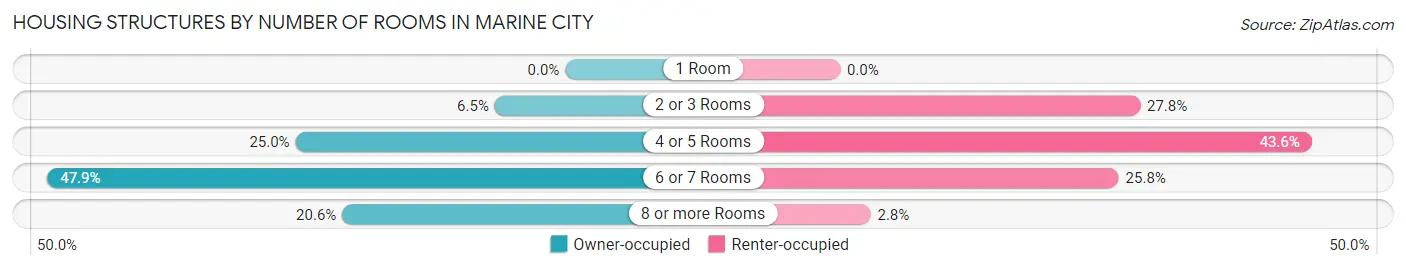
| Number of Rooms | Owner-occupied | Renter-occupied |
| 1 Room | 0 (0.0%) | 0 (0.0%) |
| 2 or 3 Rooms | 104 (6.5%) | 98 (27.8%) |
| 4 or 5 Rooms | 398 (24.9%) | 154 (43.6%) |
| 6 or 7 Rooms | 764 (47.9%) | 91 (25.8%) |
| 8 or more Rooms | 329 (20.6%) | 10 (2.8%) |
| Total | 1,595 (100.0%) | 353 (100.0%) |
Housing Structure by Heating Type in Marine City
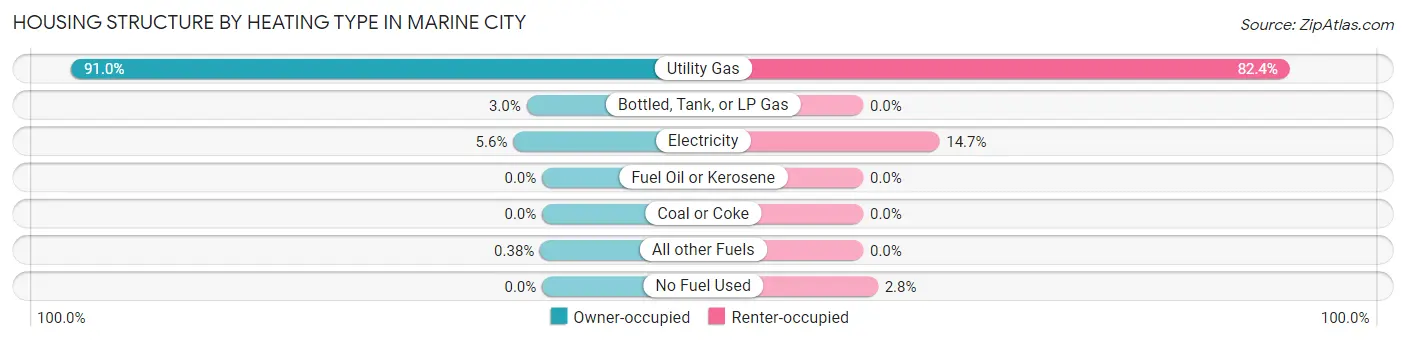
| Heating Type | Owner-occupied | Renter-occupied |
| Utility Gas | 1,452 (91.0%) | 291 (82.4%) |
| Bottled, Tank, or LP Gas | 48 (3.0%) | 0 (0.0%) |
| Electricity | 89 (5.6%) | 52 (14.7%) |
| Fuel Oil or Kerosene | 0 (0.0%) | 0 (0.0%) |
| Coal or Coke | 0 (0.0%) | 0 (0.0%) |
| All other Fuels | 6 (0.4%) | 0 (0.0%) |
| No Fuel Used | 0 (0.0%) | 10 (2.8%) |
| Total | 1,595 (100.0%) | 353 (100.0%) |
Household Vehicle Usage in Marine City
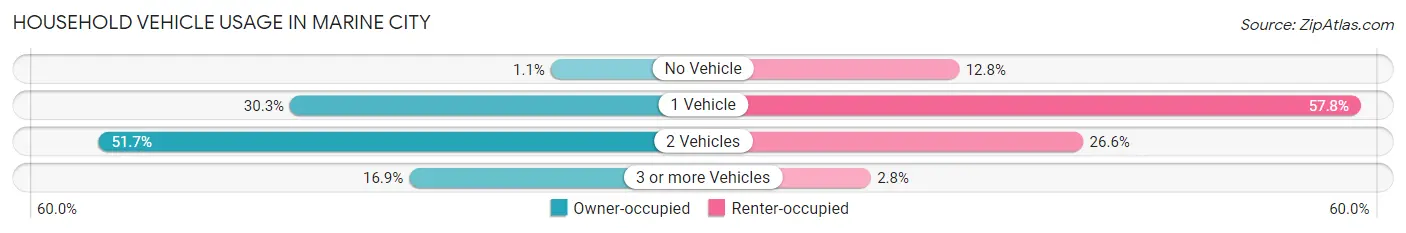
| Vehicles per Household | Owner-occupied | Renter-occupied |
| No Vehicle | 17 (1.1%) | 45 (12.8%) |
| 1 Vehicle | 483 (30.3%) | 204 (57.8%) |
| 2 Vehicles | 825 (51.7%) | 94 (26.6%) |
| 3 or more Vehicles | 270 (16.9%) | 10 (2.8%) |
| Total | 1,595 (100.0%) | 353 (100.0%) |
Real Estate & Mortgages in Marine City
Real Estate and Mortgage Overview in Marine City
| Characteristic | Without Mortgage | With Mortgage |
| Housing Units | 582 | 1,013 |
| Median Property Value | $147,100 | $138,300 |
| Median Household Income | $71,288 | $201 |
| Monthly Housing Costs | $460 | $0 |
| Real Estate Taxes | $2,443 | $58 |
Property Value by Mortgage Status in Marine City
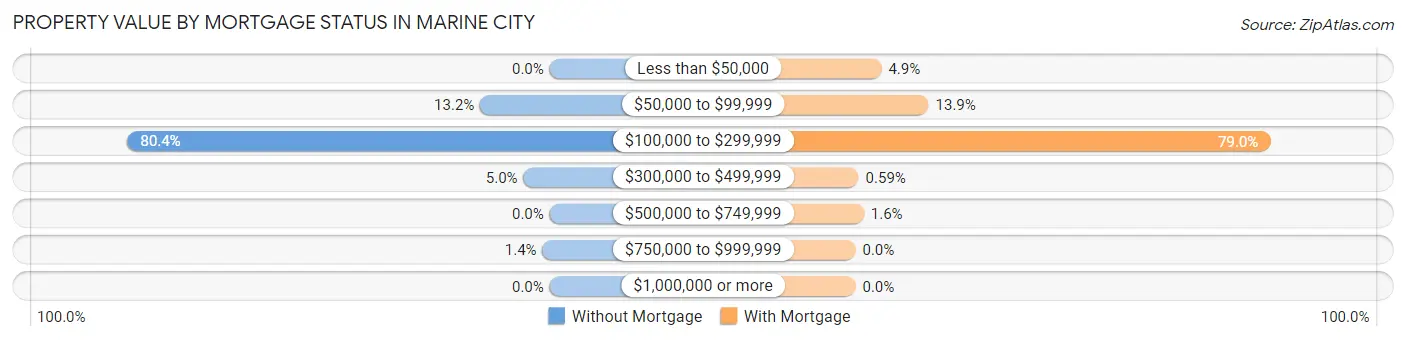
| Property Value | Without Mortgage | With Mortgage |
| Less than $50,000 | 0 (0.0%) | 50 (4.9%) |
| $50,000 to $99,999 | 77 (13.2%) | 141 (13.9%) |
| $100,000 to $299,999 | 468 (80.4%) | 800 (79.0%) |
| $300,000 to $499,999 | 29 (5.0%) | 6 (0.6%) |
| $500,000 to $749,999 | 0 (0.0%) | 16 (1.6%) |
| $750,000 to $999,999 | 8 (1.4%) | 0 (0.0%) |
| $1,000,000 or more | 0 (0.0%) | 0 (0.0%) |
| Total | 582 (100.0%) | 1,013 (100.0%) |
Household Income by Mortgage Status in Marine City
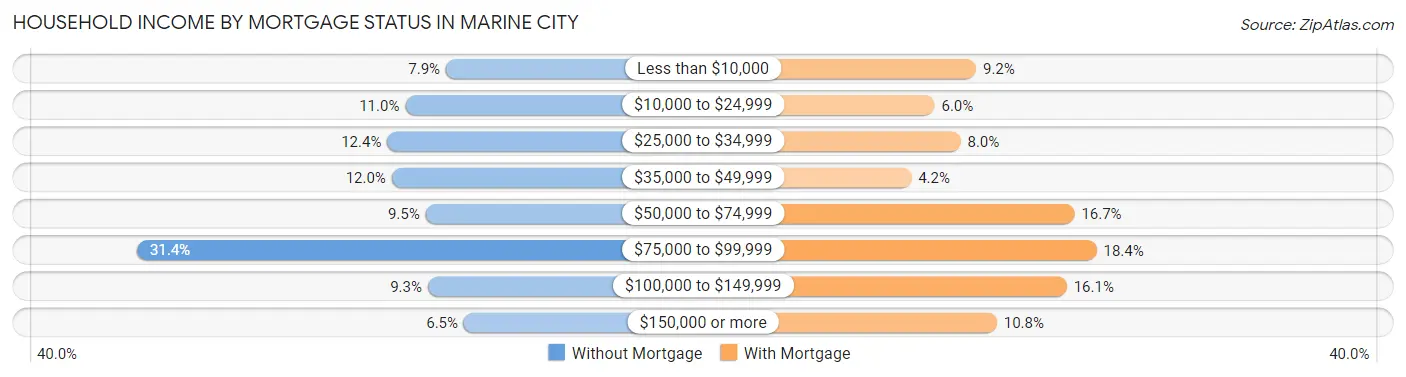
| Household Income | Without Mortgage | With Mortgage |
| Less than $10,000 | 46 (7.9%) | 93 (9.2%) |
| $10,000 to $24,999 | 64 (11.0%) | 61 (6.0%) |
| $25,000 to $34,999 | 72 (12.4%) | 81 (8.0%) |
| $35,000 to $49,999 | 70 (12.0%) | 43 (4.2%) |
| $50,000 to $74,999 | 55 (9.5%) | 169 (16.7%) |
| $75,000 to $99,999 | 183 (31.4%) | 186 (18.4%) |
| $100,000 to $149,999 | 54 (9.3%) | 163 (16.1%) |
| $150,000 or more | 38 (6.5%) | 109 (10.8%) |
| Total | 582 (100.0%) | 1,013 (100.0%) |
Property Value to Household Income Ratio in Marine City
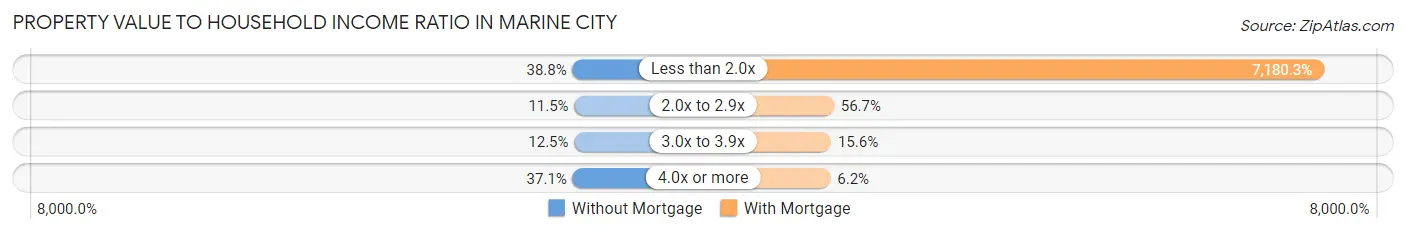
| Value-to-Income Ratio | Without Mortgage | With Mortgage |
| Less than 2.0x | 226 (38.8%) | 72,736 (7,180.3%) |
| 2.0x to 2.9x | 67 (11.5%) | 574 (56.7%) |
| 3.0x to 3.9x | 73 (12.5%) | 158 (15.6%) |
| 4.0x or more | 216 (37.1%) | 63 (6.2%) |
| Total | 582 (100.0%) | 1,013 (100.0%) |
Real Estate Taxes by Mortgage Status in Marine City
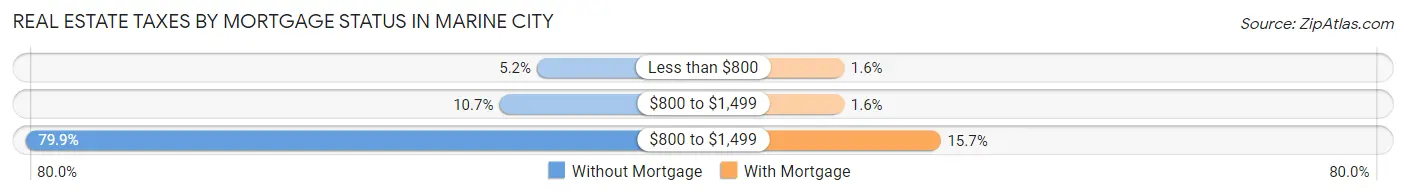
| Property Taxes | Without Mortgage | With Mortgage |
| Less than $800 | 30 (5.1%) | 16 (1.6%) |
| $800 to $1,499 | 62 (10.6%) | 16 (1.6%) |
| $800 to $1,499 | 465 (79.9%) | 159 (15.7%) |
| Total | 582 (100.0%) | 1,013 (100.0%) |
Health & Disability in Marine City
Health Insurance Coverage by Age in Marine City
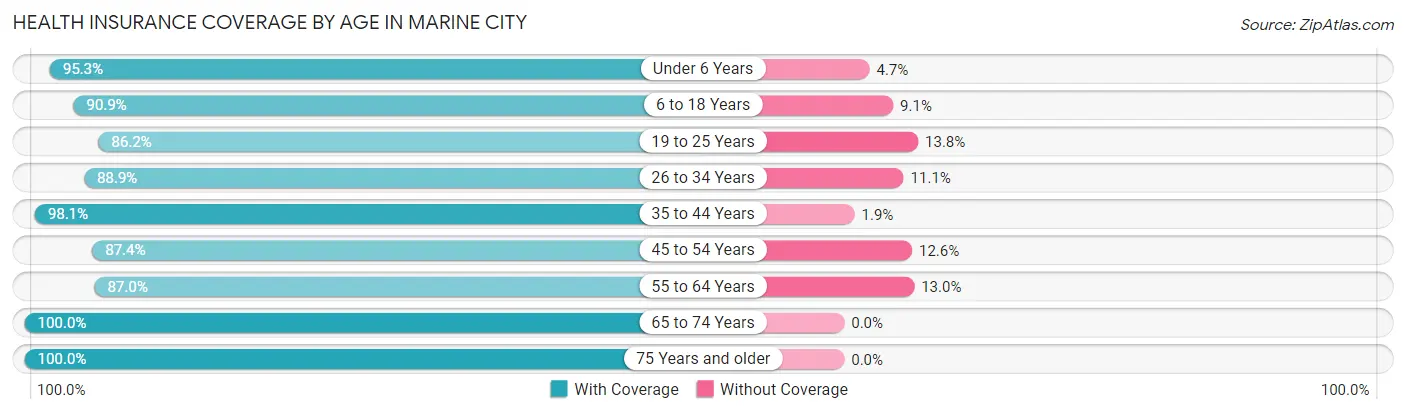
| Age Bracket | With Coverage | Without Coverage |
| Under 6 Years | 182 (95.3%) | 9 (4.7%) |
| 6 to 18 Years | 459 (90.9%) | 46 (9.1%) |
| 19 to 25 Years | 213 (86.2%) | 34 (13.8%) |
| 26 to 34 Years | 273 (88.9%) | 34 (11.1%) |
| 35 to 44 Years | 460 (98.1%) | 9 (1.9%) |
| 45 to 54 Years | 588 (87.4%) | 85 (12.6%) |
| 55 to 64 Years | 527 (87.0%) | 79 (13.0%) |
| 65 to 74 Years | 760 (100.0%) | 0 (0.0%) |
| 75 Years and older | 301 (100.0%) | 0 (0.0%) |
| Total | 3,763 (92.7%) | 296 (7.3%) |
Health Insurance Coverage by Citizenship Status in Marine City
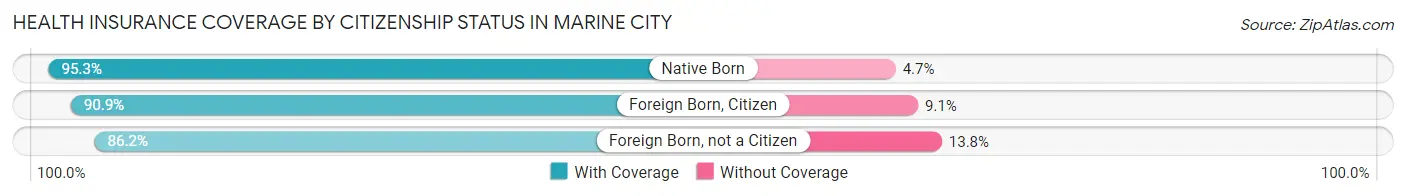
| Citizenship Status | With Coverage | Without Coverage |
| Native Born | 182 (95.3%) | 9 (4.7%) |
| Foreign Born, Citizen | 459 (90.9%) | 46 (9.1%) |
| Foreign Born, not a Citizen | 213 (86.2%) | 34 (13.8%) |
Health Insurance Coverage by Household Income in Marine City
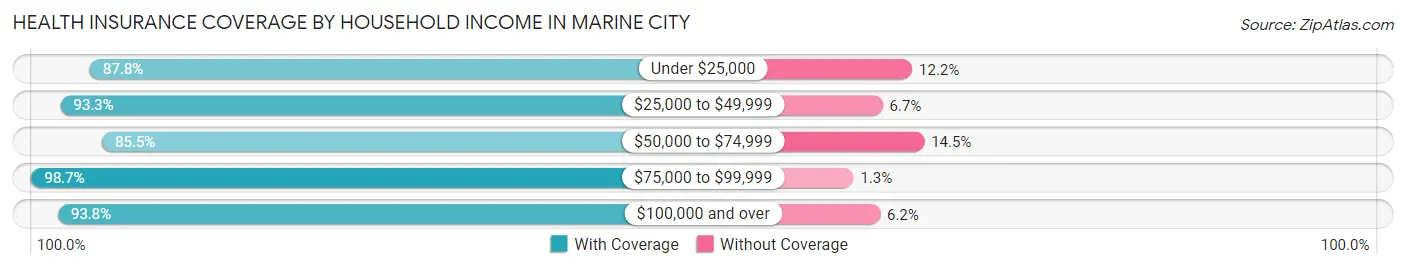
| Household Income | With Coverage | Without Coverage |
| Under $25,000 | 459 (87.8%) | 64 (12.2%) |
| $25,000 to $49,999 | 765 (93.3%) | 55 (6.7%) |
| $50,000 to $74,999 | 572 (85.5%) | 97 (14.5%) |
| $75,000 to $99,999 | 944 (98.7%) | 12 (1.3%) |
| $100,000 and over | 1,023 (93.8%) | 68 (6.2%) |
Public vs Private Health Insurance Coverage by Age in Marine City
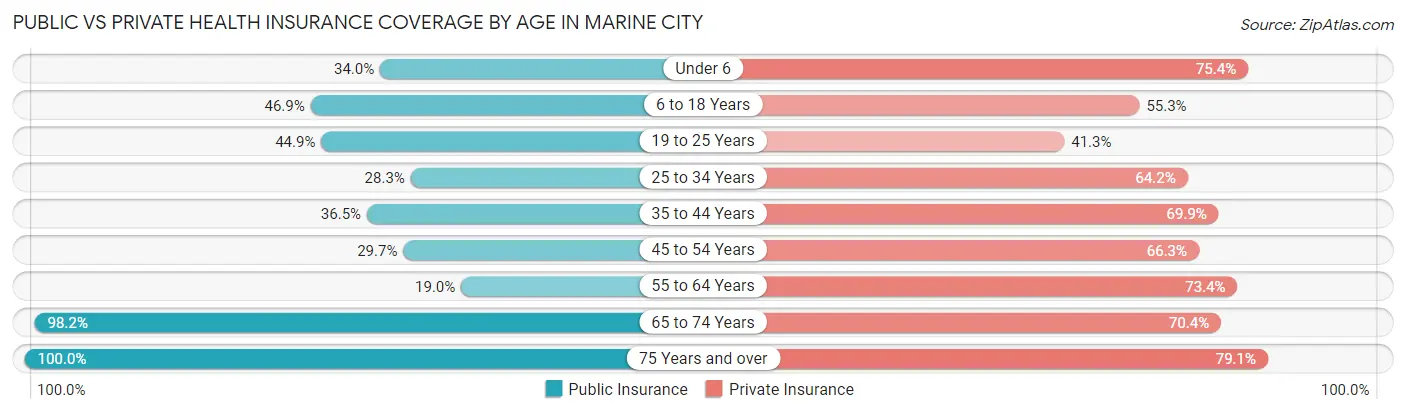
| Age Bracket | Public Insurance | Private Insurance |
| Under 6 | 65 (34.0%) | 144 (75.4%) |
| 6 to 18 Years | 237 (46.9%) | 279 (55.2%) |
| 19 to 25 Years | 111 (44.9%) | 102 (41.3%) |
| 25 to 34 Years | 87 (28.3%) | 197 (64.2%) |
| 35 to 44 Years | 171 (36.5%) | 328 (69.9%) |
| 45 to 54 Years | 200 (29.7%) | 446 (66.3%) |
| 55 to 64 Years | 115 (19.0%) | 445 (73.4%) |
| 65 to 74 Years | 746 (98.2%) | 535 (70.4%) |
| 75 Years and over | 301 (100.0%) | 238 (79.1%) |
| Total | 2,033 (50.1%) | 2,714 (66.9%) |
Disability Status by Sex by Age in Marine City
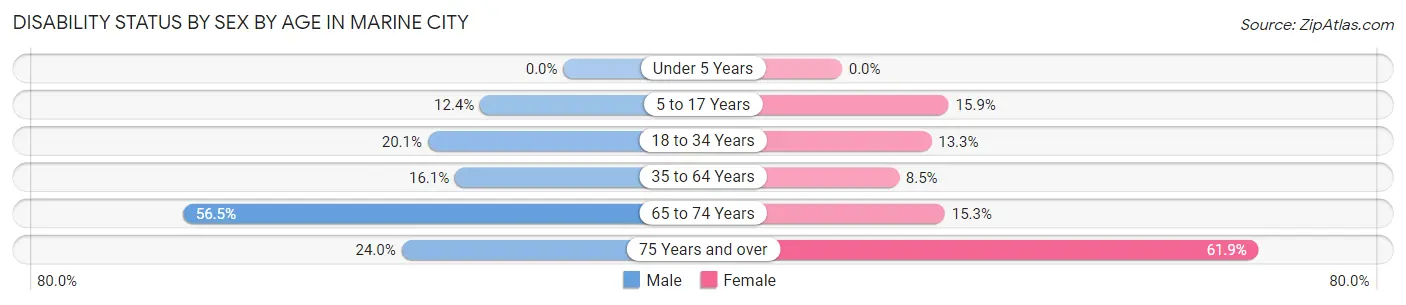
| Age Bracket | Male | Female |
| Under 5 Years | 0 (0.0%) | 0 (0.0%) |
| 5 to 17 Years | 22 (12.4%) | 43 (15.9%) |
| 18 to 34 Years | 64 (20.1%) | 40 (13.3%) |
| 35 to 64 Years | 150 (16.1%) | 69 (8.5%) |
| 65 to 74 Years | 230 (56.5%) | 54 (15.3%) |
| 75 Years and over | 37 (24.0%) | 91 (61.9%) |
Disability Class by Sex by Age in Marine City
Disability Class: Hearing Difficulty
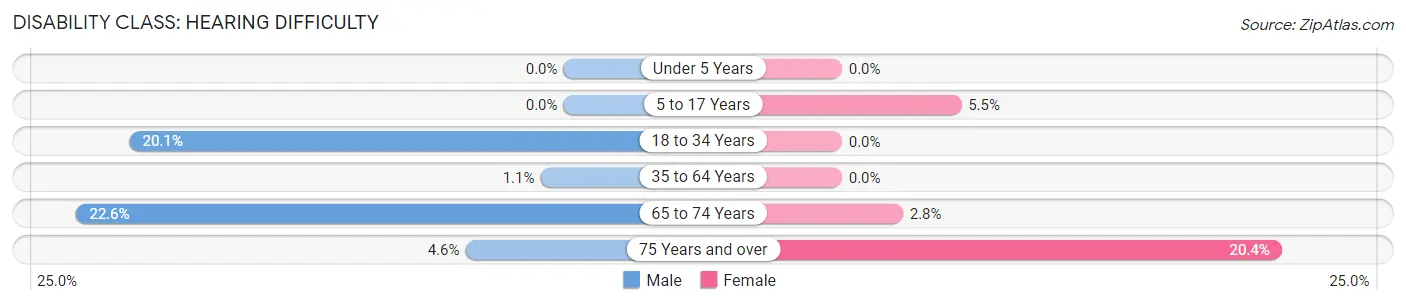
| Age Bracket | Male | Female |
| Under 5 Years | 0 (0.0%) | 0 (0.0%) |
| 5 to 17 Years | 0 (0.0%) | 15 (5.5%) |
| 18 to 34 Years | 64 (20.1%) | 0 (0.0%) |
| 35 to 64 Years | 10 (1.1%) | 0 (0.0%) |
| 65 to 74 Years | 92 (22.6%) | 10 (2.8%) |
| 75 Years and over | 7 (4.5%) | 30 (20.4%) |
Disability Class: Vision Difficulty
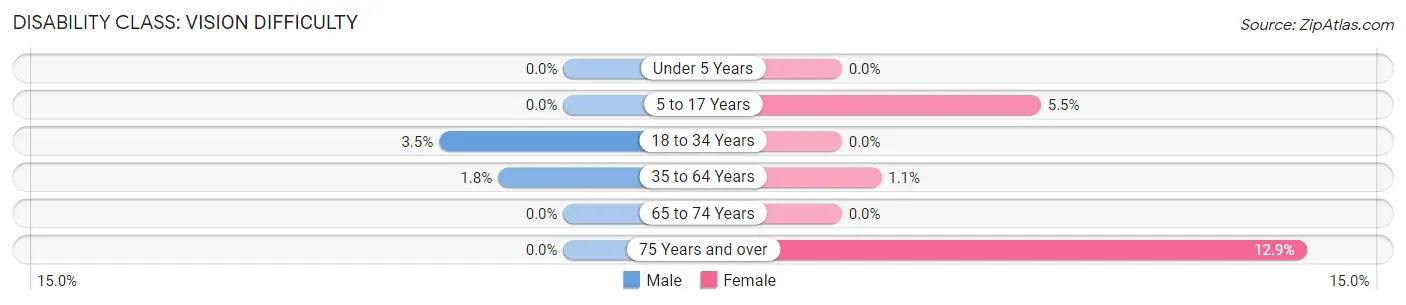
| Age Bracket | Male | Female |
| Under 5 Years | 0 (0.0%) | 0 (0.0%) |
| 5 to 17 Years | 0 (0.0%) | 15 (5.5%) |
| 18 to 34 Years | 11 (3.5%) | 0 (0.0%) |
| 35 to 64 Years | 17 (1.8%) | 9 (1.1%) |
| 65 to 74 Years | 0 (0.0%) | 0 (0.0%) |
| 75 Years and over | 0 (0.0%) | 19 (12.9%) |
Disability Class: Cognitive Difficulty
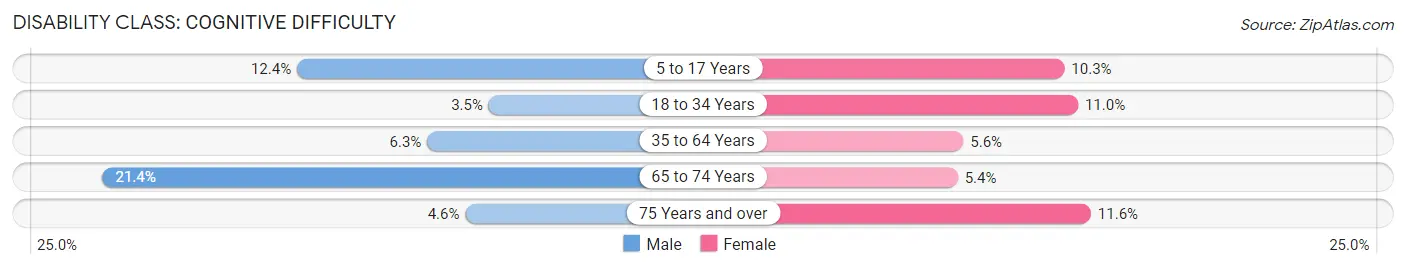
| Age Bracket | Male | Female |
| 5 to 17 Years | 22 (12.4%) | 28 (10.3%) |
| 18 to 34 Years | 11 (3.5%) | 33 (11.0%) |
| 35 to 64 Years | 59 (6.3%) | 46 (5.6%) |
| 65 to 74 Years | 87 (21.4%) | 19 (5.4%) |
| 75 Years and over | 7 (4.5%) | 17 (11.6%) |
Disability Class: Ambulatory Difficulty
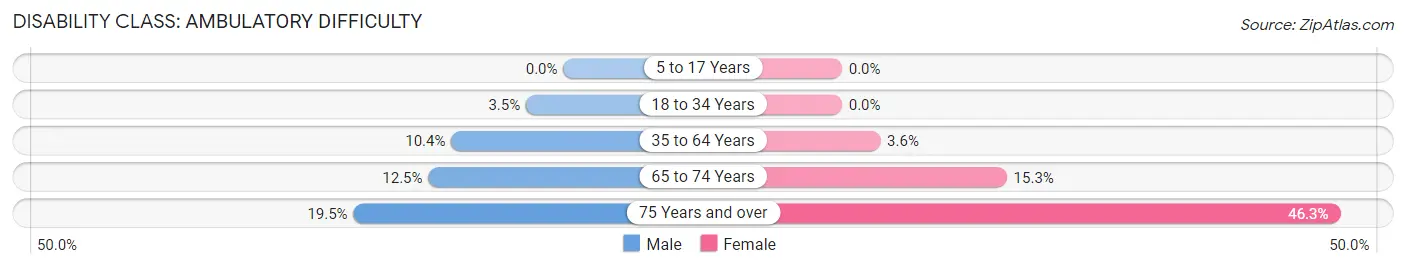
| Age Bracket | Male | Female |
| 5 to 17 Years | 0 (0.0%) | 0 (0.0%) |
| 18 to 34 Years | 11 (3.5%) | 0 (0.0%) |
| 35 to 64 Years | 97 (10.4%) | 29 (3.6%) |
| 65 to 74 Years | 51 (12.5%) | 54 (15.3%) |
| 75 Years and over | 30 (19.5%) | 68 (46.3%) |
Disability Class: Self-Care Difficulty
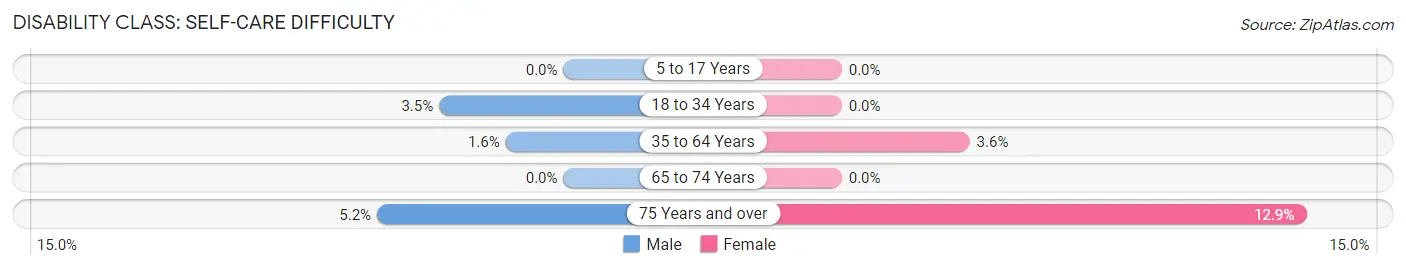
| Age Bracket | Male | Female |
| 5 to 17 Years | 0 (0.0%) | 0 (0.0%) |
| 18 to 34 Years | 11 (3.5%) | 0 (0.0%) |
| 35 to 64 Years | 15 (1.6%) | 29 (3.6%) |
| 65 to 74 Years | 0 (0.0%) | 0 (0.0%) |
| 75 Years and over | 8 (5.2%) | 19 (12.9%) |
Technology Access in Marine City
Computing Device Access in Marine City
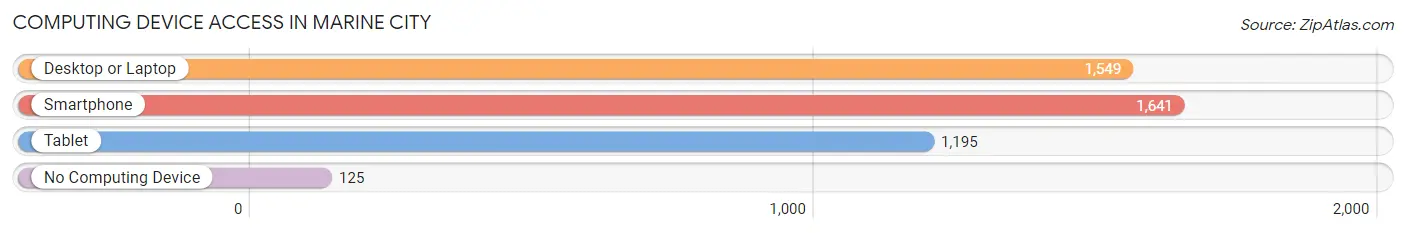
| Device Type | # Households | % Households |
| Desktop or Laptop | 1,549 | 79.5% |
| Smartphone | 1,641 | 84.2% |
| Tablet | 1,195 | 61.3% |
| No Computing Device | 125 | 6.4% |
| Total | 1,948 | 100.0% |
Internet Access in Marine City
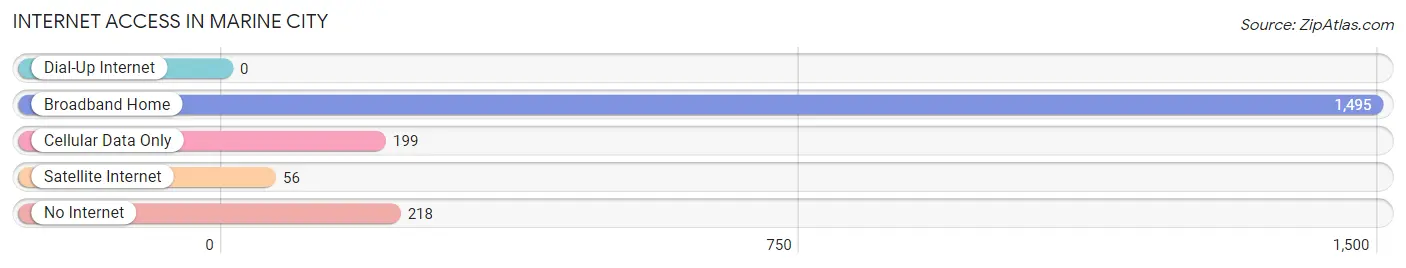
| Internet Type | # Households | % Households |
| Dial-Up Internet | 0 | 0.0% |
| Broadband Home | 1,495 | 76.7% |
| Cellular Data Only | 199 | 10.2% |
| Satellite Internet | 56 | 2.9% |
| No Internet | 218 | 11.2% |
| Total | 1,948 | 100.0% |
Marine City Summary
Marine City is a city located in St. Clair County, Michigan, United States. The population was 4,248 at the 2010 census. It is located along the St. Clair River and is part of the Thumb region of Michigan.
History
Marine City was founded in 1837 by William and Mary Burtch, who were among the first settlers in the area. The city was originally known as Burtchville, but was later renamed Marine City in 1851. The name was chosen to reflect the city's location on the St. Clair River, which was a major shipping route for the Great Lakes.
The city was incorporated in 1867 and has since grown to become a major port city in the region. The city is home to several historic buildings, including the Marine City Opera House, which was built in 1891 and is now a popular tourist attraction.
Geography
Marine City is located at 42°44′N 82°37′W (42.735, -82.619). According to the United States Census Bureau, the city has a total area of 2.2 square miles (5.7 km2), of which 1.9 square miles (4.9 km2) is land and 0.3 square miles (0.8 km2) (13.64%) is water.
The city is located along the St. Clair River, which is a major shipping route for the Great Lakes. The city is also located near the mouth of the Belle River, which flows into the St. Clair River.
Economy
Marine City is a major port city in the region and is home to several industries, including manufacturing, shipping, and tourism. The city is home to several large companies, including the Marine City Shipbuilding Company, which builds and repairs ships for the Great Lakes. The city is also home to several smaller businesses, including restaurants, retail stores, and marinas.
The city is also home to several tourist attractions, including the Marine City Opera House, which was built in 1891 and is now a popular tourist attraction. The city also hosts several festivals throughout the year, including the Marine City Music Festival and the Marine City Art Festival.
Demographics
As of the census of 2010, there were 4,248 people, 1,845 households, and 1,093 families residing in the city. The population density was 2,220.2 people per square mile (857.2/km2). There were 2,039 housing units at an average density of 1,072.2 per square mile (414.7/km2). The racial makeup of the city was 95.2% White, 0.7% African American, 0.4% Native American, 0.7% Asian, 0.1% Pacific Islander, 0.9% from other races, and 2.0% from two or more races. Hispanic or Latino of any race were 3.2% of the population.
There were 1,845 households, out of which 25.2% had children under the age of 18 living with them, 41.2% were married couples living together, 13.2% had a female householder with no husband present, and 40.7% were non-families. 34.2% of all households were made up of individuals, and 14.2% had someone living alone who was 65 years of age or older. The average household size was 2.27 and the average family size was 2.90.
In the city, the population was spread out, with 22.2% under the age of 18, 8.2% from 18 to 24, 27.2% from 25 to 44, 25.2% from 45 to 64, and 17.2% who were 65 years of age or older. The median age was 39 years. For every 100 females, there were 91.2 males. For every 100 females age 18 and over, there were 88.2 males.
The median income for a household in the city was $35,938, and the median income for a family was $45,000. Males had a median income of $35,000 versus $25,000 for females. The per capita income for the city was $19,845. About 8.2% of families and 11.2% of the population were below the poverty line, including 15.2% of those under age 18 and 8.2% of those age 65 or over.
Common Questions
What is Per Capita Income in Marine City?
Per Capita income in Marine City is $35,498.
What is the Median Family Income in Marine City?
Median Family Income in Marine City is $78,571.
What is the Median Household income in Marine City?
Median Household Income in Marine City is $61,270.
What is Income or Wage Gap in Marine City?
Income or Wage Gap in Marine City is 68.9%.
Women in Marine City earn 31.1 cents for every dollar earned by a man.
What is Inequality or Gini Index in Marine City?
Inequality or Gini Index in Marine City is 0.39.
What is the Total Population of Marine City?
Total Population of Marine City is 4,068.
What is the Total Male Population of Marine City?
Total Male Population of Marine City is 2,061.
What is the Total Female Population of Marine City?
Total Female Population of Marine City is 2,007.
What is the Ratio of Males per 100 Females in Marine City?
There are 102.69 Males per 100 Females in Marine City.
What is the Ratio of Females per 100 Males in Marine City?
There are 97.38 Females per 100 Males in Marine City.
What is the Median Population Age in Marine City?
Median Population Age in Marine City is 49.5 Years.
What is the Average Family Size in Marine City
Average Family Size in Marine City is 2.7 People.
What is the Average Household Size in Marine City
Average Household Size in Marine City is 2.1 People.
How Large is the Labor Force in Marine City?
There are 2,185 People in the Labor Forcein in Marine City.
What is the Percentage of People in the Labor Force in Marine City?
62.0% of People are in the Labor Force in Marine City.
What is the Unemployment Rate in Marine City?
Unemployment Rate in Marine City is 8.4%.