White Pine, MI Map & Demographics
White Pine Map
White Pine Overview
$25,877
PER CAPITA INCOME
$53,125
AVG FAMILY INCOME
$44,602
AVG HOUSEHOLD INCOME
0.1%
WAGE / INCOME GAP [ % ]
99.9¢/ $1
WAGE / INCOME GAP [ $ ]
0.37
INEQUALITY / GINI INDEX
415
TOTAL POPULATION
211
MALE POPULATION
204
FEMALE POPULATION
103.43
MALES / 100 FEMALES
96.68
FEMALES / 100 MALES
62.3
MEDIAN AGE
2.5
AVG FAMILY SIZE
1.9
AVG HOUSEHOLD SIZE
119
LABOR FORCE [ PEOPLE ]
31.8%
PERCENT IN LABOR FORCE
0.8%
UNEMPLOYMENT RATE
White Pine Zip Codes
White Pine Area Codes
Income in White Pine
Income Overview in White Pine
Per Capita Income in White Pine is $25,877, while median incomes of families and households are $53,125 and $44,602 respectively.
| Characteristic | Number | Measure |
| Per Capita Income | 415 | $25,877 |
| Median Family Income | 121 | $53,125 |
| Mean Family Income | 121 | $58,308 |
| Median Household Income | 215 | $44,602 |
| Mean Household Income | 215 | $49,857 |
| Income Deficit | 121 | $0 |
| Wage / Income Gap (%) | 415 | 0.13% |
| Wage / Income Gap ($) | 415 | 99.87¢ per $1 |
| Gini / Inequality Index | 415 | 0.37 |
Earnings by Sex in White Pine
Average Earnings in White Pine are $27,788, $27,813 for men and $27,778 for women, a difference of 0.1%.
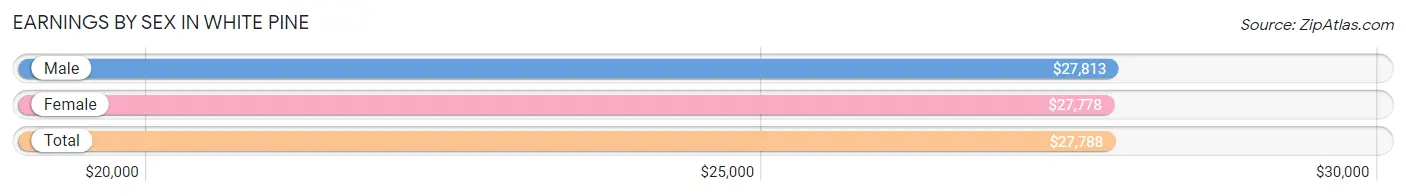
| Sex | Number | Average Earnings |
| Male | 71 (56.8%) | $27,813 |
| Female | 54 (43.2%) | $27,778 |
| Total | 125 (100.0%) | $27,788 |
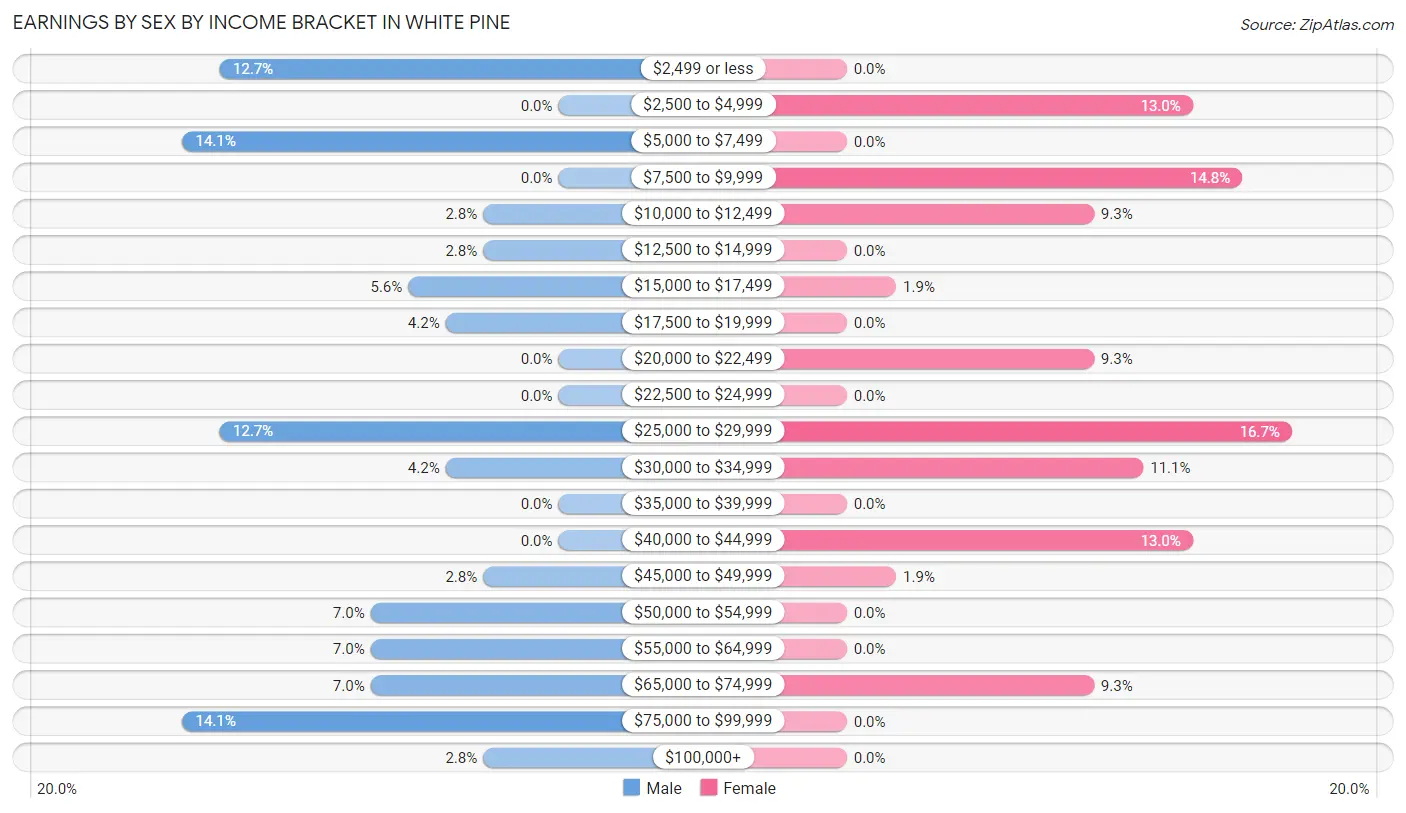
Earnings by Sex by Income Bracket in White Pine
The most common earnings brackets in White Pine are $5,000 to $7,499 for men (10 | 14.1%) and $25,000 to $29,999 for women (9 | 16.7%).
| Income | Male | Female |
| $2,499 or less | 9 (12.7%) | 0 (0.0%) |
| $2,500 to $4,999 | 0 (0.0%) | 7 (13.0%) |
| $5,000 to $7,499 | 10 (14.1%) | 0 (0.0%) |
| $7,500 to $9,999 | 0 (0.0%) | 8 (14.8%) |
| $10,000 to $12,499 | 2 (2.8%) | 5 (9.3%) |
| $12,500 to $14,999 | 2 (2.8%) | 0 (0.0%) |
| $15,000 to $17,499 | 4 (5.6%) | 1 (1.8%) |
| $17,500 to $19,999 | 3 (4.2%) | 0 (0.0%) |
| $20,000 to $22,499 | 0 (0.0%) | 5 (9.3%) |
| $22,500 to $24,999 | 0 (0.0%) | 0 (0.0%) |
| $25,000 to $29,999 | 9 (12.7%) | 9 (16.7%) |
| $30,000 to $34,999 | 3 (4.2%) | 6 (11.1%) |
| $35,000 to $39,999 | 0 (0.0%) | 0 (0.0%) |
| $40,000 to $44,999 | 0 (0.0%) | 7 (13.0%) |
| $45,000 to $49,999 | 2 (2.8%) | 1 (1.8%) |
| $50,000 to $54,999 | 5 (7.0%) | 0 (0.0%) |
| $55,000 to $64,999 | 5 (7.0%) | 0 (0.0%) |
| $65,000 to $74,999 | 5 (7.0%) | 5 (9.3%) |
| $75,000 to $99,999 | 10 (14.1%) | 0 (0.0%) |
| $100,000+ | 2 (2.8%) | 0 (0.0%) |
| Total | 71 (100.0%) | 54 (100.0%) |
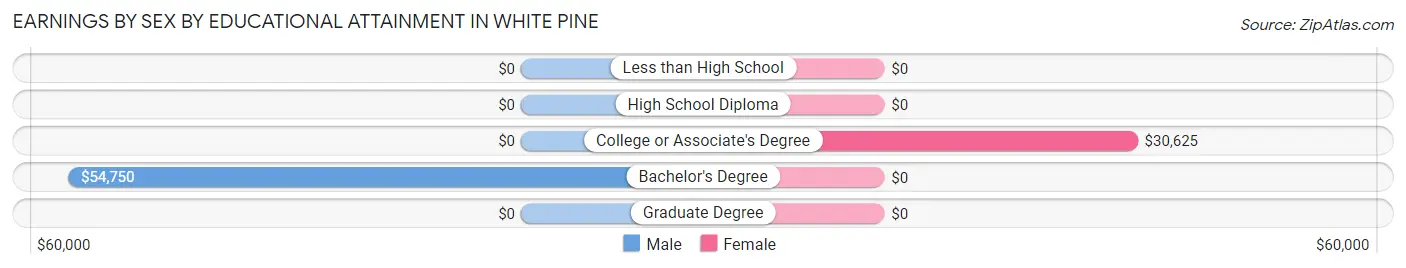
Earnings by Sex by Educational Attainment in White Pine
Average earnings in White Pine are $30,000 for men and $29,444 for women, a difference of 1.8%. Men with an educational attainment of bachelor's degree enjoy the highest average annual earnings of $54,750, while those with bachelor's degree education earn the least with $54,750. Women with an educational attainment of college or associate's degree earn the most with the average annual earnings of $30,625, while those with college or associate's degree education have the smallest earnings of $30,625.
| Educational Attainment | Male Income | Female Income |
| Less than High School | - | - |
| High School Diploma | - | - |
| College or Associate's Degree | - | - |
| Bachelor's Degree | $54,750 | $0 |
| Graduate Degree | - | - |
| Total | $30,000 | $29,444 |
Family Income in White Pine
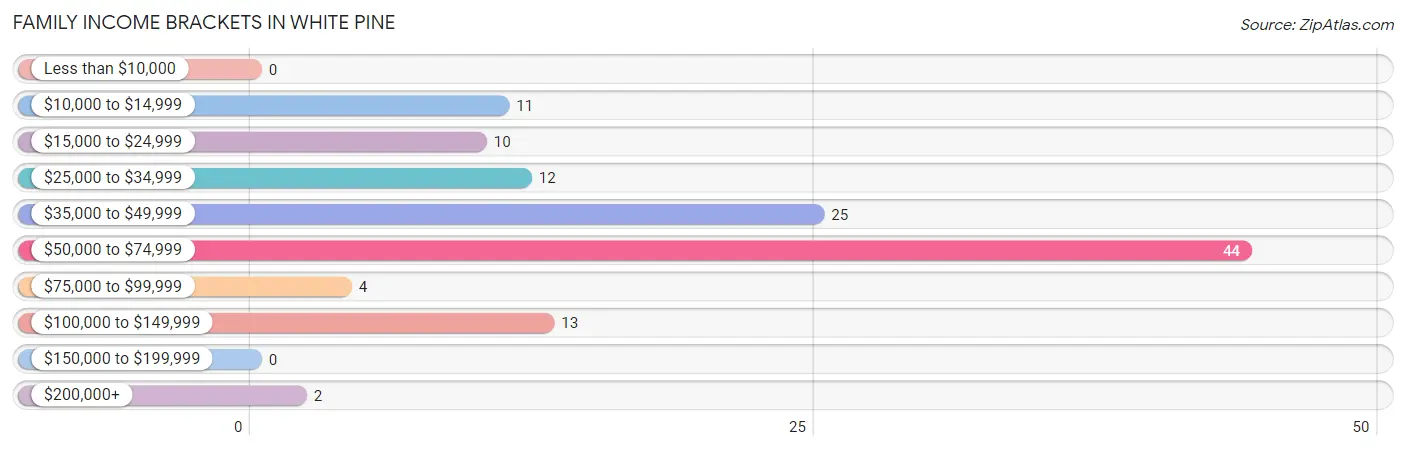
Family Income Brackets in White Pine
According to the White Pine family income data, there are 44 families falling into the $50,000 to $74,999 income range, which is the most common income bracket and makes up 36.4% of all families.
| Income Bracket | # Families | % Families |
| Less than $10,000 | 0 | 0.0% |
| $10,000 to $14,999 | 11 | 9.1% |
| $15,000 to $24,999 | 10 | 8.3% |
| $25,000 to $34,999 | 12 | 9.9% |
| $35,000 to $49,999 | 25 | 20.7% |
| $50,000 to $74,999 | 44 | 36.4% |
| $75,000 to $99,999 | 4 | 3.3% |
| $100,000 to $149,999 | 13 | 10.7% |
| $150,000 to $199,999 | 0 | 0.0% |
| $200,000+ | 2 | 1.7% |
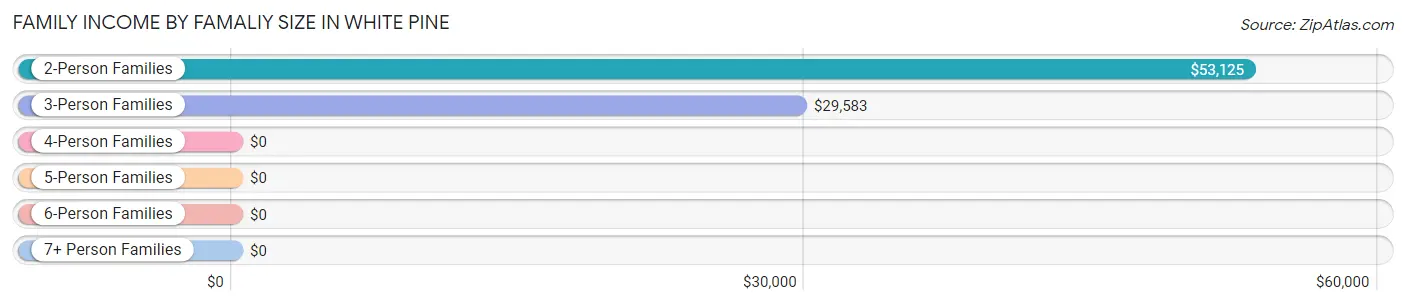
Family Income by Famaliy Size in White Pine
2-person families (99 | 81.8%) account for the highest median family income in White Pine with $53,125 per family, while 2-person families (99 | 81.8%) have the highest median income of $26,562 per family member.
| Income Bracket | # Families | Median Income |
| 2-Person Families | 99 (81.8%) | $53,125 |
| 3-Person Families | 13 (10.7%) | $29,583 |
| 4-Person Families | 7 (5.8%) | $0 |
| 5-Person Families | 0 (0.0%) | $0 |
| 6-Person Families | 0 (0.0%) | $0 |
| 7+ Person Families | 2 (1.7%) | $0 |
| Total | 121 (100.0%) | $53,125 |
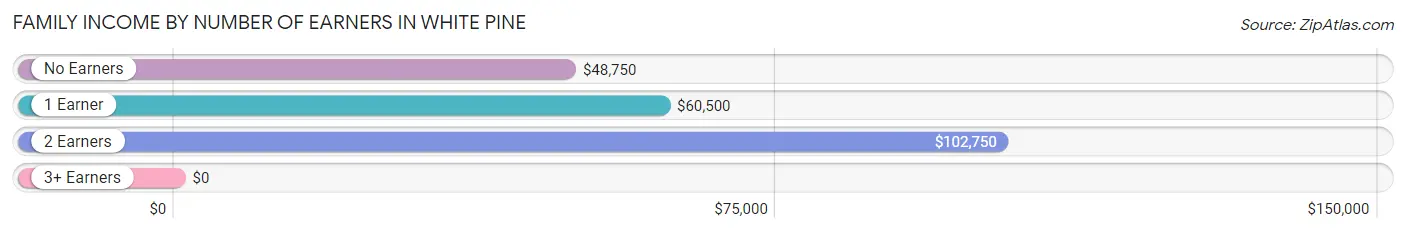
Family Income by Number of Earners in White Pine
| Number of Earners | # Families | Median Income |
| No Earners | 66 (54.5%) | $48,750 |
| 1 Earner | 36 (29.7%) | $60,500 |
| 2 Earners | 17 (14.1%) | $102,750 |
| 3+ Earners | 2 (1.7%) | $0 |
| Total | 121 (100.0%) | $53,125 |
Household Income in White Pine
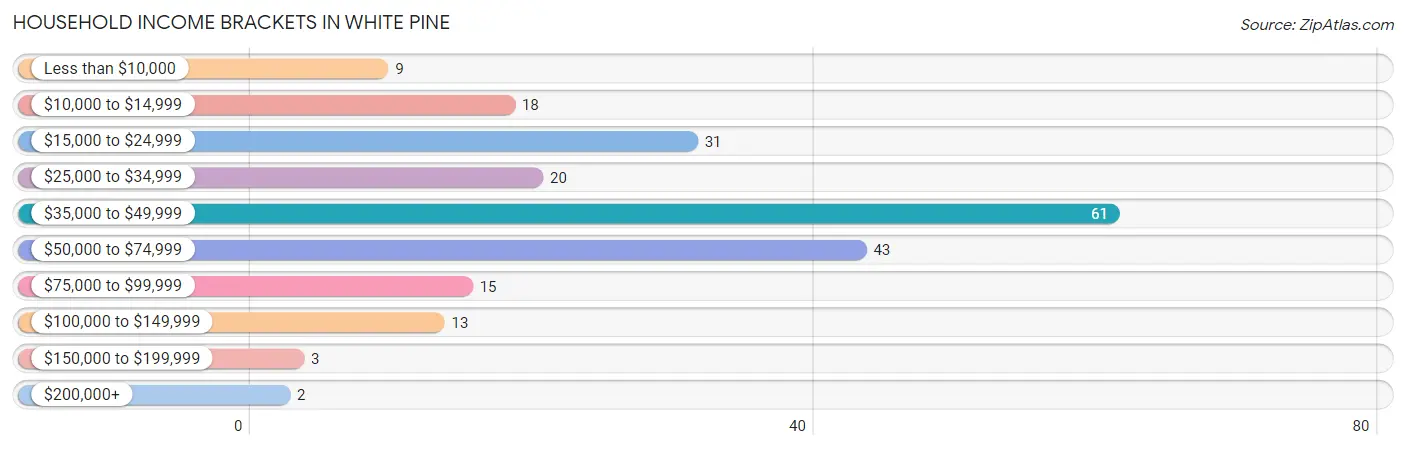
Household Income Brackets in White Pine
With 61 households falling in the category, the $35,000 to $49,999 income range is the most frequent in White Pine, accounting for 28.4% of all households. In contrast, only 2 households (0.9%) fall into the $200,000+ income bracket, making it the least populous group.
| Income Bracket | # Households | % Households |
| Less than $10,000 | 9 | 4.2% |
| $10,000 to $14,999 | 18 | 8.4% |
| $15,000 to $24,999 | 31 | 14.4% |
| $25,000 to $34,999 | 20 | 9.3% |
| $35,000 to $49,999 | 61 | 28.4% |
| $50,000 to $74,999 | 43 | 20.0% |
| $75,000 to $99,999 | 15 | 7.0% |
| $100,000 to $149,999 | 13 | 6.0% |
| $150,000 to $199,999 | 3 | 1.4% |
| $200,000+ | 2 | 0.9% |
Household Income by Householder Age in White Pine
The median household income in White Pine is $44,602, with the highest median household income of $46,000 found in the 65+ years age bracket for the primary householder. A total of 102 households (47.4%) fall into this category.
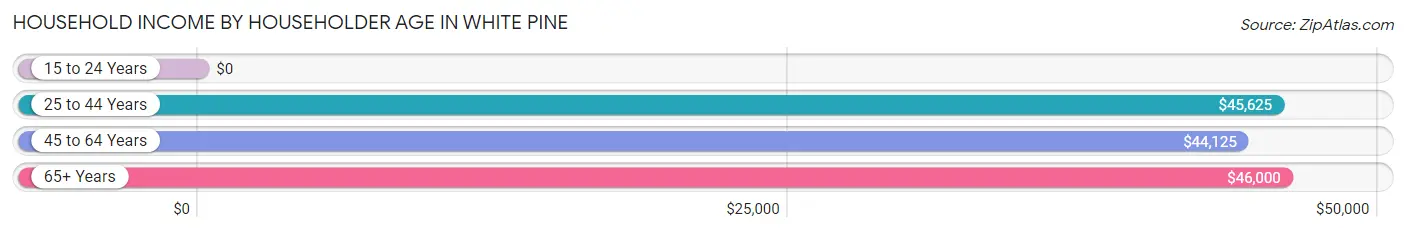
| Income Bracket | # Households | Median Income |
| 15 to 24 Years | 0 (0.0%) | $0 |
| 25 to 44 Years | 25 (11.6%) | $45,625 |
| 45 to 64 Years | 88 (40.9%) | $44,125 |
| 65+ Years | 102 (47.4%) | $46,000 |
| Total | 215 (100.0%) | $44,602 |
Poverty in White Pine
Income Below Poverty by Sex and Age in White Pine
With 9.0% poverty level for males and 24.5% for females among the residents of White Pine, 25 to 34 year old males and 18 to 24 year old females are the most vulnerable to poverty, with 4 males (44.4%) and 8 females (47.1%) in their respective age groups living below the poverty level.
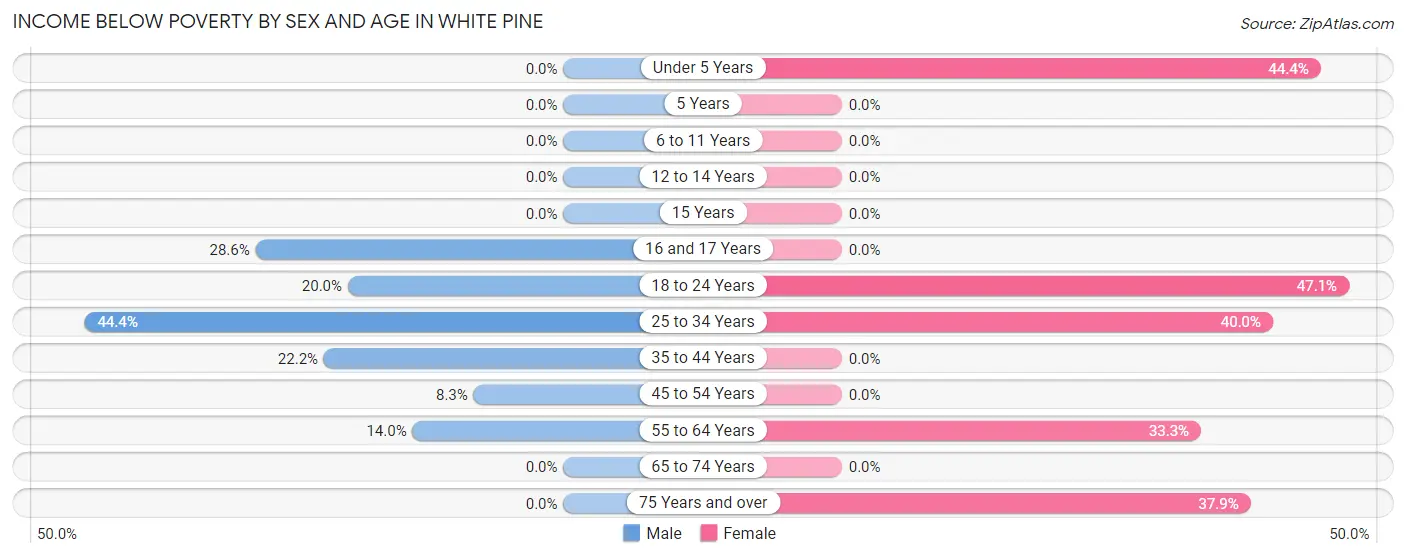
| Age Bracket | Male | Female |
| Under 5 Years | 0 (0.0%) | 8 (44.4%) |
| 5 Years | 0 (0.0%) | 0 (0.0%) |
| 6 to 11 Years | 0 (0.0%) | 0 (0.0%) |
| 12 to 14 Years | 0 (0.0%) | 0 (0.0%) |
| 15 Years | 0 (0.0%) | 0 (0.0%) |
| 16 and 17 Years | 2 (28.6%) | 0 (0.0%) |
| 18 to 24 Years | 2 (20.0%) | 8 (47.1%) |
| 25 to 34 Years | 4 (44.4%) | 8 (40.0%) |
| 35 to 44 Years | 2 (22.2%) | 0 (0.0%) |
| 45 to 54 Years | 2 (8.3%) | 0 (0.0%) |
| 55 to 64 Years | 7 (14.0%) | 15 (33.3%) |
| 65 to 74 Years | 0 (0.0%) | 0 (0.0%) |
| 75 Years and over | 0 (0.0%) | 11 (37.9%) |
| Total | 19 (9.0%) | 50 (24.5%) |
Income Above Poverty by Sex and Age in White Pine
According to the poverty statistics in White Pine, males aged under 5 years and females aged 6 to 11 years are the age groups that are most secure financially, with 100.0% of males and 100.0% of females in these age groups living above the poverty line.
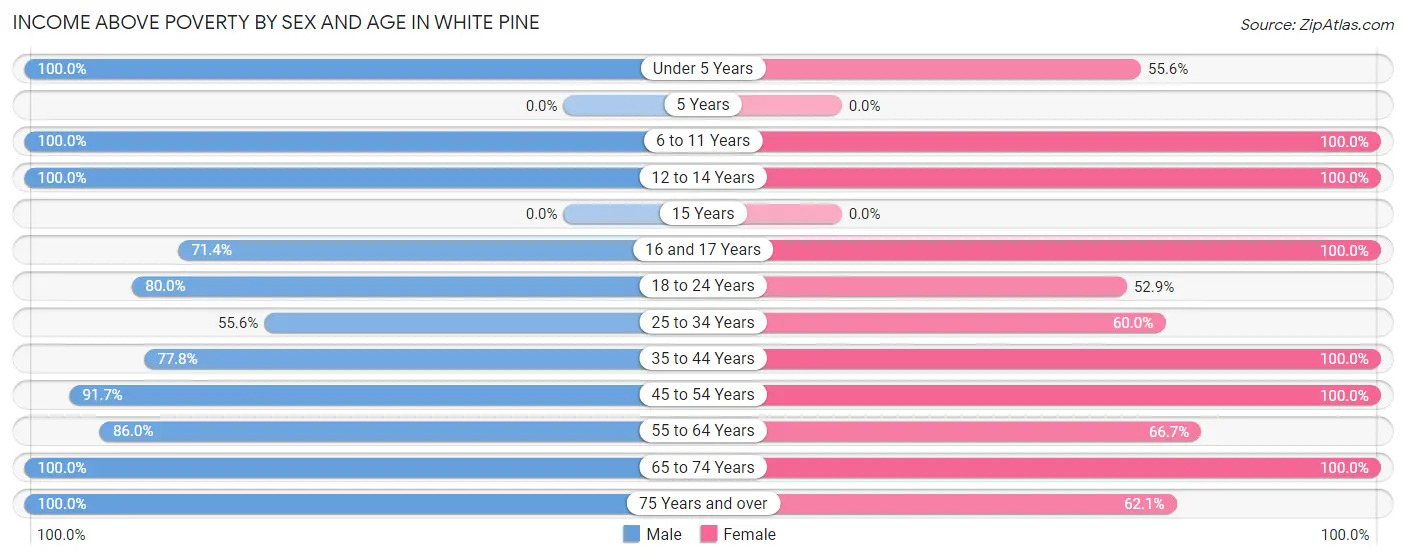
| Age Bracket | Male | Female |
| Under 5 Years | 10 (100.0%) | 10 (55.6%) |
| 5 Years | 0 (0.0%) | 0 (0.0%) |
| 6 to 11 Years | 2 (100.0%) | 6 (100.0%) |
| 12 to 14 Years | 2 (100.0%) | 3 (100.0%) |
| 15 Years | 0 (0.0%) | 0 (0.0%) |
| 16 and 17 Years | 5 (71.4%) | 2 (100.0%) |
| 18 to 24 Years | 8 (80.0%) | 9 (52.9%) |
| 25 to 34 Years | 5 (55.6%) | 12 (60.0%) |
| 35 to 44 Years | 7 (77.8%) | 3 (100.0%) |
| 45 to 54 Years | 22 (91.7%) | 16 (100.0%) |
| 55 to 64 Years | 43 (86.0%) | 30 (66.7%) |
| 65 to 74 Years | 51 (100.0%) | 45 (100.0%) |
| 75 Years and over | 37 (100.0%) | 18 (62.1%) |
| Total | 192 (91.0%) | 154 (75.5%) |
Income Below Poverty Among Married-Couple Families in White Pine
The poverty statistics for married-couple families in White Pine show that 4.4% or 4 of the total 91 families live below the poverty line. Families with 1 or 2 children have the highest poverty rate of 36.4%, comprising of 4 families. On the other hand, families with no children have the lowest poverty rate of 0.0%, which includes 0 families.
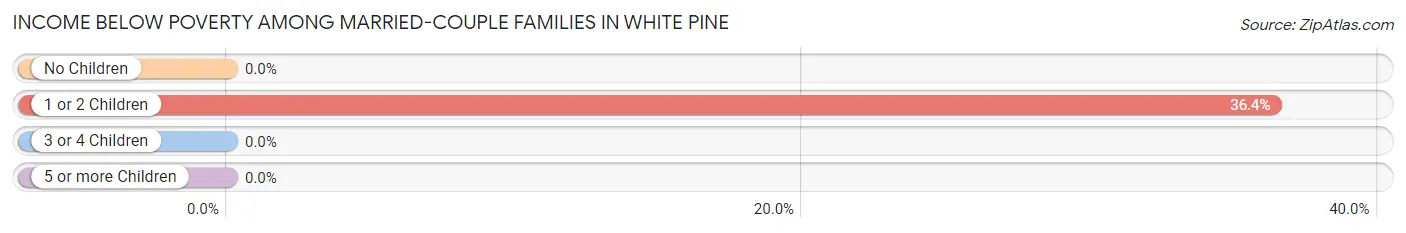
| Children | Above Poverty | Below Poverty |
| No Children | 80 (100.0%) | 0 (0.0%) |
| 1 or 2 Children | 7 (63.6%) | 4 (36.4%) |
| 3 or 4 Children | 0 (0.0%) | 0 (0.0%) |
| 5 or more Children | 0 (0.0%) | 0 (0.0%) |
| Total | 87 (95.6%) | 4 (4.4%) |
Income Below Poverty Among Single-Parent Households in White Pine
According to the poverty data in White Pine, 12.5% or 2 single-father households and 78.6% or 11 single-mother households are living below the poverty line. Among single-father households, those with 1 or 2 children have the highest poverty rate, with 2 households (50.0%) experiencing poverty. Likewise, among single-mother households, those with no children have the highest poverty rate, with 11 households (100.0%) falling below the poverty line.
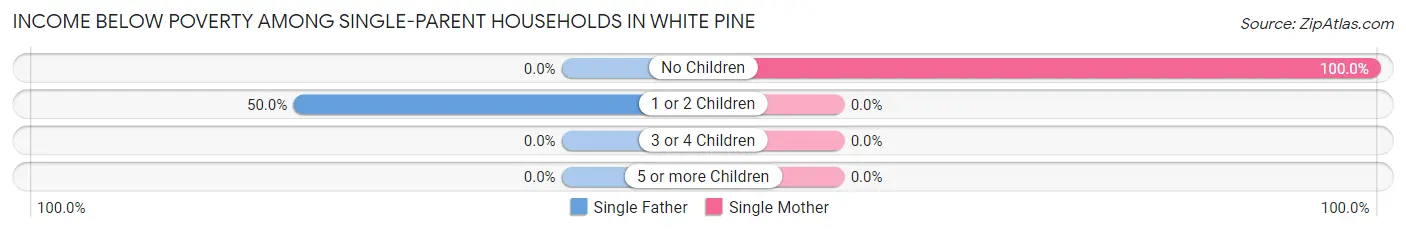
| Children | Single Father | Single Mother |
| No Children | 0 (0.0%) | 11 (100.0%) |
| 1 or 2 Children | 2 (50.0%) | 0 (0.0%) |
| 3 or 4 Children | 0 (0.0%) | 0 (0.0%) |
| 5 or more Children | 0 (0.0%) | 0 (0.0%) |
| Total | 2 (12.5%) | 11 (78.6%) |
Income Below Poverty Among Married-Couple vs Single-Parent Households in White Pine
The poverty data for White Pine shows that 4 of the married-couple family households (4.4%) and 13 of the single-parent households (43.3%) are living below the poverty level. Within the married-couple family households, those with 1 or 2 children have the highest poverty rate, with 4 households (36.4%) falling below the poverty line. Among the single-parent households, those with no children have the highest poverty rate, with 11 household (61.1%) living below poverty.
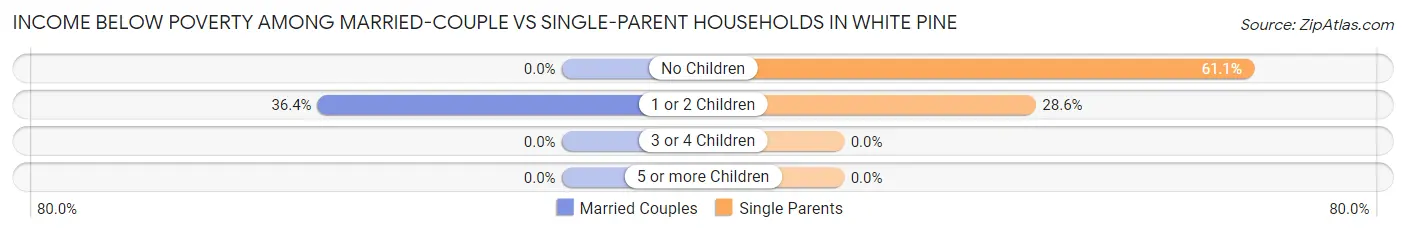
| Children | Married-Couple Families | Single-Parent Households |
| No Children | 0 (0.0%) | 11 (61.1%) |
| 1 or 2 Children | 4 (36.4%) | 2 (28.6%) |
| 3 or 4 Children | 0 (0.0%) | 0 (0.0%) |
| 5 or more Children | 0 (0.0%) | 0 (0.0%) |
| Total | 4 (4.4%) | 13 (43.3%) |
Race in White Pine
The most populous races in White Pine are White / Caucasian (394 | 94.9%), Two or more Races (13 | 3.1%), and Asian (6 | 1.5%).
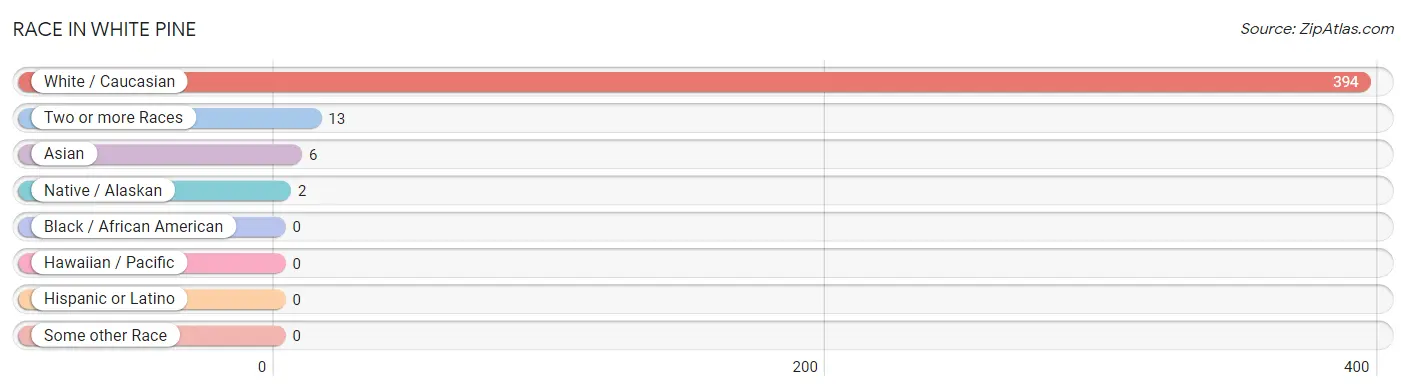
| Race | # Population | % Population |
| Asian | 6 | 1.5% |
| Black / African American | 0 | 0.0% |
| Hawaiian / Pacific | 0 | 0.0% |
| Hispanic or Latino | 0 | 0.0% |
| Native / Alaskan | 2 | 0.5% |
| White / Caucasian | 394 | 94.9% |
| Two or more Races | 13 | 3.1% |
| Some other Race | 0 | 0.0% |
| Total | 415 | 100.0% |
Ancestry in White Pine
The most populous ancestries reported in White Pine are German (104 | 25.1%), Irish (59 | 14.2%), English (58 | 14.0%), Finnish (55 | 13.3%), and Italian (40 | 9.6%), together accounting for 76.2% of all White Pine residents.
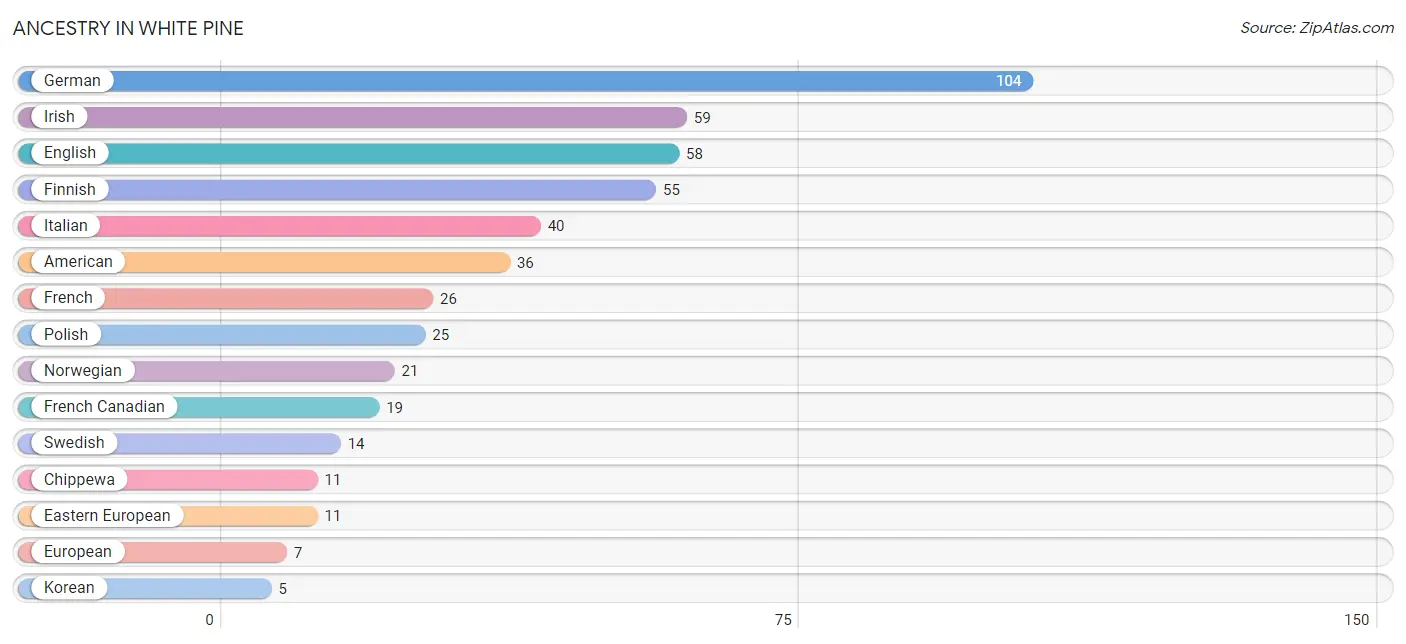
| Ancestry | # Population | % Population |
| American | 36 | 8.7% |
| Bhutanese | 1 | 0.2% |
| Chippewa | 11 | 2.6% |
| Danish | 2 | 0.5% |
| Eastern European | 11 | 2.6% |
| English | 58 | 14.0% |
| European | 7 | 1.7% |
| Finnish | 55 | 13.3% |
| French | 26 | 6.3% |
| French Canadian | 19 | 4.6% |
| German | 104 | 25.1% |
| Irish | 59 | 14.2% |
| Italian | 40 | 9.6% |
| Korean | 5 | 1.2% |
| Norwegian | 21 | 5.1% |
| Ottawa | 2 | 0.5% |
| Pennsylvania German | 2 | 0.5% |
| Polish | 25 | 6.0% |
| Russian | 3 | 0.7% |
| Scotch-Irish | 3 | 0.7% |
| Scottish | 3 | 0.7% |
| Swedish | 14 | 3.4% |
| Swiss | 2 | 0.5% | View All 23 Rows |
Immigrants in White Pine
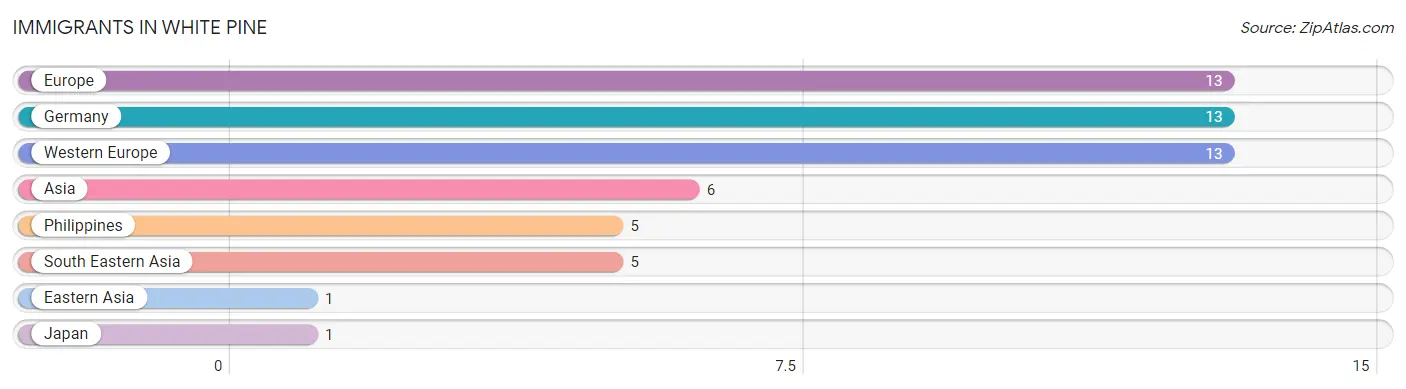
The most numerous immigrant groups reported in White Pine came from Europe (13 | 3.1%), Germany (13 | 3.1%), Western Europe (13 | 3.1%), Asia (6 | 1.5%), and Philippines (5 | 1.2%), together accounting for 12.0% of all White Pine residents.
| Immigration Origin | # Population | % Population |
| Asia | 6 | 1.5% |
| Eastern Asia | 1 | 0.2% |
| Europe | 13 | 3.1% |
| Germany | 13 | 3.1% |
| Japan | 1 | 0.2% |
| Philippines | 5 | 1.2% |
| South Eastern Asia | 5 | 1.2% |
| Western Europe | 13 | 3.1% | View All 8 Rows |
Sex and Age in White Pine
Sex and Age in White Pine
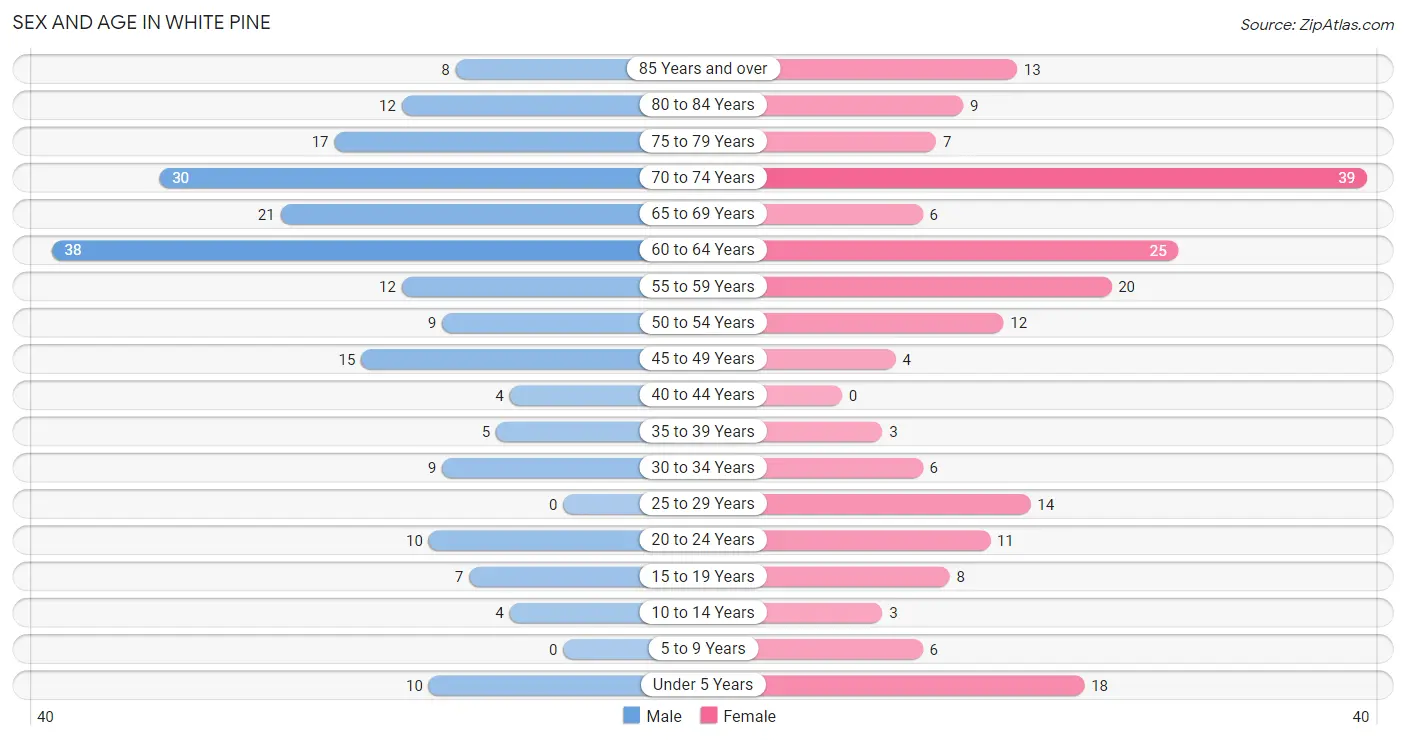
The most populous age groups in White Pine are 60 to 64 Years (38 | 18.0%) for men and 70 to 74 Years (39 | 19.1%) for women.
| Age Bracket | Male | Female |
| Under 5 Years | 10 (4.7%) | 18 (8.8%) |
| 5 to 9 Years | 0 (0.0%) | 6 (2.9%) |
| 10 to 14 Years | 4 (1.9%) | 3 (1.5%) |
| 15 to 19 Years | 7 (3.3%) | 8 (3.9%) |
| 20 to 24 Years | 10 (4.7%) | 11 (5.4%) |
| 25 to 29 Years | 0 (0.0%) | 14 (6.9%) |
| 30 to 34 Years | 9 (4.3%) | 6 (2.9%) |
| 35 to 39 Years | 5 (2.4%) | 3 (1.5%) |
| 40 to 44 Years | 4 (1.9%) | 0 (0.0%) |
| 45 to 49 Years | 15 (7.1%) | 4 (2.0%) |
| 50 to 54 Years | 9 (4.3%) | 12 (5.9%) |
| 55 to 59 Years | 12 (5.7%) | 20 (9.8%) |
| 60 to 64 Years | 38 (18.0%) | 25 (12.2%) |
| 65 to 69 Years | 21 (10.0%) | 6 (2.9%) |
| 70 to 74 Years | 30 (14.2%) | 39 (19.1%) |
| 75 to 79 Years | 17 (8.1%) | 7 (3.4%) |
| 80 to 84 Years | 12 (5.7%) | 9 (4.4%) |
| 85 Years and over | 8 (3.8%) | 13 (6.4%) |
| Total | 211 (100.0%) | 204 (100.0%) |
Families and Households in White Pine
Median Family Size in White Pine
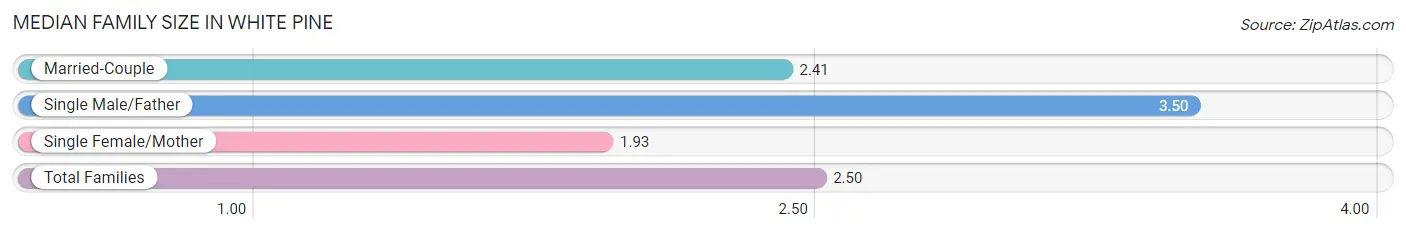
The median family size in White Pine is 2.50 persons per family, with single male/father families (16 | 13.2%) accounting for the largest median family size of 3.5 persons per family. On the other hand, single female/mother families (14 | 11.6%) represent the smallest median family size with 1.93 persons per family.
| Family Type | # Families | Family Size |
| Married-Couple | 91 (75.2%) | 2.41 |
| Single Male/Father | 16 (13.2%) | 3.50 |
| Single Female/Mother | 14 (11.6%) | 1.93 |
| Total Families | 121 (100.0%) | 2.50 |
Median Household Size in White Pine
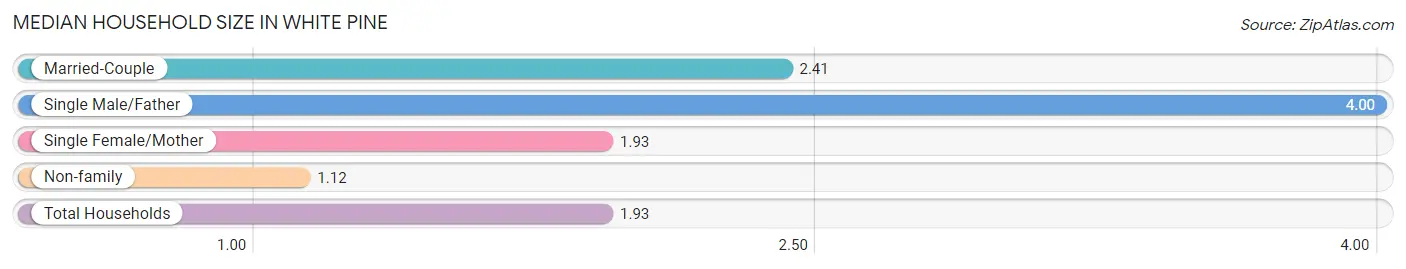
The median household size in White Pine is 1.93 persons per household, with single male/father households (16 | 7.4%) accounting for the largest median household size of 4 persons per household. non-family households (94 | 43.7%) represent the smallest median household size with 1.12 persons per household.
| Household Type | # Households | Household Size |
| Married-Couple | 91 (42.3%) | 2.41 |
| Single Male/Father | 16 (7.4%) | 4.00 |
| Single Female/Mother | 14 (6.5%) | 1.93 |
| Non-family | 94 (43.7%) | 1.12 |
| Total Households | 215 (100.0%) | 1.93 |
Household Size by Marriage Status in White Pine
Out of a total of 215 households in White Pine, 121 (56.3%) are family households, while 94 (43.7%) are nonfamily households. The most numerous type of family households are 2-person households, comprising 99, and the most common type of nonfamily households are 1-person households, comprising 86.
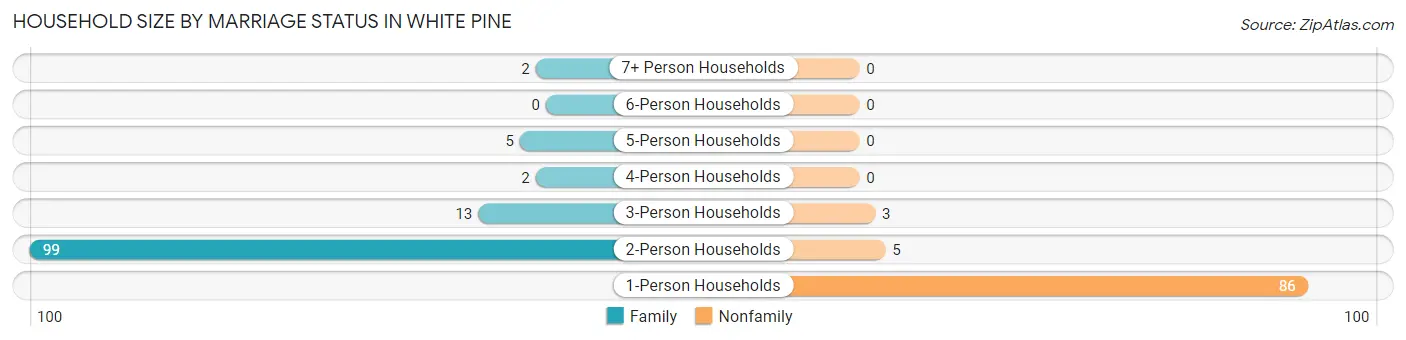
| Household Size | Family Households | Nonfamily Households |
| 1-Person Households | - | 86 (40.0%) |
| 2-Person Households | 99 (46.1%) | 5 (2.3%) |
| 3-Person Households | 13 (6.0%) | 3 (1.4%) |
| 4-Person Households | 2 (0.9%) | 0 (0.0%) |
| 5-Person Households | 5 (2.3%) | 0 (0.0%) |
| 6-Person Households | 0 (0.0%) | 0 (0.0%) |
| 7+ Person Households | 2 (0.9%) | 0 (0.0%) |
| Total | 121 (56.3%) | 94 (43.7%) |
Female Fertility in White Pine
Fertility by Age in White Pine
Average fertility rate in White Pine is 174.0 births per 1,000 women. Women in the age bracket of 20 to 34 years have the highest fertility rate with 258.0 births per 1,000 women. Women in the age bracket of 20 to 34 years acount for 100.0% of all women with births.
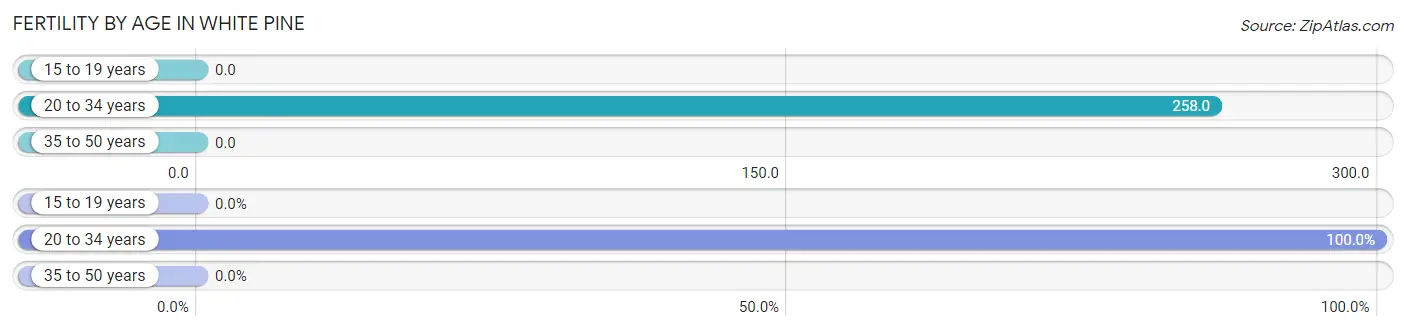
| Age Bracket | Women with Births | Births / 1,000 Women |
| 15 to 19 years | 0 (0.0%) | 0.0 |
| 20 to 34 years | 8 (100.0%) | 258.0 |
| 35 to 50 years | 0 (0.0%) | 0.0 |
| Total | 8 (100.0%) | 174.0 |
Fertility by Age by Marriage Status in White Pine
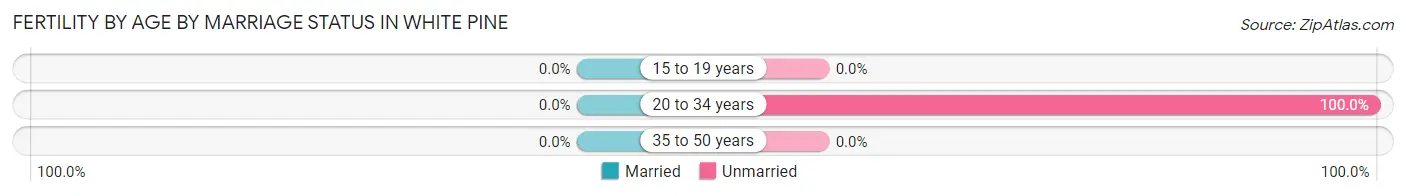
| Age Bracket | Married | Unmarried |
| 15 to 19 years | 0 (0.0%) | 0 (0.0%) |
| 20 to 34 years | 0 (0.0%) | 8 (100.0%) |
| 35 to 50 years | 0 (0.0%) | 0 (0.0%) |
| Total | 0 (0.0%) | 8 (100.0%) |
Fertility by Education in White Pine
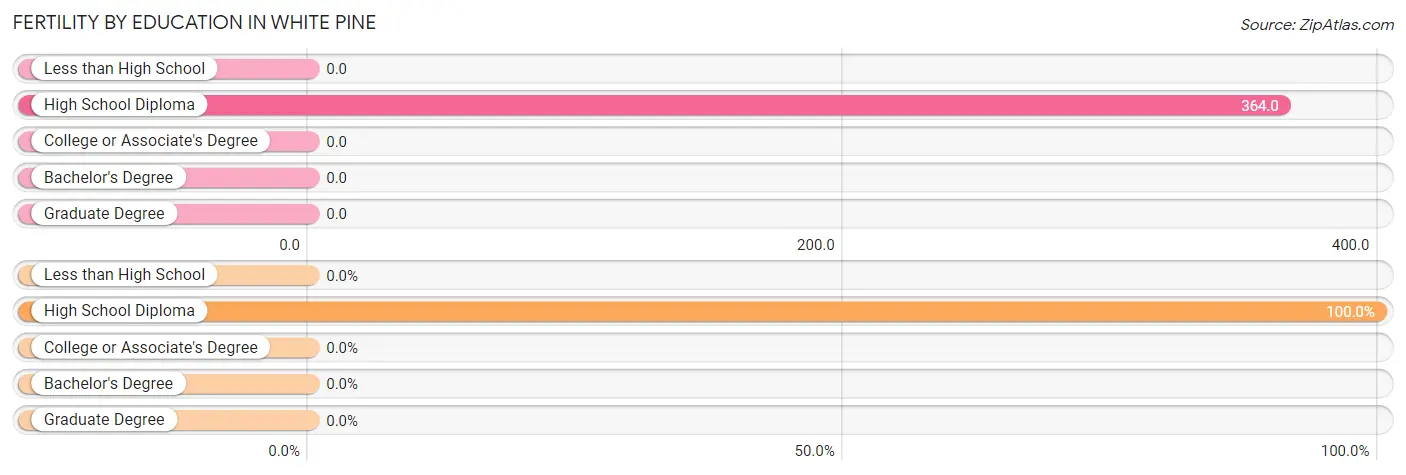
| Educational Attainment | Women with Births | Births / 1,000 Women |
| Less than High School | 0 (0.0%) | 0.0 |
| High School Diploma | 8 (100.0%) | 364.0 |
| College or Associate's Degree | 0 (0.0%) | 0.0 |
| Bachelor's Degree | 0 (0.0%) | 0.0 |
| Graduate Degree | 0 (0.0%) | 0.0 |
| Total | 8 (100.0%) | 174.0 |
Fertility by Education by Marriage Status in White Pine
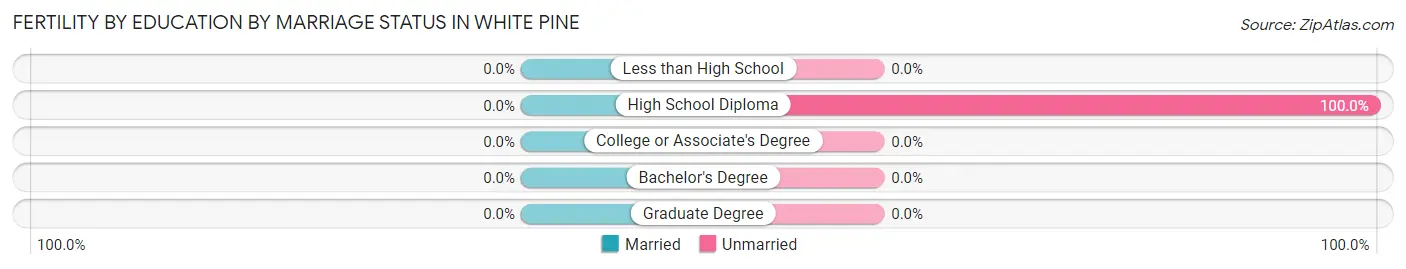
| Educational Attainment | Married | Unmarried |
| Less than High School | 0 (0.0%) | 0 (0.0%) |
| High School Diploma | 0 (0.0%) | 8 (100.0%) |
| College or Associate's Degree | 0 (0.0%) | 0 (0.0%) |
| Bachelor's Degree | 0 (0.0%) | 0 (0.0%) |
| Graduate Degree | 0 (0.0%) | 0 (0.0%) |
| Total | 0 (0.0%) | 8 (100.0%) |
Employment Characteristics in White Pine
Employment by Class of Employer in White Pine
Among the 116 employed individuals in White Pine, private company employees (69 | 59.5%), local government employees (20 | 17.2%), and self-employed (not incorporated) (10 | 8.6%) make up the most common classes of employment.
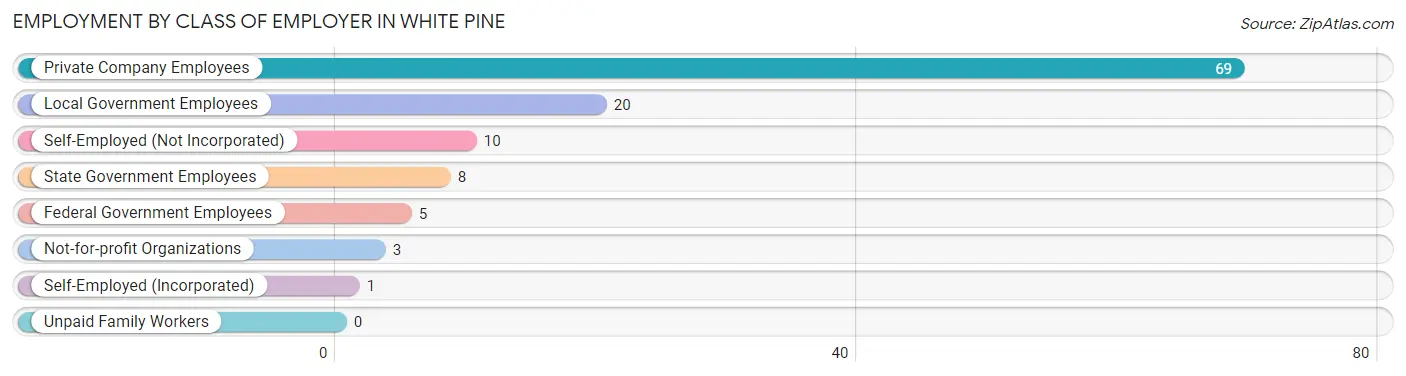
| Employer Class | # Employees | % Employees |
| Private Company Employees | 69 | 59.5% |
| Self-Employed (Incorporated) | 1 | 0.9% |
| Self-Employed (Not Incorporated) | 10 | 8.6% |
| Not-for-profit Organizations | 3 | 2.6% |
| Local Government Employees | 20 | 17.2% |
| State Government Employees | 8 | 6.9% |
| Federal Government Employees | 5 | 4.3% |
| Unpaid Family Workers | 0 | 0.0% |
| Total | 116 | 100.0% |
Employment Status by Age in White Pine
According to the labor force statistics for White Pine, out of the total population over 16 years of age (374), 31.8% or 119 individuals are in the labor force, with 0.8% or 1 of them unemployed. The age group with the highest labor force participation rate is 35 to 44 years, with 83.3% or 10 individuals in the labor force. Within the labor force, the 60 to 64 years age range has the highest percentage of unemployed individuals, with 4.3% or 1 of them being unemployed.
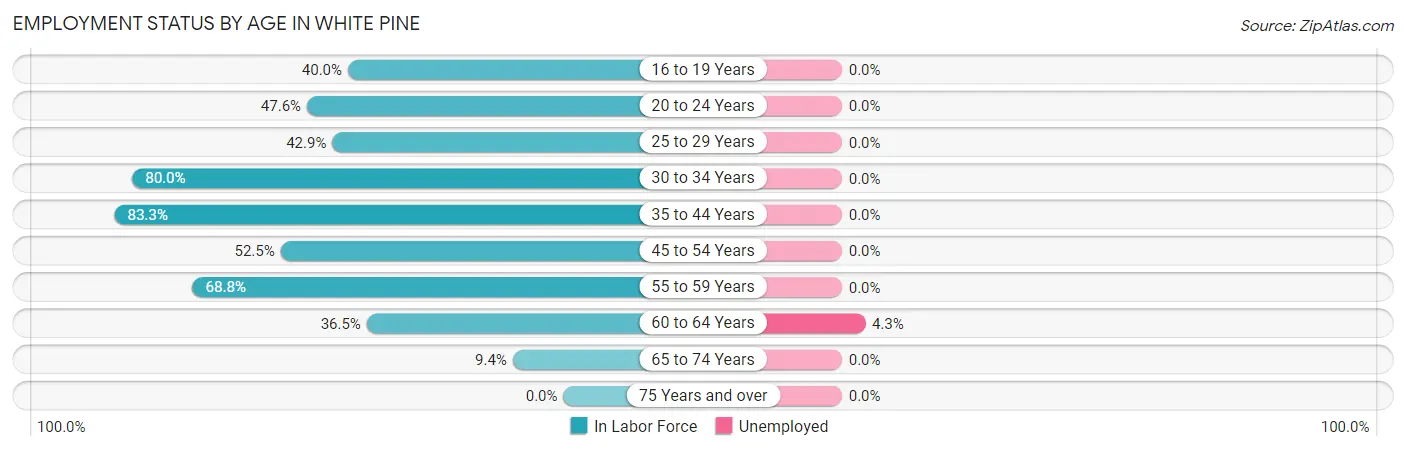
| Age Bracket | In Labor Force | Unemployed |
| 16 to 19 Years | 6 (40.0%) | 0 (0.0%) |
| 20 to 24 Years | 10 (47.6%) | 0 (0.0%) |
| 25 to 29 Years | 6 (42.9%) | 0 (0.0%) |
| 30 to 34 Years | 12 (80.0%) | 0 (0.0%) |
| 35 to 44 Years | 10 (83.3%) | 0 (0.0%) |
| 45 to 54 Years | 21 (52.5%) | 0 (0.0%) |
| 55 to 59 Years | 22 (68.8%) | 0 (0.0%) |
| 60 to 64 Years | 23 (36.5%) | 1 (4.3%) |
| 65 to 74 Years | 9 (9.4%) | 0 (0.0%) |
| 75 Years and over | 0 (0.0%) | 0 (0.0%) |
| Total | 119 (31.8%) | 1 (0.8%) |
Employment Status by Educational Attainment in White Pine
According to labor force statistics for White Pine, 53.4% of individuals (94) out of the total population between 25 and 64 years of age (176) are in the labor force, with 1.1% or 1 of them being unemployed. The group with the highest labor force participation rate are those with the educational attainment of bachelor's degree or higher, with 72.7% or 16 individuals in the labor force. Within the labor force, individuals with college / associate degree education have the highest percentage of unemployment, with 2.0% or 1 of them being unemployed.
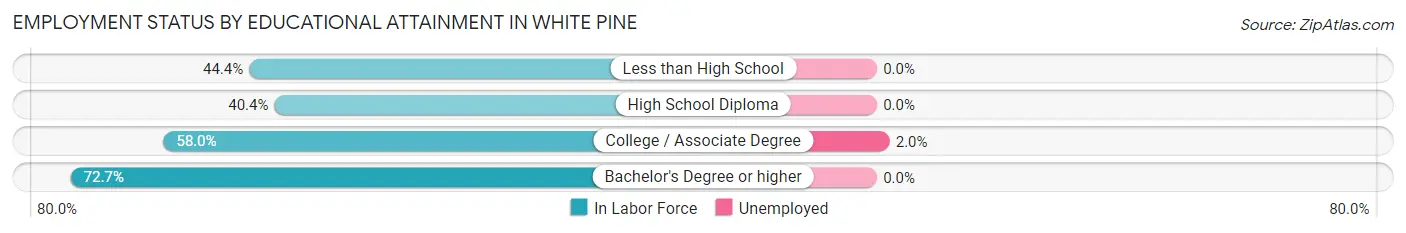
| Educational Attainment | In Labor Force | Unemployed |
| Less than High School | 4 (44.4%) | 0 (0.0%) |
| High School Diploma | 23 (40.4%) | 0 (0.0%) |
| College / Associate Degree | 51 (58.0%) | 2 (2.0%) |
| Bachelor's Degree or higher | 16 (72.7%) | 0 (0.0%) |
| Total | 94 (53.4%) | 2 (1.1%) |
Employment Occupations by Sex in White Pine
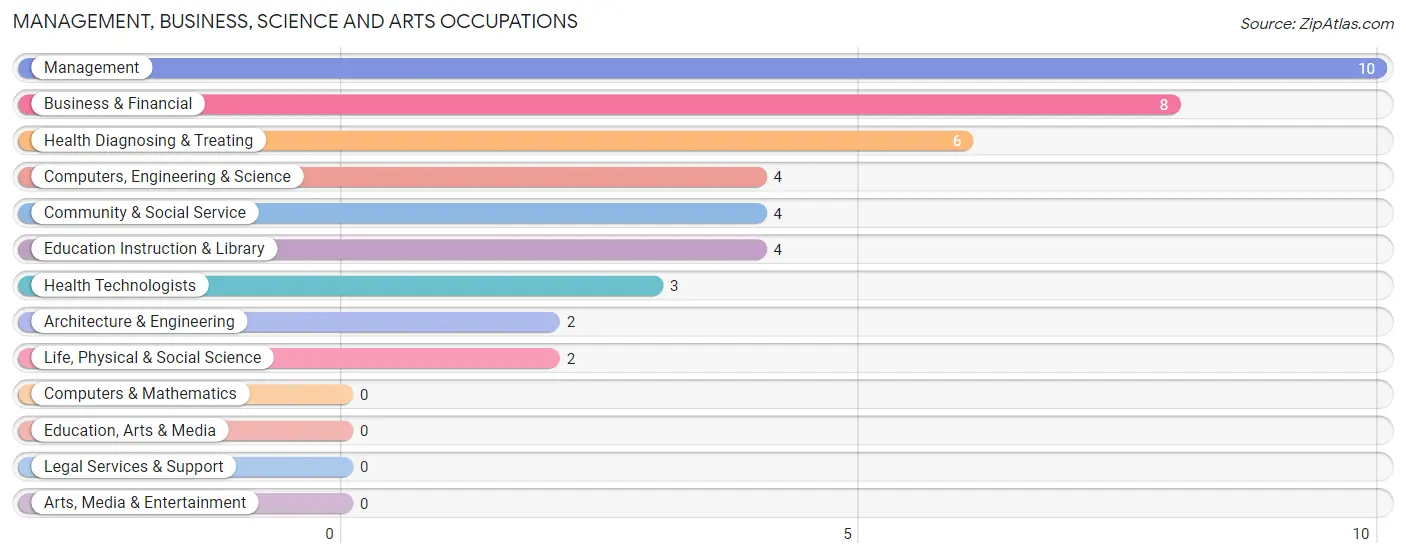
Management, Business, Science and Arts Occupations
The most common Management, Business, Science and Arts occupations in White Pine are Management (10 | 8.5%), Business & Financial (8 | 6.8%), Health Diagnosing & Treating (6 | 5.1%), Computers, Engineering & Science (4 | 3.4%), and Community & Social Service (4 | 3.4%).
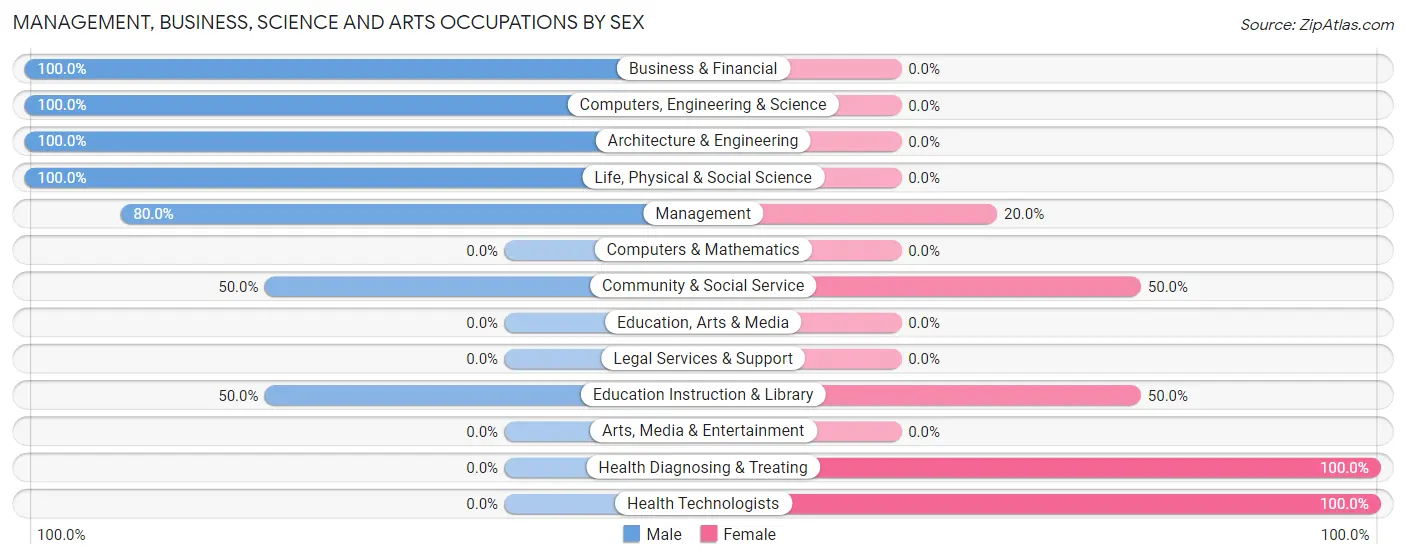
Management, Business, Science and Arts Occupations by Sex
Within the Management, Business, Science and Arts occupations in White Pine, the most male-oriented occupations are Business & Financial (100.0%), Computers, Engineering & Science (100.0%), and Architecture & Engineering (100.0%), while the most female-oriented occupations are Health Diagnosing & Treating (100.0%), Health Technologists (100.0%), and Community & Social Service (50.0%).
| Occupation | Male | Female |
| Management | 8 (80.0%) | 2 (20.0%) |
| Business & Financial | 8 (100.0%) | 0 (0.0%) |
| Computers, Engineering & Science | 4 (100.0%) | 0 (0.0%) |
| Computers & Mathematics | 0 (0.0%) | 0 (0.0%) |
| Architecture & Engineering | 2 (100.0%) | 0 (0.0%) |
| Life, Physical & Social Science | 2 (100.0%) | 0 (0.0%) |
| Community & Social Service | 2 (50.0%) | 2 (50.0%) |
| Education, Arts & Media | 0 (0.0%) | 0 (0.0%) |
| Legal Services & Support | 0 (0.0%) | 0 (0.0%) |
| Education Instruction & Library | 2 (50.0%) | 2 (50.0%) |
| Arts, Media & Entertainment | 0 (0.0%) | 0 (0.0%) |
| Health Diagnosing & Treating | 0 (0.0%) | 6 (100.0%) |
| Health Technologists | 0 (0.0%) | 3 (100.0%) |
| Total (Category) | 22 (68.8%) | 10 (31.2%) |
| Total (Overall) | 64 (54.2%) | 54 (45.8%) |
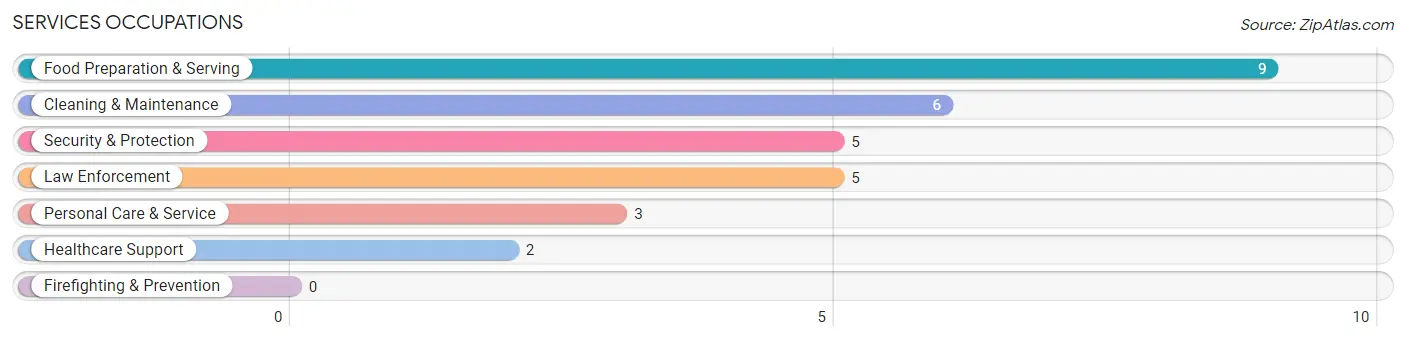
Services Occupations
The most common Services occupations in White Pine are Food Preparation & Serving (9 | 7.6%), Cleaning & Maintenance (6 | 5.1%), Security & Protection (5 | 4.2%), Law Enforcement (5 | 4.2%), and Personal Care & Service (3 | 2.5%).
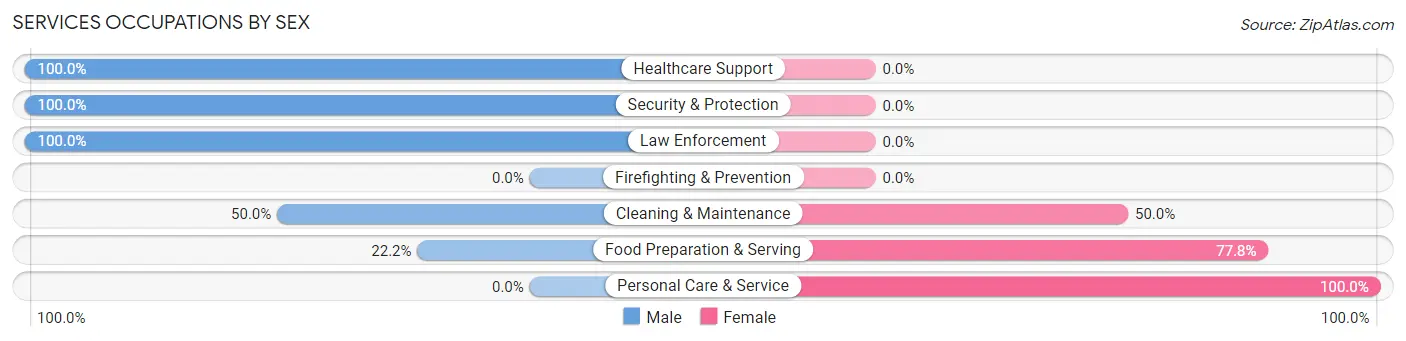
Services Occupations by Sex
Within the Services occupations in White Pine, the most male-oriented occupations are Healthcare Support (100.0%), Security & Protection (100.0%), and Law Enforcement (100.0%), while the most female-oriented occupations are Personal Care & Service (100.0%), Food Preparation & Serving (77.8%), and Cleaning & Maintenance (50.0%).
| Occupation | Male | Female |
| Healthcare Support | 2 (100.0%) | 0 (0.0%) |
| Security & Protection | 5 (100.0%) | 0 (0.0%) |
| Firefighting & Prevention | 0 (0.0%) | 0 (0.0%) |
| Law Enforcement | 5 (100.0%) | 0 (0.0%) |
| Food Preparation & Serving | 2 (22.2%) | 7 (77.8%) |
| Cleaning & Maintenance | 3 (50.0%) | 3 (50.0%) |
| Personal Care & Service | 0 (0.0%) | 3 (100.0%) |
| Total (Category) | 12 (48.0%) | 13 (52.0%) |
| Total (Overall) | 64 (54.2%) | 54 (45.8%) |
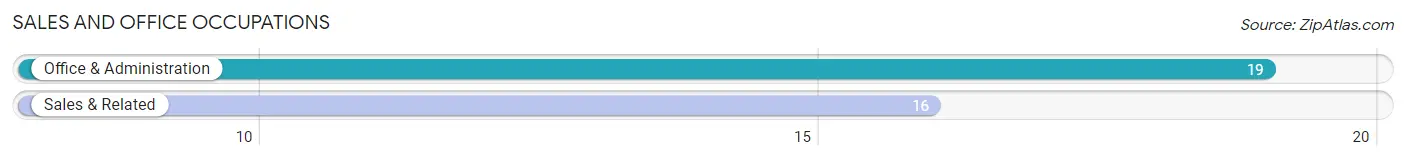
Sales and Office Occupations
The most common Sales and Office occupations in White Pine are Office & Administration (19 | 16.1%), and Sales & Related (16 | 13.6%).
Sales and Office Occupations by Sex
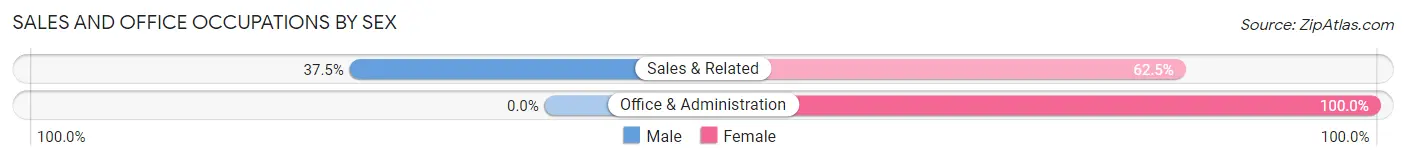
| Occupation | Male | Female |
| Sales & Related | 6 (37.5%) | 10 (62.5%) |
| Office & Administration | 0 (0.0%) | 19 (100.0%) |
| Total (Category) | 6 (17.1%) | 29 (82.9%) |
| Total (Overall) | 64 (54.2%) | 54 (45.8%) |
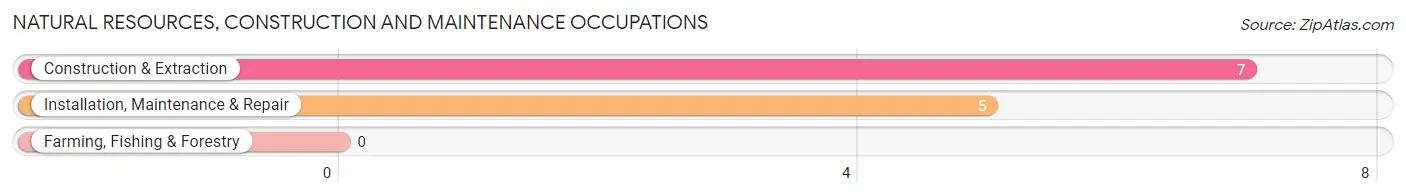
Natural Resources, Construction and Maintenance Occupations
The most common Natural Resources, Construction and Maintenance occupations in White Pine are Construction & Extraction (7 | 5.9%), and Installation, Maintenance & Repair (5 | 4.2%).
Natural Resources, Construction and Maintenance Occupations by Sex
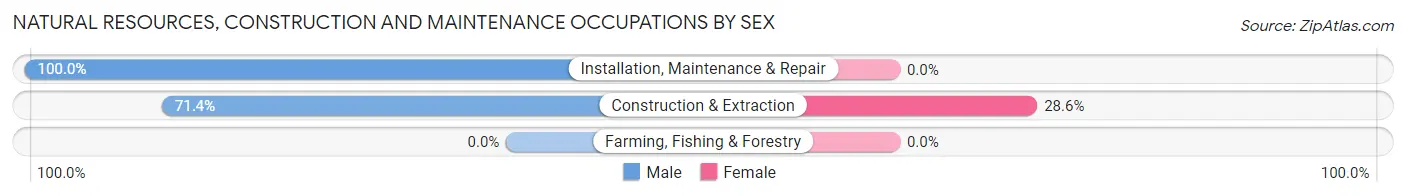
| Occupation | Male | Female |
| Farming, Fishing & Forestry | 0 (0.0%) | 0 (0.0%) |
| Construction & Extraction | 5 (71.4%) | 2 (28.6%) |
| Installation, Maintenance & Repair | 5 (100.0%) | 0 (0.0%) |
| Total (Category) | 10 (83.3%) | 2 (16.7%) |
| Total (Overall) | 64 (54.2%) | 54 (45.8%) |
Production, Transportation and Moving Occupations
The most common Production, Transportation and Moving occupations in White Pine are Transportation (10 | 8.5%), and Production (4 | 3.4%).
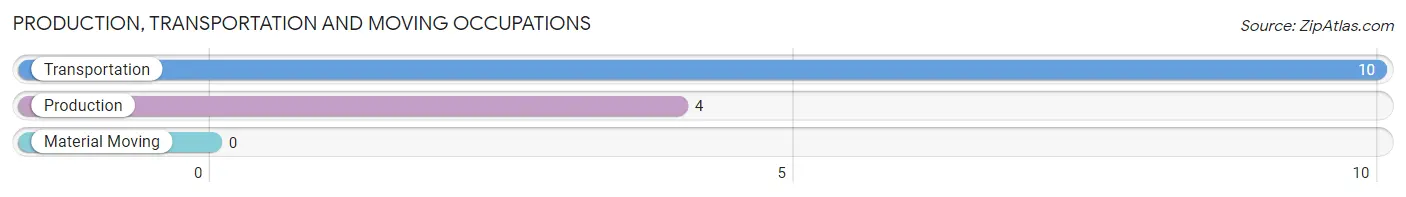
Production, Transportation and Moving Occupations by Sex
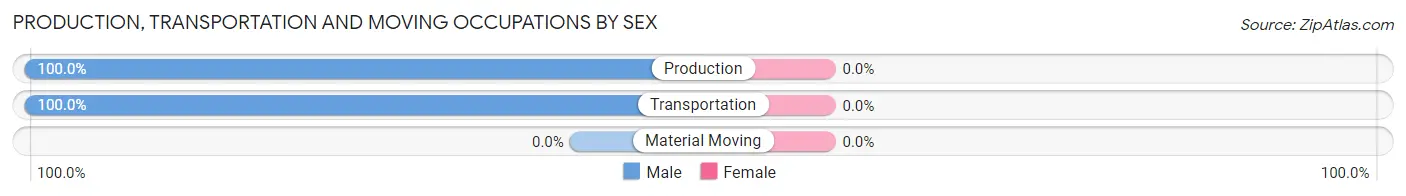
| Occupation | Male | Female |
| Production | 4 (100.0%) | 0 (0.0%) |
| Transportation | 10 (100.0%) | 0 (0.0%) |
| Material Moving | 0 (0.0%) | 0 (0.0%) |
| Total (Category) | 14 (100.0%) | 0 (0.0%) |
| Total (Overall) | 64 (54.2%) | 54 (45.8%) |
Employment Industries by Sex in White Pine
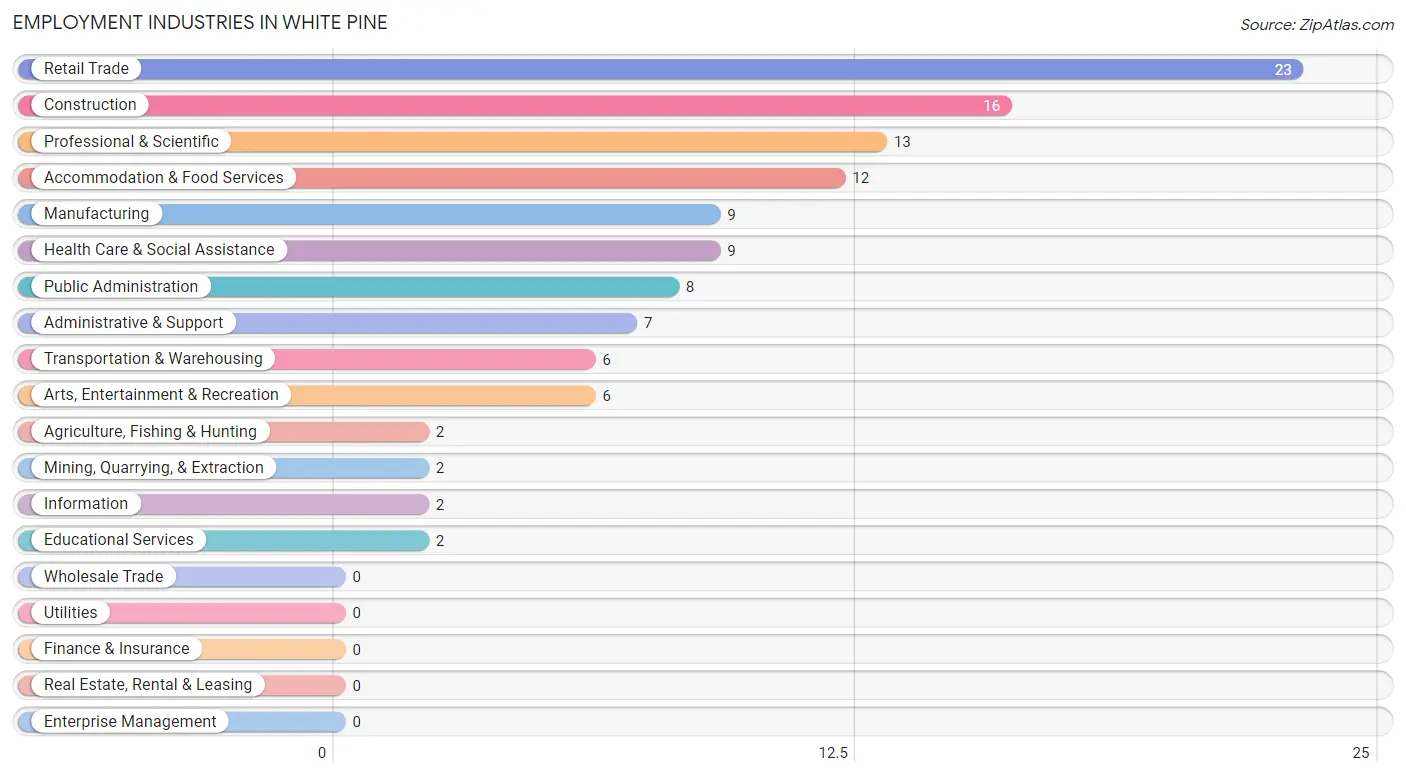
Employment Industries in White Pine
The major employment industries in White Pine include Retail Trade (23 | 19.5%), Construction (16 | 13.6%), Professional & Scientific (13 | 11.0%), Accommodation & Food Services (12 | 10.2%), and Manufacturing (9 | 7.6%).
Employment Industries by Sex in White Pine
The White Pine industries that see more men than women are Agriculture, Fishing & Hunting (100.0%), Mining, Quarrying, & Extraction (100.0%), and Manufacturing (100.0%), whereas the industries that tend to have a higher number of women are Information (100.0%), Administrative & Support (100.0%), and Accommodation & Food Services (83.3%).
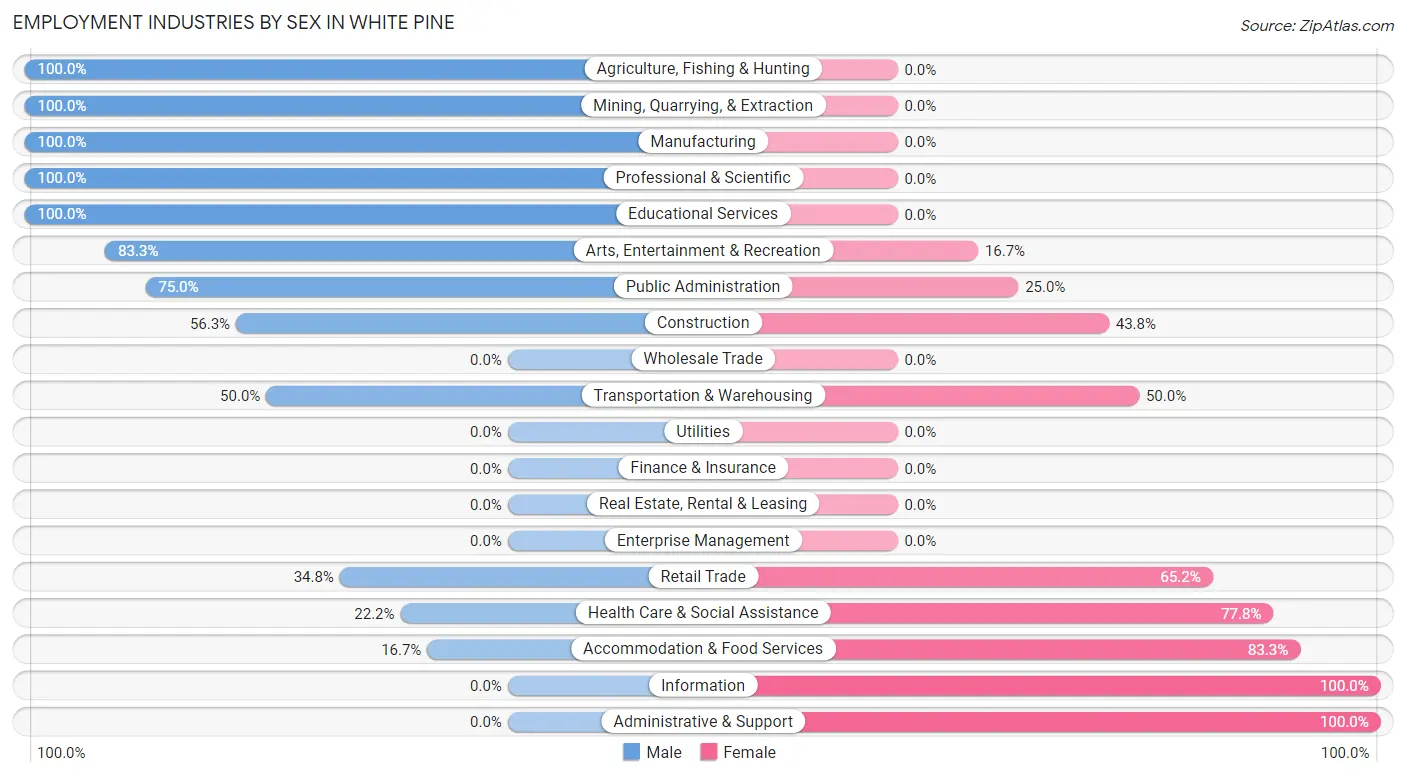
| Industry | Male | Female |
| Agriculture, Fishing & Hunting | 2 (100.0%) | 0 (0.0%) |
| Mining, Quarrying, & Extraction | 2 (100.0%) | 0 (0.0%) |
| Construction | 9 (56.2%) | 7 (43.8%) |
| Manufacturing | 9 (100.0%) | 0 (0.0%) |
| Wholesale Trade | 0 (0.0%) | 0 (0.0%) |
| Retail Trade | 8 (34.8%) | 15 (65.2%) |
| Transportation & Warehousing | 3 (50.0%) | 3 (50.0%) |
| Utilities | 0 (0.0%) | 0 (0.0%) |
| Information | 0 (0.0%) | 2 (100.0%) |
| Finance & Insurance | 0 (0.0%) | 0 (0.0%) |
| Real Estate, Rental & Leasing | 0 (0.0%) | 0 (0.0%) |
| Professional & Scientific | 13 (100.0%) | 0 (0.0%) |
| Enterprise Management | 0 (0.0%) | 0 (0.0%) |
| Administrative & Support | 0 (0.0%) | 7 (100.0%) |
| Educational Services | 2 (100.0%) | 0 (0.0%) |
| Health Care & Social Assistance | 2 (22.2%) | 7 (77.8%) |
| Arts, Entertainment & Recreation | 5 (83.3%) | 1 (16.7%) |
| Accommodation & Food Services | 2 (16.7%) | 10 (83.3%) |
| Public Administration | 6 (75.0%) | 2 (25.0%) |
| Total | 64 (54.2%) | 54 (45.8%) |
Education in White Pine
School Enrollment in White Pine
The most common levels of schooling among the 32 students in White Pine are high school (11 | 34.4%), college / undergraduate (10 | 31.2%), and elementary school (6 | 18.8%).
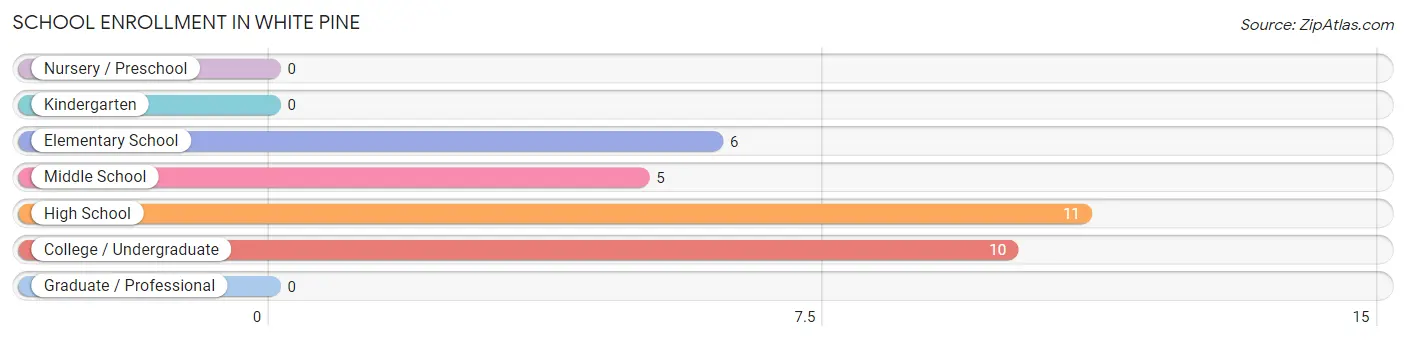
| School Level | # Students | % Students |
| Nursery / Preschool | 0 | 0.0% |
| Kindergarten | 0 | 0.0% |
| Elementary School | 6 | 18.8% |
| Middle School | 5 | 15.6% |
| High School | 11 | 34.4% |
| College / Undergraduate | 10 | 31.2% |
| Graduate / Professional | 0 | 0.0% |
| Total | 32 | 100.0% |
School Enrollment by Age by Funding Source in White Pine
Out of a total of 32 students who are enrolled in schools in White Pine, 10 (31.3%) attend a private institution, while the remaining 22 (68.7%) are enrolled in public schools. The age group of 20 to 24 year olds has the highest likelihood of being enrolled in private schools, with 4 (100.0% in the age bracket) enrolled. Conversely, the age group of 5 to 9 year old has the lowest likelihood of being enrolled in a private school, with 6 (100.0% in the age bracket) attending a public institution.
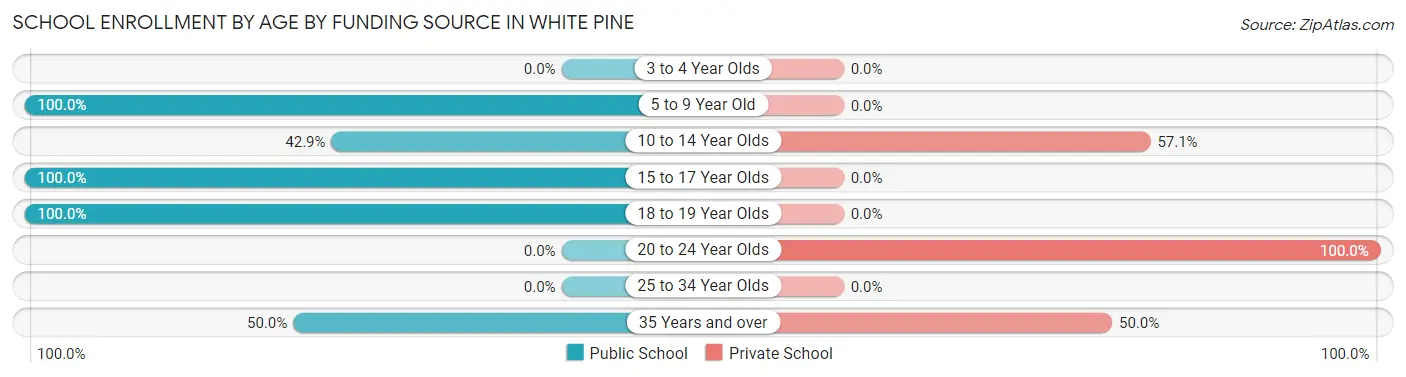
| Age Bracket | Public School | Private School |
| 3 to 4 Year Olds | 0 (0.0%) | 0 (0.0%) |
| 5 to 9 Year Old | 6 (100.0%) | 0 (0.0%) |
| 10 to 14 Year Olds | 3 (42.9%) | 4 (57.1%) |
| 15 to 17 Year Olds | 9 (100.0%) | 0 (0.0%) |
| 18 to 19 Year Olds | 2 (100.0%) | 0 (0.0%) |
| 20 to 24 Year Olds | 0 (0.0%) | 4 (100.0%) |
| 25 to 34 Year Olds | 0 (0.0%) | 0 (0.0%) |
| 35 Years and over | 2 (50.0%) | 2 (50.0%) |
| Total | 22 (68.8%) | 10 (31.3%) |
Educational Attainment by Field of Study in White Pine
Business (8 | 20.0%), arts & humanities (8 | 20.0%), engineering (7 | 17.5%), psychology (6 | 15.0%), and education (6 | 15.0%) are the most common fields of study among 40 individuals in White Pine who have obtained a bachelor's degree or higher.
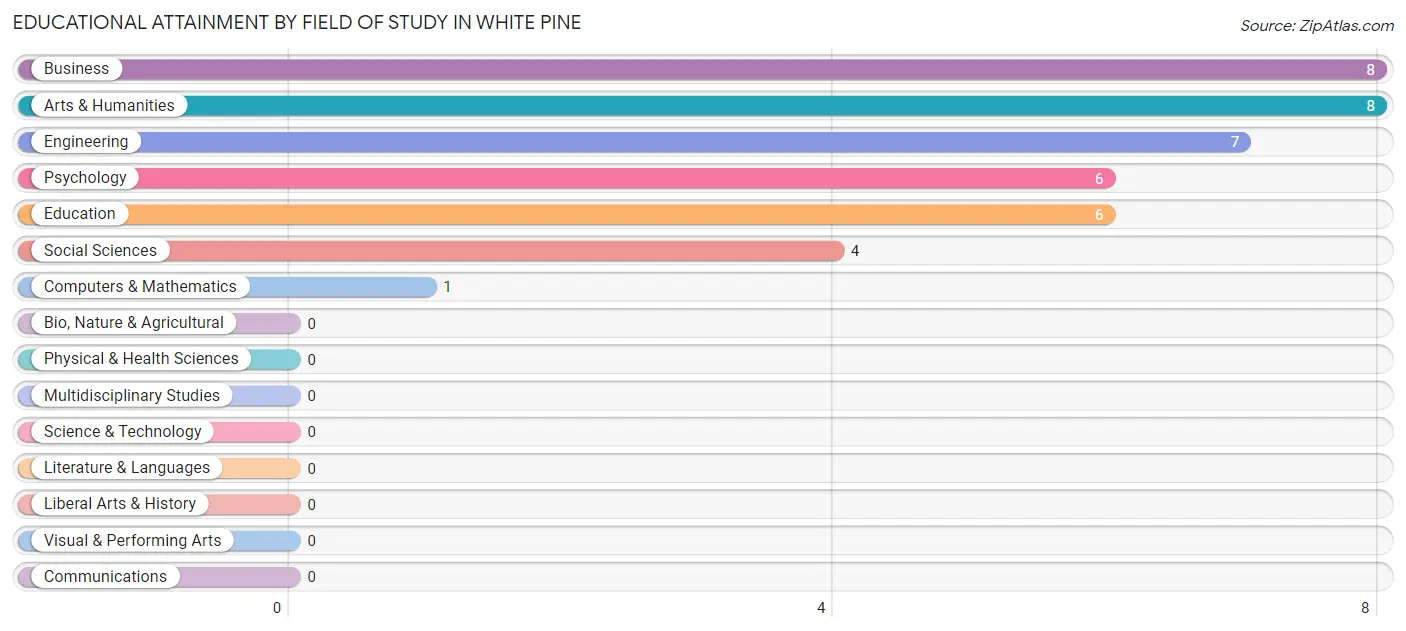
| Field of Study | # Graduates | % Graduates |
| Computers & Mathematics | 1 | 2.5% |
| Bio, Nature & Agricultural | 0 | 0.0% |
| Physical & Health Sciences | 0 | 0.0% |
| Psychology | 6 | 15.0% |
| Social Sciences | 4 | 10.0% |
| Engineering | 7 | 17.5% |
| Multidisciplinary Studies | 0 | 0.0% |
| Science & Technology | 0 | 0.0% |
| Business | 8 | 20.0% |
| Education | 6 | 15.0% |
| Literature & Languages | 0 | 0.0% |
| Liberal Arts & History | 0 | 0.0% |
| Visual & Performing Arts | 0 | 0.0% |
| Communications | 0 | 0.0% |
| Arts & Humanities | 8 | 20.0% |
| Total | 40 | 100.0% |
Transportation & Commute in White Pine
Vehicle Availability by Sex in White Pine
The most prevalent vehicle ownership categories in White Pine are males with 1 vehicle (29, accounting for 45.3%) and females with 1 vehicle (18, making up 55.8%).
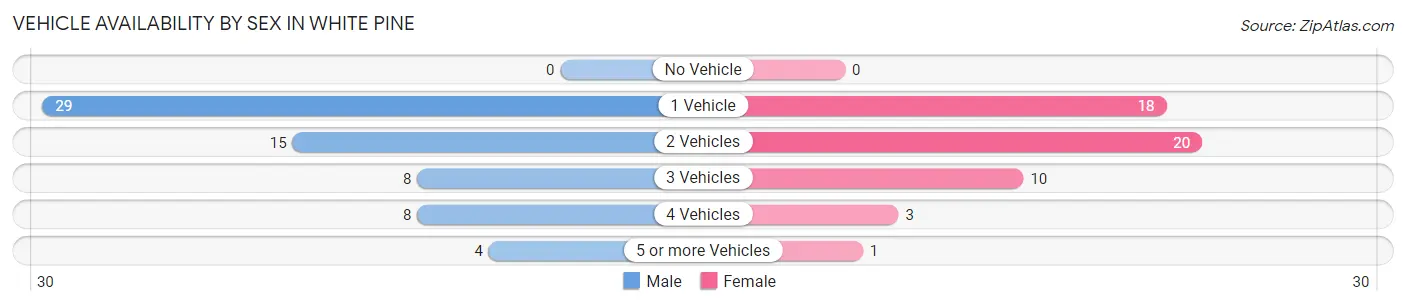
| Vehicles Available | Male | Female |
| No Vehicle | 0 (0.0%) | 0 (0.0%) |
| 1 Vehicle | 29 (45.3%) | 18 (34.6%) |
| 2 Vehicles | 15 (23.4%) | 20 (38.5%) |
| 3 Vehicles | 8 (12.5%) | 10 (19.2%) |
| 4 Vehicles | 8 (12.5%) | 3 (5.8%) |
| 5 or more Vehicles | 4 (6.2%) | 1 (1.9%) |
| Total | 64 (100.0%) | 52 (100.0%) |
Commute Time in White Pine
The most frequently occuring commute durations in White Pine are 45 to 59 minutes (16 commuters, 15.1%), 5 to 9 minutes (15 commuters, 14.1%), and 60 to 89 minutes (13 commuters, 12.3%).
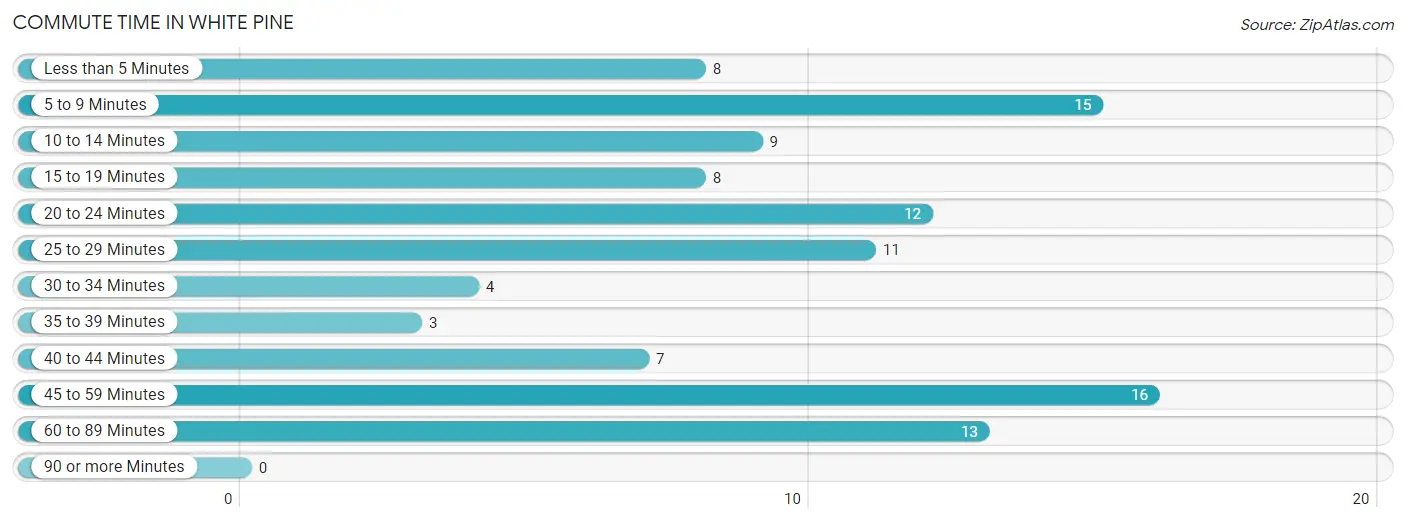
| Commute Time | # Commuters | % Commuters |
| Less than 5 Minutes | 8 | 7.5% |
| 5 to 9 Minutes | 15 | 14.1% |
| 10 to 14 Minutes | 9 | 8.5% |
| 15 to 19 Minutes | 8 | 7.5% |
| 20 to 24 Minutes | 12 | 11.3% |
| 25 to 29 Minutes | 11 | 10.4% |
| 30 to 34 Minutes | 4 | 3.8% |
| 35 to 39 Minutes | 3 | 2.8% |
| 40 to 44 Minutes | 7 | 6.6% |
| 45 to 59 Minutes | 16 | 15.1% |
| 60 to 89 Minutes | 13 | 12.3% |
| 90 or more Minutes | 0 | 0.0% |
Commute Time by Sex in White Pine
The most common commute times in White Pine are 20 to 24 minutes (10 commuters, 18.5%) for males and 25 to 29 minutes (8 commuters, 15.4%) for females.
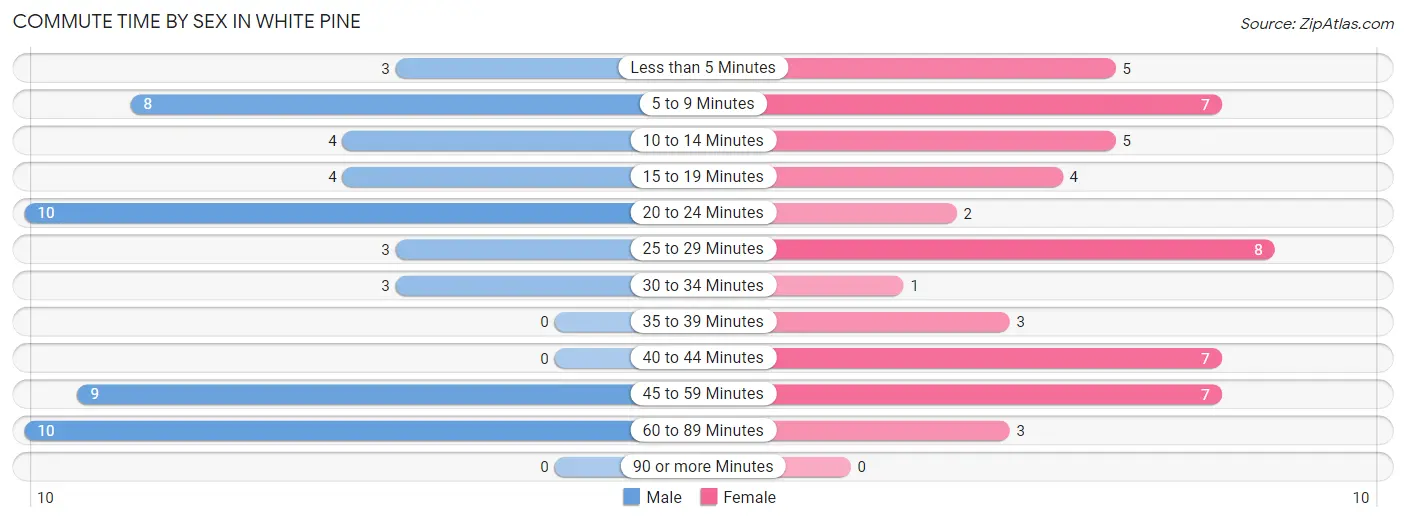
| Commute Time | Male | Female |
| Less than 5 Minutes | 3 (5.6%) | 5 (9.6%) |
| 5 to 9 Minutes | 8 (14.8%) | 7 (13.5%) |
| 10 to 14 Minutes | 4 (7.4%) | 5 (9.6%) |
| 15 to 19 Minutes | 4 (7.4%) | 4 (7.7%) |
| 20 to 24 Minutes | 10 (18.5%) | 2 (3.8%) |
| 25 to 29 Minutes | 3 (5.6%) | 8 (15.4%) |
| 30 to 34 Minutes | 3 (5.6%) | 1 (1.9%) |
| 35 to 39 Minutes | 0 (0.0%) | 3 (5.8%) |
| 40 to 44 Minutes | 0 (0.0%) | 7 (13.5%) |
| 45 to 59 Minutes | 9 (16.7%) | 7 (13.5%) |
| 60 to 89 Minutes | 10 (18.5%) | 3 (5.8%) |
| 90 or more Minutes | 0 (0.0%) | 0 (0.0%) |
Time of Departure to Work by Sex in White Pine
The most frequent times of departure to work in White Pine are 7:00 AM to 7:29 AM (13, 24.1%) for males and 8:00 AM to 8:29 AM (11, 21.1%) for females.
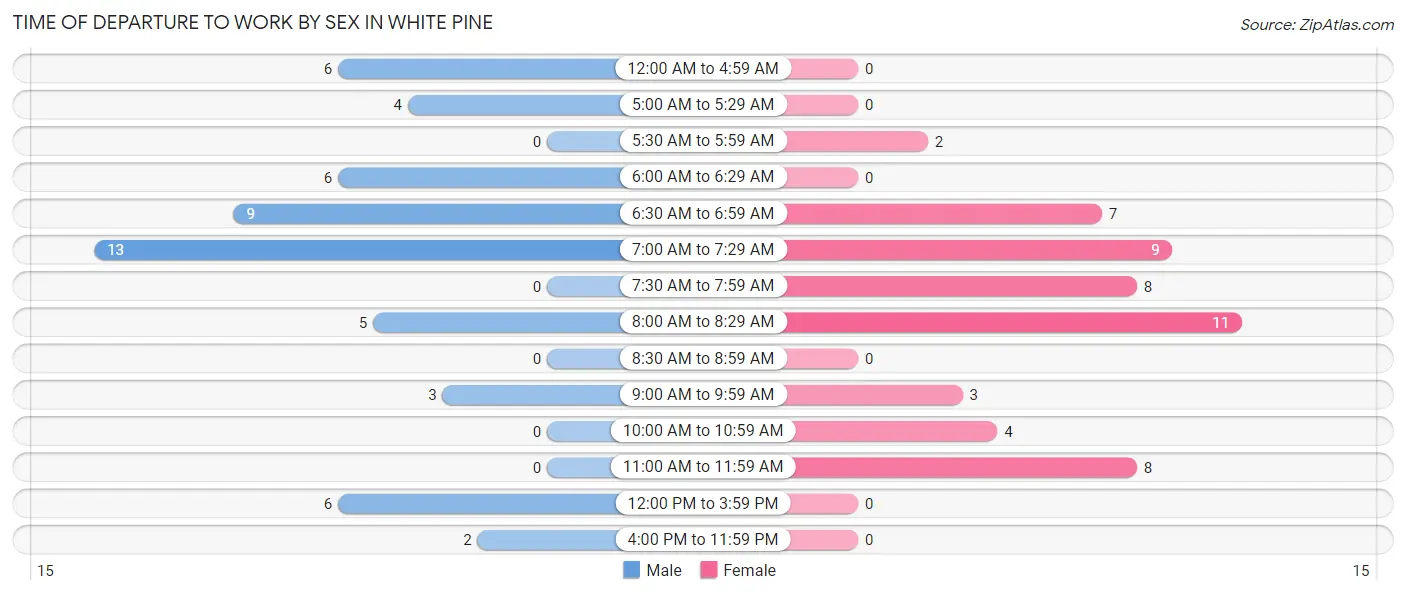
| Time of Departure | Male | Female |
| 12:00 AM to 4:59 AM | 6 (11.1%) | 0 (0.0%) |
| 5:00 AM to 5:29 AM | 4 (7.4%) | 0 (0.0%) |
| 5:30 AM to 5:59 AM | 0 (0.0%) | 2 (3.8%) |
| 6:00 AM to 6:29 AM | 6 (11.1%) | 0 (0.0%) |
| 6:30 AM to 6:59 AM | 9 (16.7%) | 7 (13.5%) |
| 7:00 AM to 7:29 AM | 13 (24.1%) | 9 (17.3%) |
| 7:30 AM to 7:59 AM | 0 (0.0%) | 8 (15.4%) |
| 8:00 AM to 8:29 AM | 5 (9.3%) | 11 (21.1%) |
| 8:30 AM to 8:59 AM | 0 (0.0%) | 0 (0.0%) |
| 9:00 AM to 9:59 AM | 3 (5.6%) | 3 (5.8%) |
| 10:00 AM to 10:59 AM | 0 (0.0%) | 4 (7.7%) |
| 11:00 AM to 11:59 AM | 0 (0.0%) | 8 (15.4%) |
| 12:00 PM to 3:59 PM | 6 (11.1%) | 0 (0.0%) |
| 4:00 PM to 11:59 PM | 2 (3.7%) | 0 (0.0%) |
| Total | 54 (100.0%) | 52 (100.0%) |
Housing Occupancy in White Pine
Occupancy by Ownership in White Pine
Of the total 215 dwellings in White Pine, owner-occupied units account for 205 (95.4%), while renter-occupied units make up 10 (4.6%).
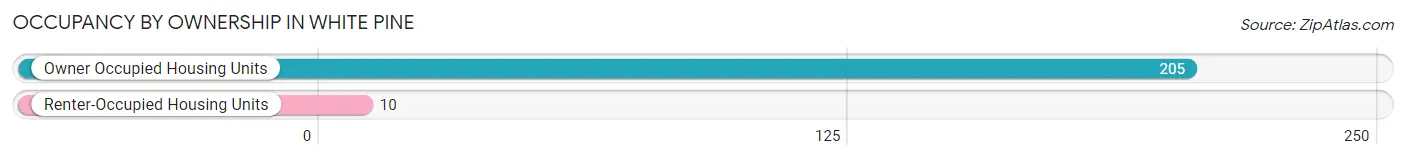
| Occupancy | # Housing Units | % Housing Units |
| Owner Occupied Housing Units | 205 | 95.4% |
| Renter-Occupied Housing Units | 10 | 4.6% |
| Total Occupied Housing Units | 215 | 100.0% |
Occupancy by Household Size in White Pine
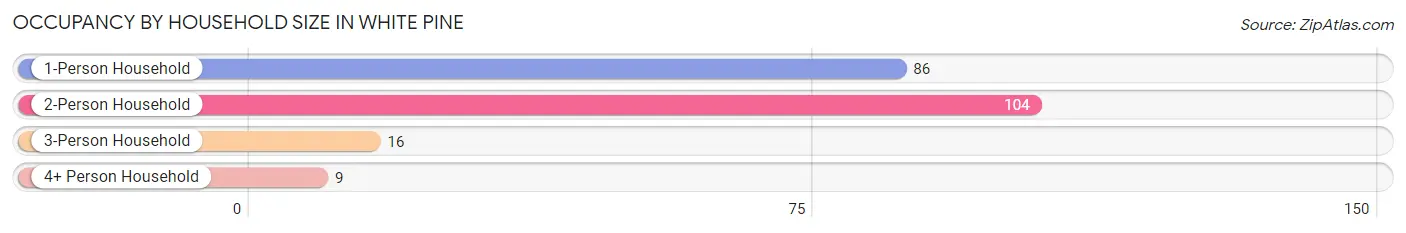
| Household Size | # Housing Units | % Housing Units |
| 1-Person Household | 86 | 40.0% |
| 2-Person Household | 104 | 48.4% |
| 3-Person Household | 16 | 7.4% |
| 4+ Person Household | 9 | 4.2% |
| Total Housing Units | 215 | 100.0% |
Occupancy by Ownership by Household Size in White Pine
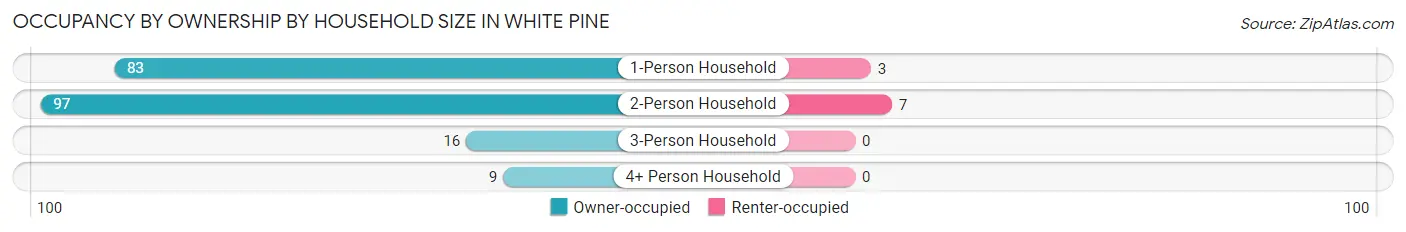
| Household Size | Owner-occupied | Renter-occupied |
| 1-Person Household | 83 (96.5%) | 3 (3.5%) |
| 2-Person Household | 97 (93.3%) | 7 (6.7%) |
| 3-Person Household | 16 (100.0%) | 0 (0.0%) |
| 4+ Person Household | 9 (100.0%) | 0 (0.0%) |
| Total Housing Units | 205 (95.4%) | 10 (4.6%) |
Occupancy by Educational Attainment in White Pine
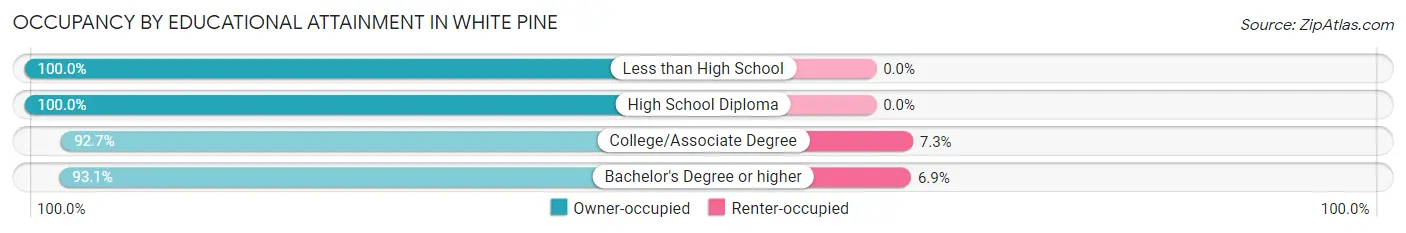
| Household Size | Owner-occupied | Renter-occupied |
| Less than High School | 11 (100.0%) | 0 (0.0%) |
| High School Diploma | 65 (100.0%) | 0 (0.0%) |
| College/Associate Degree | 102 (92.7%) | 8 (7.3%) |
| Bachelor's Degree or higher | 27 (93.1%) | 2 (6.9%) |
Occupancy by Age of Householder in White Pine
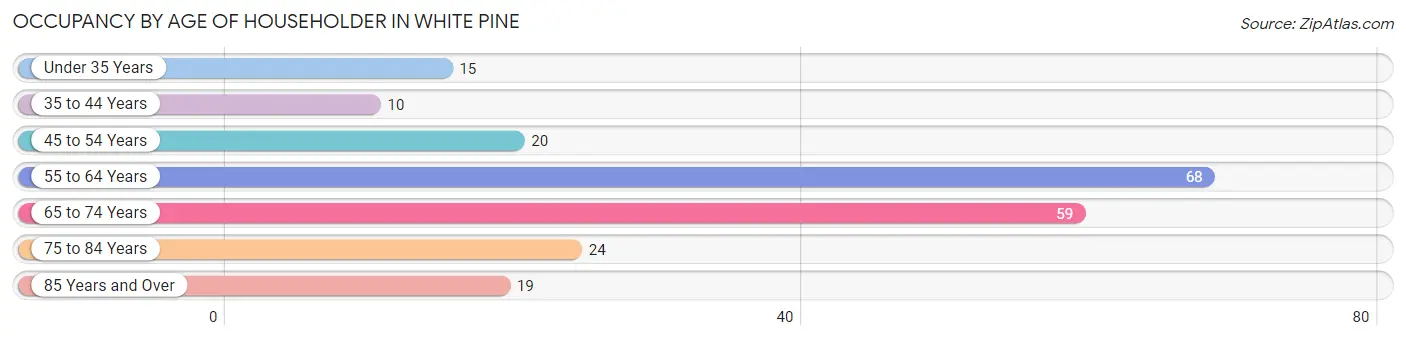
| Age Bracket | # Households | % Households |
| Under 35 Years | 15 | 7.0% |
| 35 to 44 Years | 10 | 4.6% |
| 45 to 54 Years | 20 | 9.3% |
| 55 to 64 Years | 68 | 31.6% |
| 65 to 74 Years | 59 | 27.4% |
| 75 to 84 Years | 24 | 11.2% |
| 85 Years and Over | 19 | 8.8% |
| Total | 215 | 100.0% |
Housing Finances in White Pine
Median Income by Occupancy in White Pine

| Occupancy Type | # Households | Median Income |
| Owner-Occupied | 205 (95.4%) | $44,602 |
| Renter-Occupied | 10 (4.6%) | $36,250 |
| Average | 215 (100.0%) | $44,602 |
Occupancy by Householder Income Bracket in White Pine
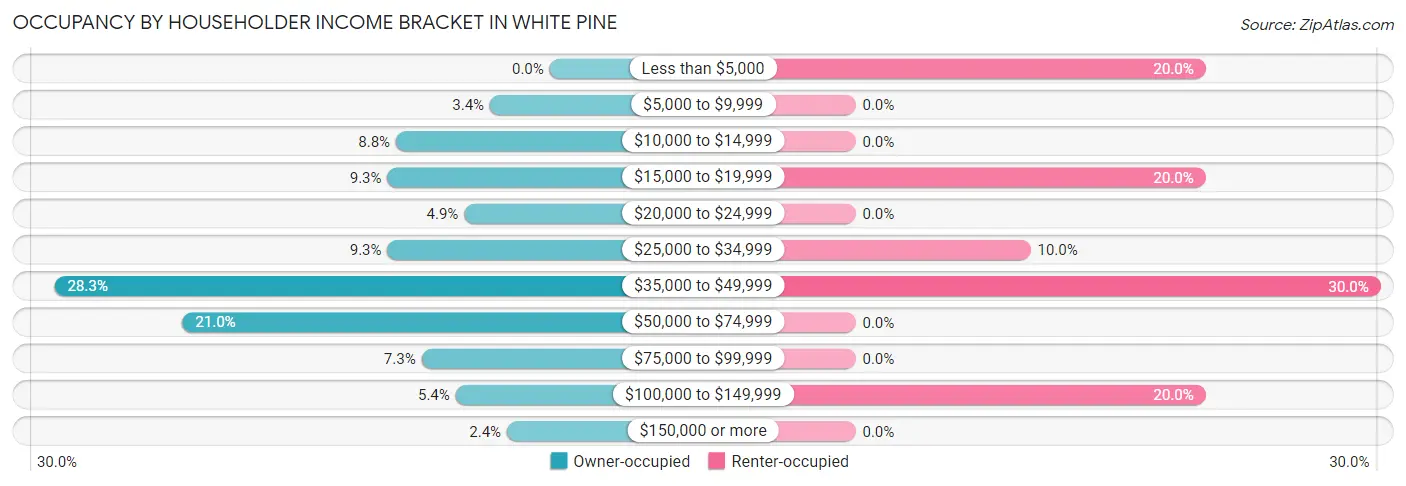
| Income Bracket | Owner-occupied | Renter-occupied |
| Less than $5,000 | 0 (0.0%) | 2 (20.0%) |
| $5,000 to $9,999 | 7 (3.4%) | 0 (0.0%) |
| $10,000 to $14,999 | 18 (8.8%) | 0 (0.0%) |
| $15,000 to $19,999 | 19 (9.3%) | 2 (20.0%) |
| $20,000 to $24,999 | 10 (4.9%) | 0 (0.0%) |
| $25,000 to $34,999 | 19 (9.3%) | 1 (10.0%) |
| $35,000 to $49,999 | 58 (28.3%) | 3 (30.0%) |
| $50,000 to $74,999 | 43 (21.0%) | 0 (0.0%) |
| $75,000 to $99,999 | 15 (7.3%) | 0 (0.0%) |
| $100,000 to $149,999 | 11 (5.4%) | 2 (20.0%) |
| $150,000 or more | 5 (2.4%) | 0 (0.0%) |
| Total | 205 (100.0%) | 10 (100.0%) |
Monthly Housing Cost Tiers in White Pine
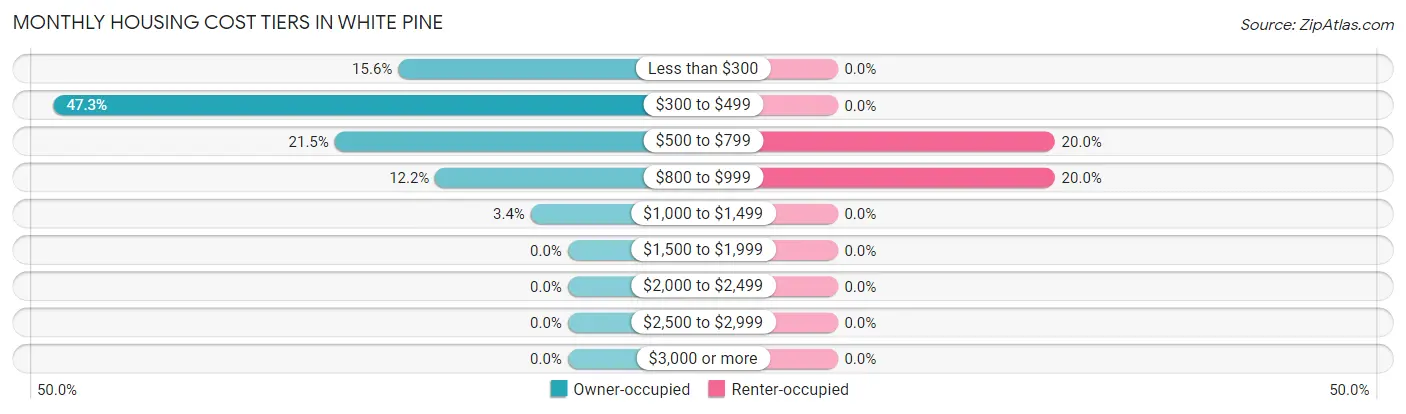
| Monthly Cost | Owner-occupied | Renter-occupied |
| Less than $300 | 32 (15.6%) | 0 (0.0%) |
| $300 to $499 | 97 (47.3%) | 0 (0.0%) |
| $500 to $799 | 44 (21.5%) | 2 (20.0%) |
| $800 to $999 | 25 (12.2%) | 2 (20.0%) |
| $1,000 to $1,499 | 7 (3.4%) | 0 (0.0%) |
| $1,500 to $1,999 | 0 (0.0%) | 0 (0.0%) |
| $2,000 to $2,499 | 0 (0.0%) | 0 (0.0%) |
| $2,500 to $2,999 | 0 (0.0%) | 0 (0.0%) |
| $3,000 or more | 0 (0.0%) | 0 (0.0%) |
| Total | 205 (100.0%) | 10 (100.0%) |
Physical Housing Characteristics in White Pine
Housing Structures in White Pine
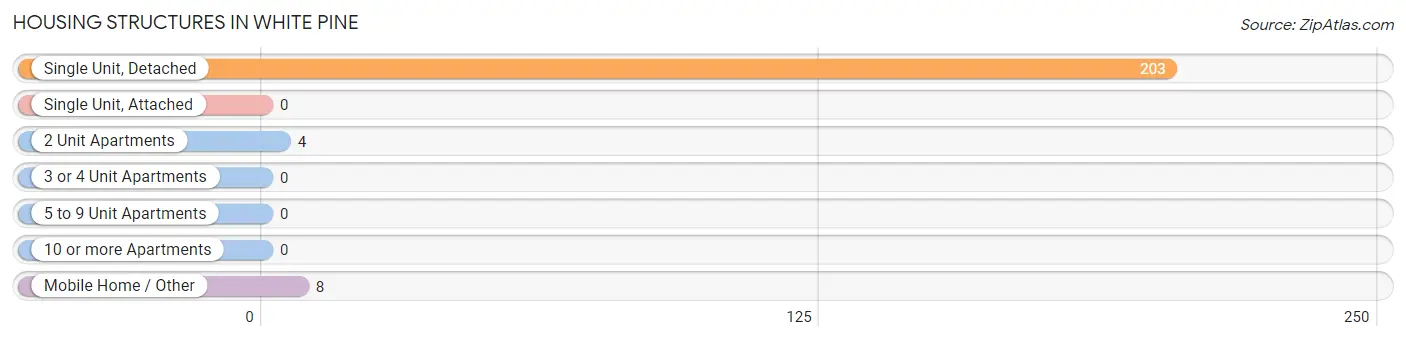
| Structure Type | # Housing Units | % Housing Units |
| Single Unit, Detached | 203 | 94.4% |
| Single Unit, Attached | 0 | 0.0% |
| 2 Unit Apartments | 4 | 1.9% |
| 3 or 4 Unit Apartments | 0 | 0.0% |
| 5 to 9 Unit Apartments | 0 | 0.0% |
| 10 or more Apartments | 0 | 0.0% |
| Mobile Home / Other | 8 | 3.7% |
| Total | 215 | 100.0% |
Housing Structures by Occupancy in White Pine
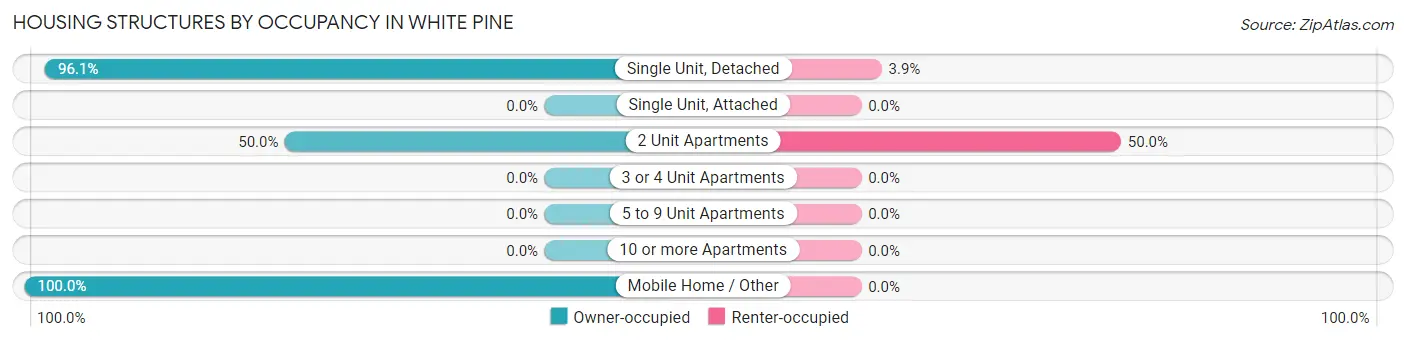
| Structure Type | Owner-occupied | Renter-occupied |
| Single Unit, Detached | 195 (96.1%) | 8 (3.9%) |
| Single Unit, Attached | 0 (0.0%) | 0 (0.0%) |
| 2 Unit Apartments | 2 (50.0%) | 2 (50.0%) |
| 3 or 4 Unit Apartments | 0 (0.0%) | 0 (0.0%) |
| 5 to 9 Unit Apartments | 0 (0.0%) | 0 (0.0%) |
| 10 or more Apartments | 0 (0.0%) | 0 (0.0%) |
| Mobile Home / Other | 8 (100.0%) | 0 (0.0%) |
| Total | 205 (95.4%) | 10 (4.6%) |
Housing Structures by Number of Rooms in White Pine
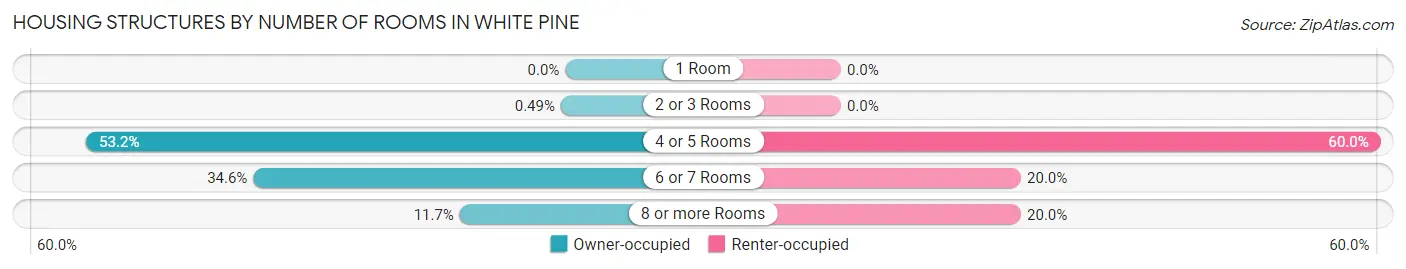
| Number of Rooms | Owner-occupied | Renter-occupied |
| 1 Room | 0 (0.0%) | 0 (0.0%) |
| 2 or 3 Rooms | 1 (0.5%) | 0 (0.0%) |
| 4 or 5 Rooms | 109 (53.2%) | 6 (60.0%) |
| 6 or 7 Rooms | 71 (34.6%) | 2 (20.0%) |
| 8 or more Rooms | 24 (11.7%) | 2 (20.0%) |
| Total | 205 (100.0%) | 10 (100.0%) |
Housing Structure by Heating Type in White Pine
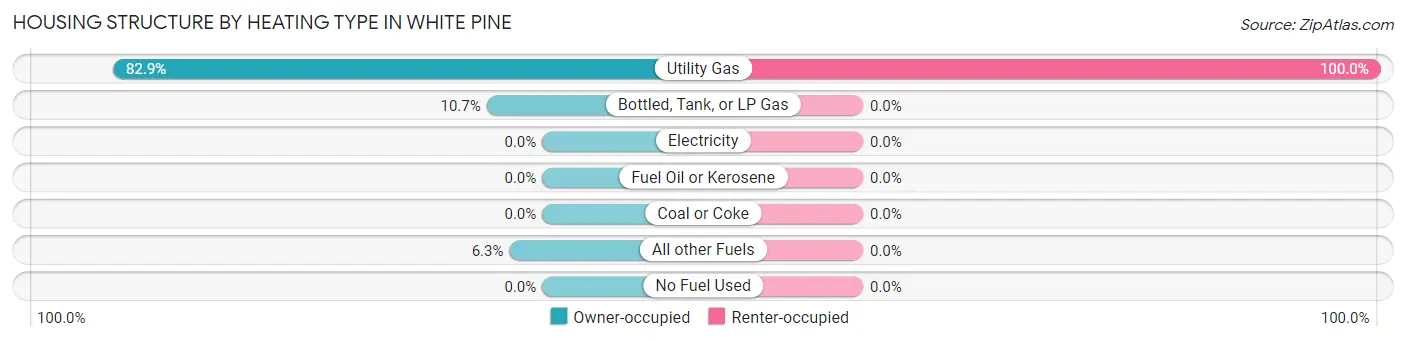
| Heating Type | Owner-occupied | Renter-occupied |
| Utility Gas | 170 (82.9%) | 10 (100.0%) |
| Bottled, Tank, or LP Gas | 22 (10.7%) | 0 (0.0%) |
| Electricity | 0 (0.0%) | 0 (0.0%) |
| Fuel Oil or Kerosene | 0 (0.0%) | 0 (0.0%) |
| Coal or Coke | 0 (0.0%) | 0 (0.0%) |
| All other Fuels | 13 (6.3%) | 0 (0.0%) |
| No Fuel Used | 0 (0.0%) | 0 (0.0%) |
| Total | 205 (100.0%) | 10 (100.0%) |
Household Vehicle Usage in White Pine
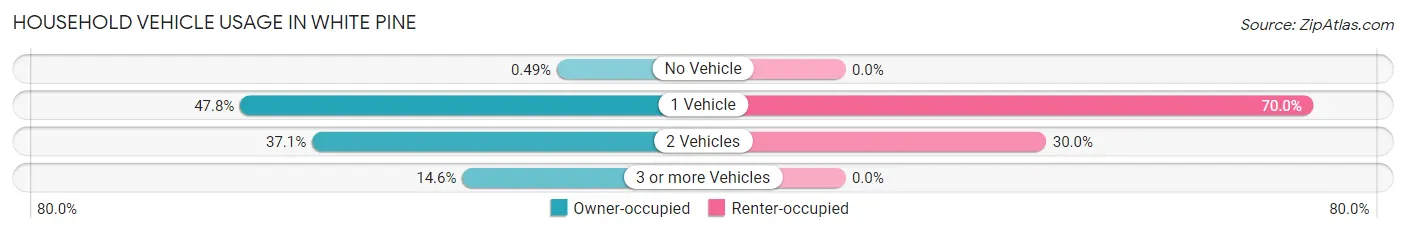
| Vehicles per Household | Owner-occupied | Renter-occupied |
| No Vehicle | 1 (0.5%) | 0 (0.0%) |
| 1 Vehicle | 98 (47.8%) | 7 (70.0%) |
| 2 Vehicles | 76 (37.1%) | 3 (30.0%) |
| 3 or more Vehicles | 30 (14.6%) | 0 (0.0%) |
| Total | 205 (100.0%) | 10 (100.0%) |
Real Estate & Mortgages in White Pine
Real Estate and Mortgage Overview in White Pine
| Characteristic | Without Mortgage | With Mortgage |
| Housing Units | 152 | 53 |
| Median Property Value | $48,300 | $56,100 |
| Median Household Income | $44,500 | $3 |
| Monthly Housing Costs | $339 | $0 |
| Real Estate Taxes | $511 | $2 |
Property Value by Mortgage Status in White Pine
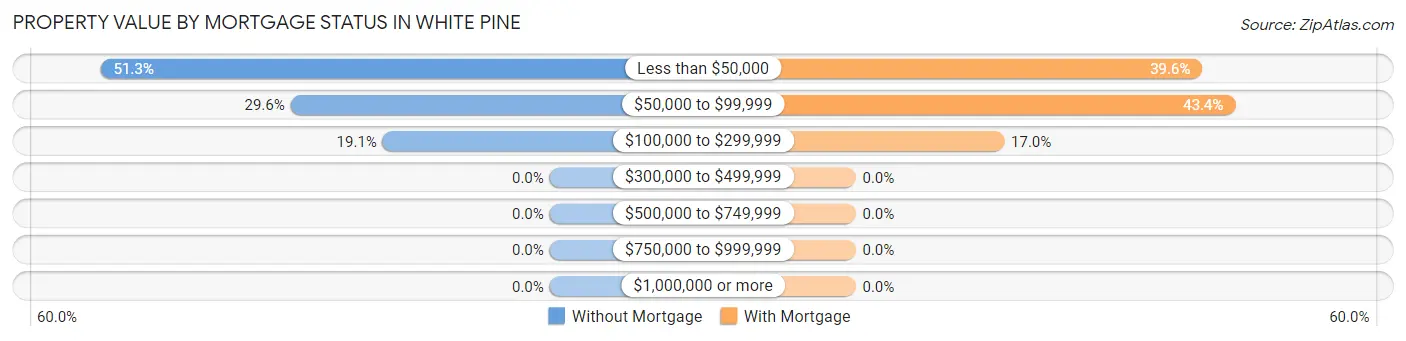
| Property Value | Without Mortgage | With Mortgage |
| Less than $50,000 | 78 (51.3%) | 21 (39.6%) |
| $50,000 to $99,999 | 45 (29.6%) | 23 (43.4%) |
| $100,000 to $299,999 | 29 (19.1%) | 9 (17.0%) |
| $300,000 to $499,999 | 0 (0.0%) | 0 (0.0%) |
| $500,000 to $749,999 | 0 (0.0%) | 0 (0.0%) |
| $750,000 to $999,999 | 0 (0.0%) | 0 (0.0%) |
| $1,000,000 or more | 0 (0.0%) | 0 (0.0%) |
| Total | 152 (100.0%) | 53 (100.0%) |
Household Income by Mortgage Status in White Pine
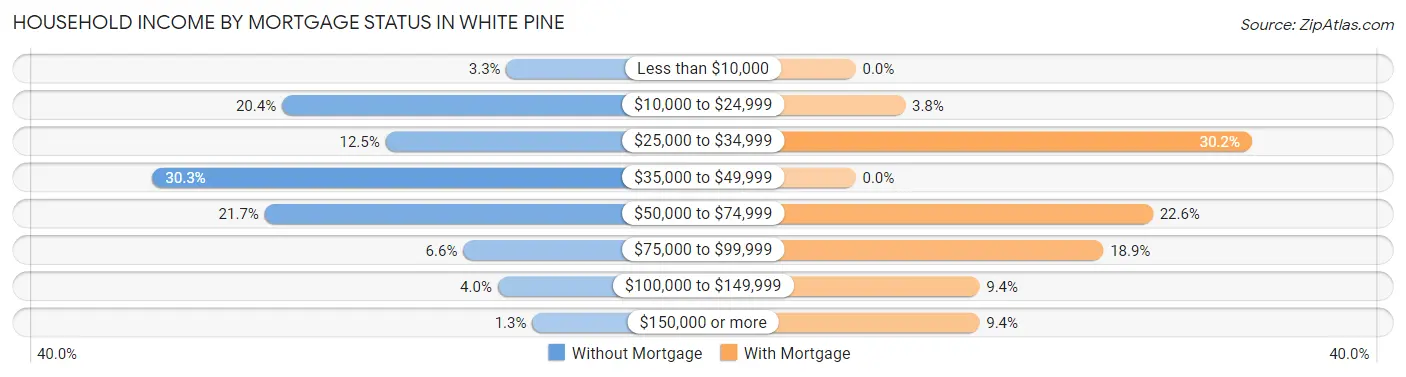
| Household Income | Without Mortgage | With Mortgage |
| Less than $10,000 | 5 (3.3%) | 0 (0.0%) |
| $10,000 to $24,999 | 31 (20.4%) | 2 (3.8%) |
| $25,000 to $34,999 | 19 (12.5%) | 16 (30.2%) |
| $35,000 to $49,999 | 46 (30.3%) | 0 (0.0%) |
| $50,000 to $74,999 | 33 (21.7%) | 12 (22.6%) |
| $75,000 to $99,999 | 10 (6.6%) | 10 (18.9%) |
| $100,000 to $149,999 | 6 (4.0%) | 5 (9.4%) |
| $150,000 or more | 2 (1.3%) | 5 (9.4%) |
| Total | 152 (100.0%) | 53 (100.0%) |
Property Value to Household Income Ratio in White Pine
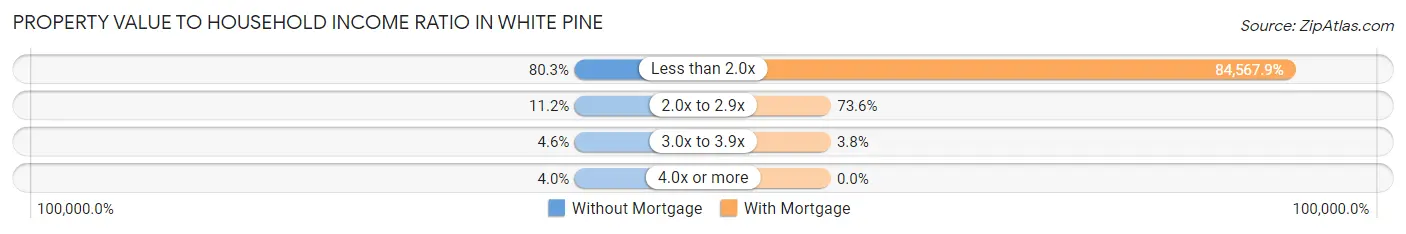
| Value-to-Income Ratio | Without Mortgage | With Mortgage |
| Less than 2.0x | 122 (80.3%) | 44,821 (84,567.9%) |
| 2.0x to 2.9x | 17 (11.2%) | 39 (73.6%) |
| 3.0x to 3.9x | 7 (4.6%) | 2 (3.8%) |
| 4.0x or more | 6 (4.0%) | 0 (0.0%) |
| Total | 152 (100.0%) | 53 (100.0%) |
Real Estate Taxes by Mortgage Status in White Pine
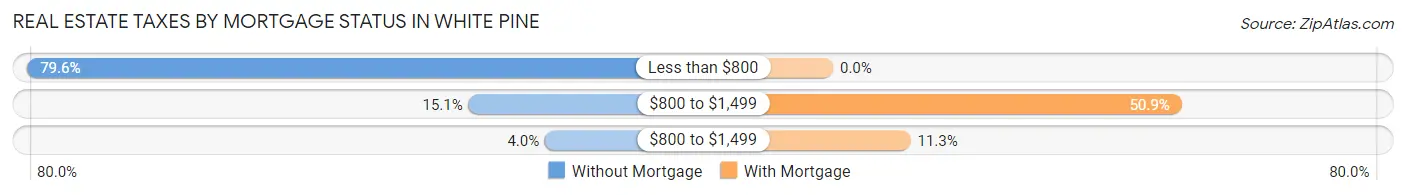
| Property Taxes | Without Mortgage | With Mortgage |
| Less than $800 | 121 (79.6%) | 0 (0.0%) |
| $800 to $1,499 | 23 (15.1%) | 27 (50.9%) |
| $800 to $1,499 | 6 (4.0%) | 6 (11.3%) |
| Total | 152 (100.0%) | 53 (100.0%) |
Health & Disability in White Pine
Health Insurance Coverage by Age in White Pine
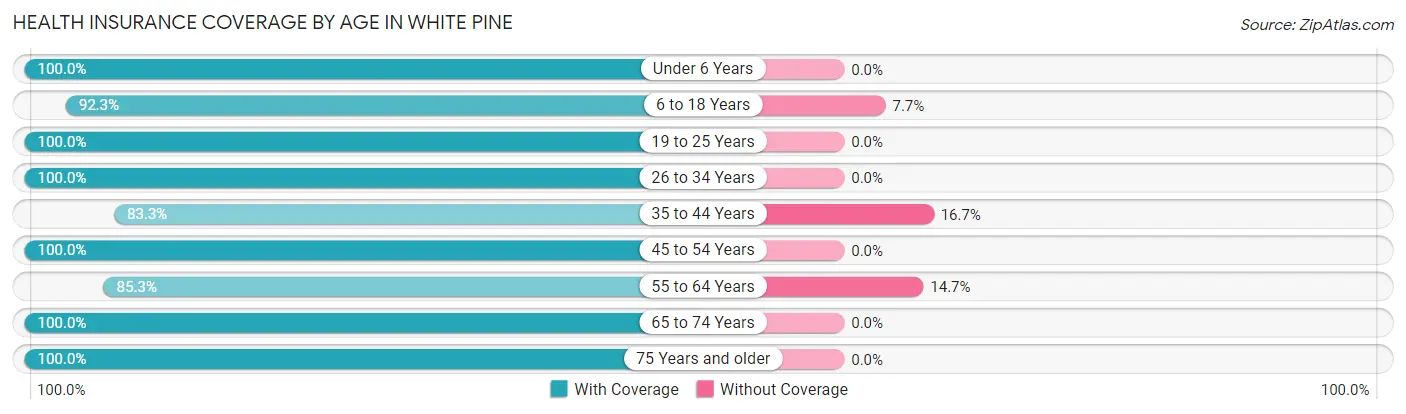
| Age Bracket | With Coverage | Without Coverage |
| Under 6 Years | 28 (100.0%) | 0 (0.0%) |
| 6 to 18 Years | 24 (92.3%) | 2 (7.7%) |
| 19 to 25 Years | 23 (100.0%) | 0 (0.0%) |
| 26 to 34 Years | 29 (100.0%) | 0 (0.0%) |
| 35 to 44 Years | 10 (83.3%) | 2 (16.7%) |
| 45 to 54 Years | 40 (100.0%) | 0 (0.0%) |
| 55 to 64 Years | 81 (85.3%) | 14 (14.7%) |
| 65 to 74 Years | 96 (100.0%) | 0 (0.0%) |
| 75 Years and older | 66 (100.0%) | 0 (0.0%) |
| Total | 397 (95.7%) | 18 (4.3%) |
Health Insurance Coverage by Citizenship Status in White Pine
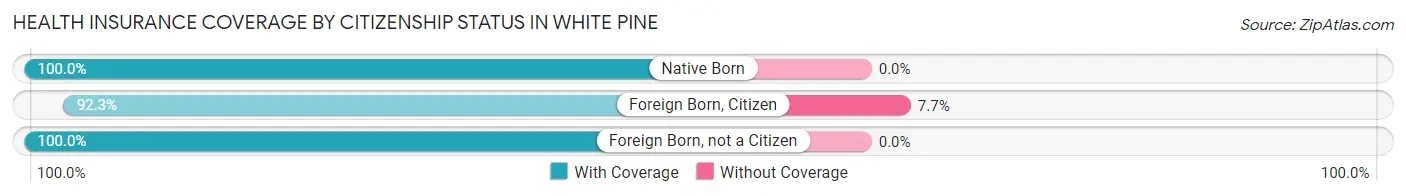
| Citizenship Status | With Coverage | Without Coverage |
| Native Born | 28 (100.0%) | 0 (0.0%) |
| Foreign Born, Citizen | 24 (92.3%) | 2 (7.7%) |
| Foreign Born, not a Citizen | 23 (100.0%) | 0 (0.0%) |
Health Insurance Coverage by Household Income in White Pine
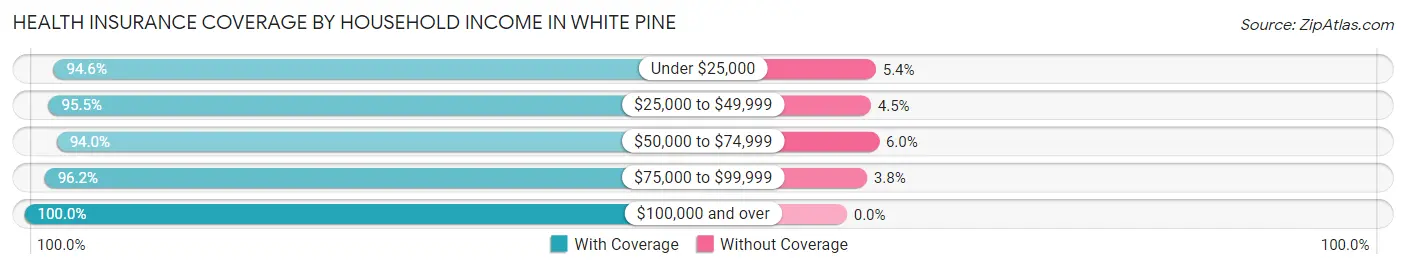
| Household Income | With Coverage | Without Coverage |
| Under $25,000 | 87 (94.6%) | 5 (5.4%) |
| $25,000 to $49,999 | 127 (95.5%) | 6 (4.5%) |
| $50,000 to $74,999 | 78 (94.0%) | 5 (6.0%) |
| $75,000 to $99,999 | 51 (96.2%) | 2 (3.8%) |
| $100,000 and over | 54 (100.0%) | 0 (0.0%) |
Public vs Private Health Insurance Coverage by Age in White Pine
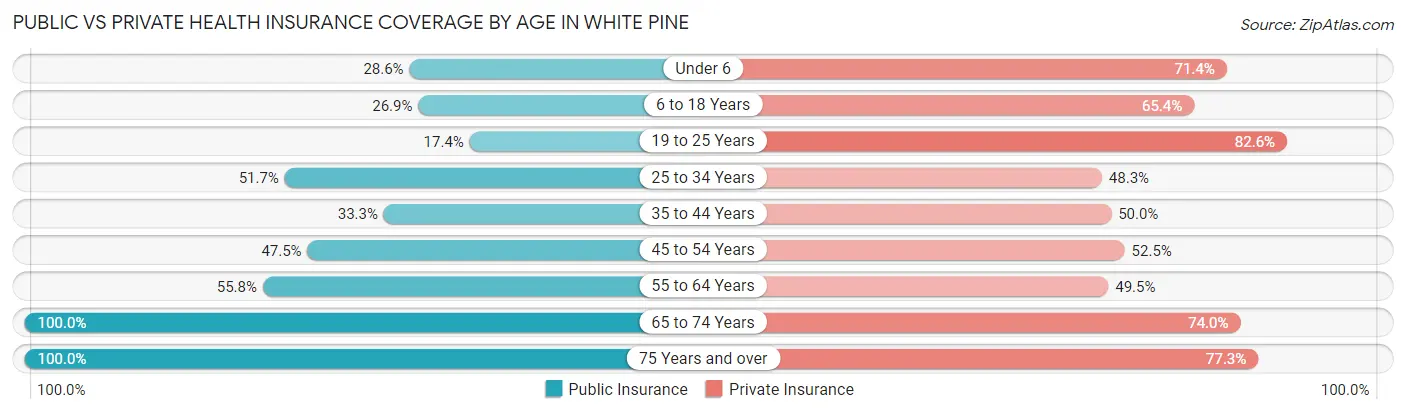
| Age Bracket | Public Insurance | Private Insurance |
| Under 6 | 8 (28.6%) | 20 (71.4%) |
| 6 to 18 Years | 7 (26.9%) | 17 (65.4%) |
| 19 to 25 Years | 4 (17.4%) | 19 (82.6%) |
| 25 to 34 Years | 15 (51.7%) | 14 (48.3%) |
| 35 to 44 Years | 4 (33.3%) | 6 (50.0%) |
| 45 to 54 Years | 19 (47.5%) | 21 (52.5%) |
| 55 to 64 Years | 53 (55.8%) | 47 (49.5%) |
| 65 to 74 Years | 96 (100.0%) | 71 (74.0%) |
| 75 Years and over | 66 (100.0%) | 51 (77.3%) |
| Total | 272 (65.5%) | 266 (64.1%) |
Disability Status by Sex by Age in White Pine
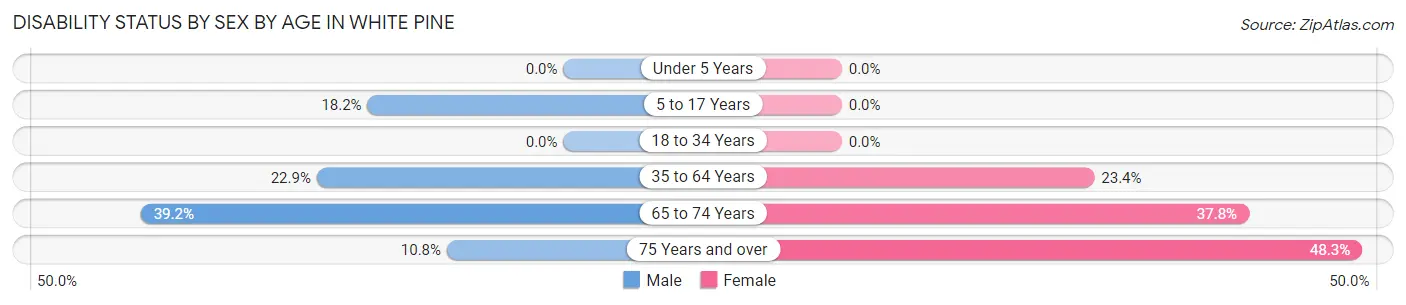
| Age Bracket | Male | Female |
| Under 5 Years | 0 (0.0%) | 0 (0.0%) |
| 5 to 17 Years | 2 (18.2%) | 0 (0.0%) |
| 18 to 34 Years | 0 (0.0%) | 0 (0.0%) |
| 35 to 64 Years | 19 (22.9%) | 15 (23.4%) |
| 65 to 74 Years | 20 (39.2%) | 17 (37.8%) |
| 75 Years and over | 4 (10.8%) | 14 (48.3%) |
Disability Class by Sex by Age in White Pine
Disability Class: Hearing Difficulty
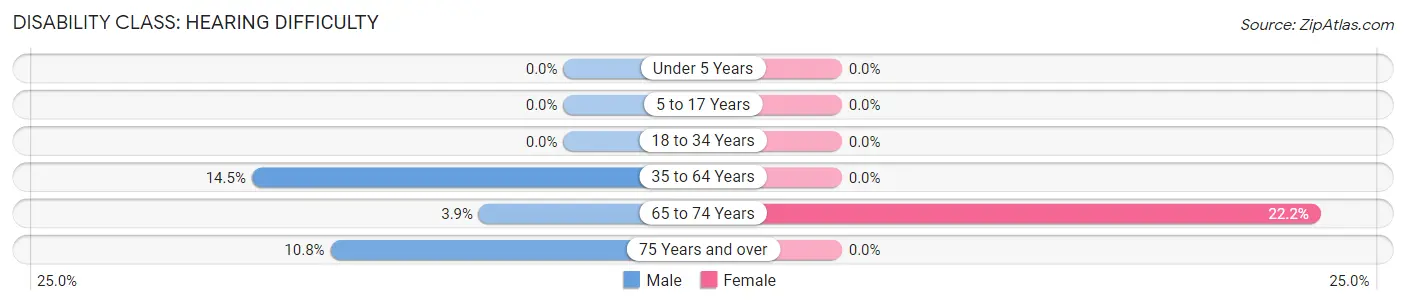
| Age Bracket | Male | Female |
| Under 5 Years | 0 (0.0%) | 0 (0.0%) |
| 5 to 17 Years | 0 (0.0%) | 0 (0.0%) |
| 18 to 34 Years | 0 (0.0%) | 0 (0.0%) |
| 35 to 64 Years | 12 (14.5%) | 0 (0.0%) |
| 65 to 74 Years | 2 (3.9%) | 10 (22.2%) |
| 75 Years and over | 4 (10.8%) | 0 (0.0%) |
Disability Class: Vision Difficulty
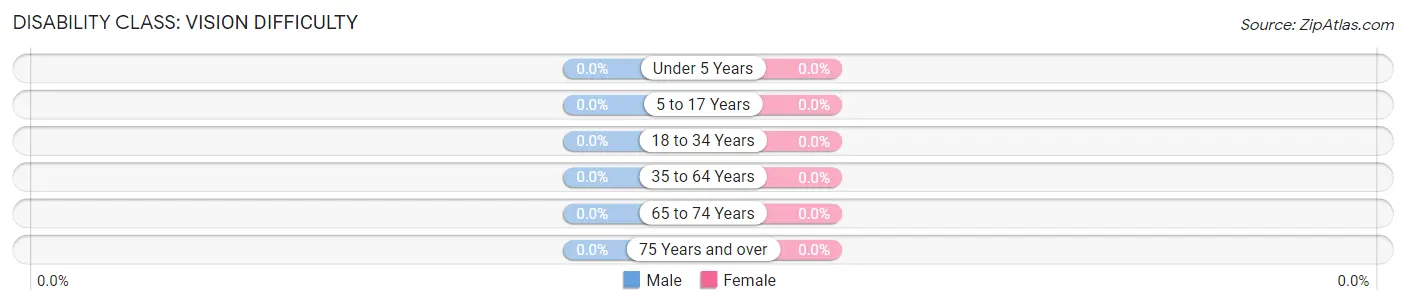
| Age Bracket | Male | Female |
| Under 5 Years | 0 (0.0%) | 0 (0.0%) |
| 5 to 17 Years | 0 (0.0%) | 0 (0.0%) |
| 18 to 34 Years | 0 (0.0%) | 0 (0.0%) |
| 35 to 64 Years | 0 (0.0%) | 0 (0.0%) |
| 65 to 74 Years | 0 (0.0%) | 0 (0.0%) |
| 75 Years and over | 0 (0.0%) | 0 (0.0%) |
Disability Class: Cognitive Difficulty
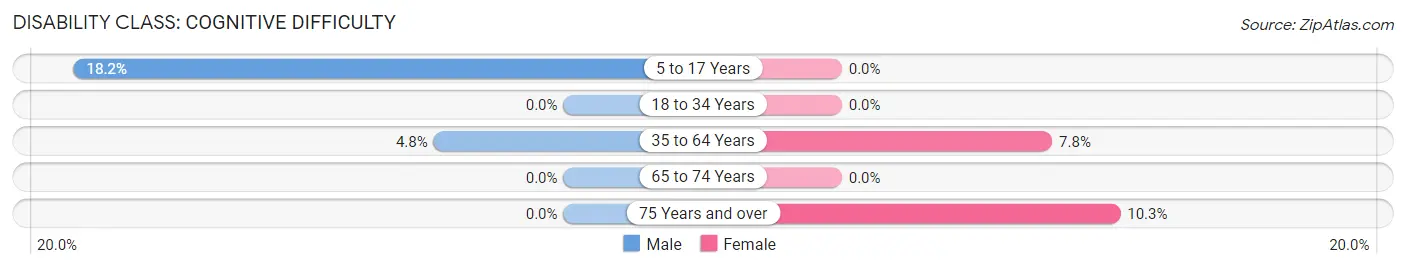
| Age Bracket | Male | Female |
| 5 to 17 Years | 2 (18.2%) | 0 (0.0%) |
| 18 to 34 Years | 0 (0.0%) | 0 (0.0%) |
| 35 to 64 Years | 4 (4.8%) | 5 (7.8%) |
| 65 to 74 Years | 0 (0.0%) | 0 (0.0%) |
| 75 Years and over | 0 (0.0%) | 3 (10.3%) |
Disability Class: Ambulatory Difficulty
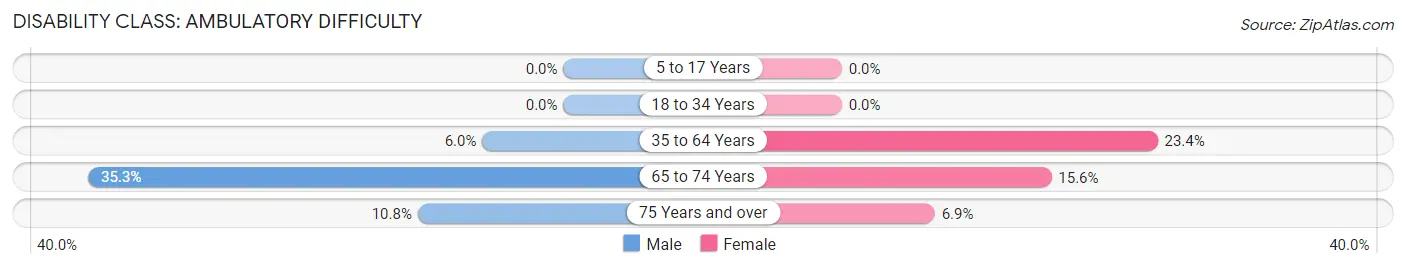
| Age Bracket | Male | Female |
| 5 to 17 Years | 0 (0.0%) | 0 (0.0%) |
| 18 to 34 Years | 0 (0.0%) | 0 (0.0%) |
| 35 to 64 Years | 5 (6.0%) | 15 (23.4%) |
| 65 to 74 Years | 18 (35.3%) | 7 (15.6%) |
| 75 Years and over | 4 (10.8%) | 2 (6.9%) |
Disability Class: Self-Care Difficulty
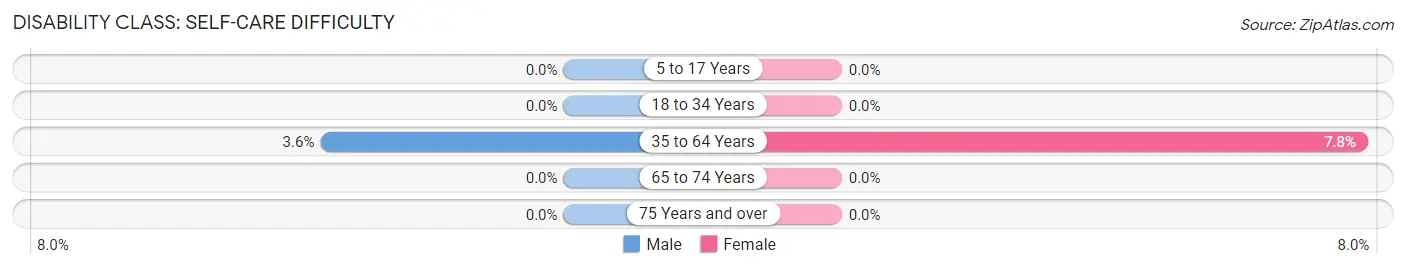
| Age Bracket | Male | Female |
| 5 to 17 Years | 0 (0.0%) | 0 (0.0%) |
| 18 to 34 Years | 0 (0.0%) | 0 (0.0%) |
| 35 to 64 Years | 3 (3.6%) | 5 (7.8%) |
| 65 to 74 Years | 0 (0.0%) | 0 (0.0%) |
| 75 Years and over | 0 (0.0%) | 0 (0.0%) |
Technology Access in White Pine
Computing Device Access in White Pine
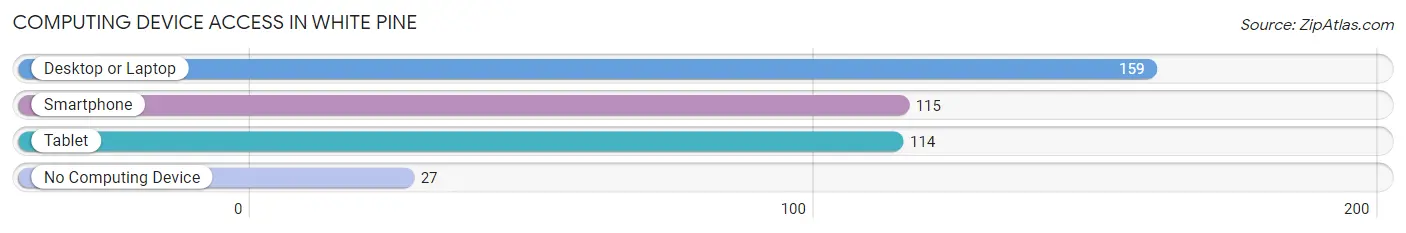
| Device Type | # Households | % Households |
| Desktop or Laptop | 159 | 74.0% |
| Smartphone | 115 | 53.5% |
| Tablet | 114 | 53.0% |
| No Computing Device | 27 | 12.6% |
| Total | 215 | 100.0% |
Internet Access in White Pine
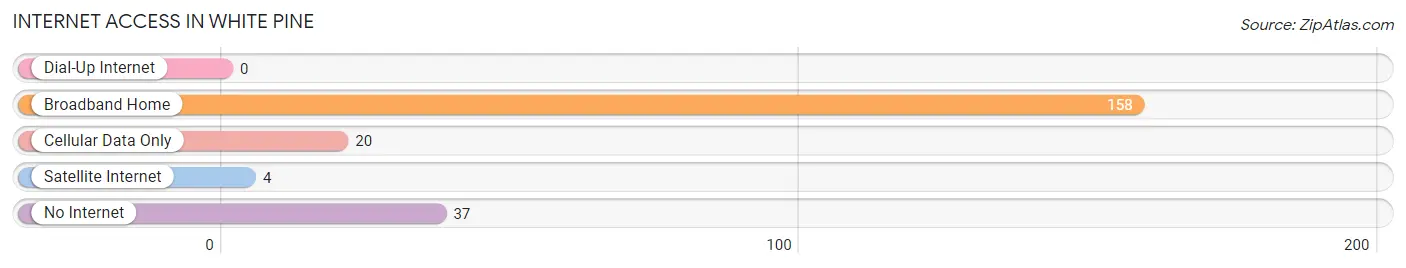
| Internet Type | # Households | % Households |
| Dial-Up Internet | 0 | 0.0% |
| Broadband Home | 158 | 73.5% |
| Cellular Data Only | 20 | 9.3% |
| Satellite Internet | 4 | 1.9% |
| No Internet | 37 | 17.2% |
| Total | 215 | 100.0% |
White Pine Summary
History
White Pine, Michigan is a small unincorporated community located in Ontonagon County in the Upper Peninsula of Michigan. The area was first settled in the late 1800s by Finnish immigrants who were drawn to the area by the abundance of timber and the promise of a better life. The area was originally known as “Finn Town” and was home to a large Finnish population. The town was officially incorporated in 1891 and was named after the white pine trees that were abundant in the area.
The town quickly grew and prospered due to the logging industry. The area was home to several sawmills and lumber companies, which provided employment for many of the residents. The town also had a thriving commercial district, which included a variety of stores, restaurants, and other businesses.
In the early 1900s, the town began to decline as the logging industry began to decline. The town’s population began to dwindle and many of the businesses closed. The town was eventually annexed by Ontonagon County in the 1950s.
Today, White Pine is a small, rural community with a population of just over 500 people. The town is still home to a few sawmills and lumber companies, but the majority of the population is employed in the tourism industry. The town is a popular destination for outdoor enthusiasts, as it is located near several lakes and rivers.
Geography
White Pine is located in the Upper Peninsula of Michigan, in Ontonagon County. The town is situated on the banks of the Ontonagon River, which flows through the area. The town is surrounded by forests and is home to several lakes, including Lake Gogebic, Lake of the Clouds, and Lake Superior.
The town is located approximately 30 miles from the city of Ontonagon and is about a two-hour drive from the cities of Marquette and Ironwood. The town is also located near the Porcupine Mountains Wilderness State Park, which is a popular destination for outdoor enthusiasts.
Economy
White Pine’s economy is largely based on the tourism industry. The town is a popular destination for outdoor enthusiasts, as it is located near several lakes and rivers. The town is also home to several sawmills and lumber companies, which provide employment for many of the residents.
The town is also home to several small businesses, including restaurants, stores, and other services. The town is also home to a few small manufacturing companies, which produce a variety of products.
Demographics
As of the 2010 census, White Pine had a population of 517 people. The town is predominantly white, with 95.3% of the population identifying as white. The town also has a small Native American population, with 1.2% of the population identifying as Native American.
The median household income in White Pine is $37,500, which is slightly lower than the national median of $50,000. The town also has a poverty rate of 16.3%, which is slightly higher than the national average of 14.7%.
Conclusion
White Pine, Michigan is a small, rural community located in Ontonagon County in the Upper Peninsula of Michigan. The town was originally settled by Finnish immigrants in the late 1800s and was home to a large Finnish population. The town’s economy is largely based on the tourism industry, as it is a popular destination for outdoor enthusiasts. The town also has a small manufacturing sector and is home to several small businesses. The town has a population of 517 people, with 95.3% of the population identifying as white and 1.2% identifying as Native American. The median household income in White Pine is $37,500 and the town has a poverty rate of 16.3%.
Common Questions
What is Per Capita Income in White Pine?
Per Capita income in White Pine is $25,877.
What is the Median Family Income in White Pine?
Median Family Income in White Pine is $53,125.
What is the Median Household income in White Pine?
Median Household Income in White Pine is $44,602.
What is Income or Wage Gap in White Pine?
Income or Wage Gap in White Pine is 0.1%.
Women in White Pine earn 99.9 cents for every dollar earned by a man.
What is Inequality or Gini Index in White Pine?
Inequality or Gini Index in White Pine is 0.37.
What is the Total Population of White Pine?
Total Population of White Pine is 415.
What is the Total Male Population of White Pine?
Total Male Population of White Pine is 211.
What is the Total Female Population of White Pine?
Total Female Population of White Pine is 204.
What is the Ratio of Males per 100 Females in White Pine?
There are 103.43 Males per 100 Females in White Pine.
What is the Ratio of Females per 100 Males in White Pine?
There are 96.68 Females per 100 Males in White Pine.
What is the Median Population Age in White Pine?
Median Population Age in White Pine is 62.3 Years.
What is the Average Family Size in White Pine
Average Family Size in White Pine is 2.5 People.
What is the Average Household Size in White Pine
Average Household Size in White Pine is 1.9 People.
How Large is the Labor Force in White Pine?
There are 119 People in the Labor Forcein in White Pine.
What is the Percentage of People in the Labor Force in White Pine?
31.8% of People are in the Labor Force in White Pine.
What is the Unemployment Rate in White Pine?
Unemployment Rate in White Pine is 0.8%.